Races in Mount Rainier, Maryland (MD) Detailed Stats
Data:
Races - White alone (%)
Races - White alone (% change since 2000)
Races - Black alone (%)
Races - Black alone (% change since 2000)
Races - American Indian alone (%)
Races - American Indian alone (% change since 2000)
Races - Asian alone (%)
Races - Asian alone (% change since 2000)
Races - Hispanic (%)
Races - Hispanic (% change since 2000)
Races - Native Hawaiian and Other Pacific Islander alone (%)
Races - Native Hawaiian and Other Pacific Islander alone (% change since 2000)
Races - Two or more races(%)
Races - Two or more races(% change since 2000)
Races - Other race alone (%)
Races - Other race alone (% change since 2000)
Racial diversity
Place of birth - Born in state of residence (%)
Place of birth - Born in state of residence (%) - White
Place of birth - Born in state of residence (%) - Black or African American
Place of birth - Born in state of residence (%) - Asian
Place of birth - Born in state of residence (%) - Hispanic or Latino
Place of birth - Born in state of residence (%) - American Indian and Alaska Native
Place of birth - Born in state of residence (%) - Multirace
Place of birth - Born in state of residence (%) - Other Race
Place of birth - Born in other state (%)
Place of birth - Born in other state (%) - White
Place of birth - Born in other state (%) - Black or African American
Place of birth - Born in other state (%) - Asian
Place of birth - Born in other state (%) - Hispanic or Latino
Place of birth - Born in other state (%) - American Indian and Alaska Native
Place of birth - Born in other state (%) - Multirace
Place of birth - Born in other state (%) - Other Race
Place of birth - Native, outside of US (%)
Place of birth - Native, outside of US (%) - White
Place of birth - Native, outside of US (%) - Black or African American
Place of birth - Native, outside of US (%) - Asian
Place of birth - Native, outside of US (%) - Hispanic or Latino
Place of birth - Native, outside of US (%) - American Indian and Alaska Native
Place of birth - Native, outside of US (%) - Multirace
Place of birth - Native, outside of US (%) - Other Race
Place of birth - Foreign born (%)
Place of birth - Foreign born (%) - White
Place of birth - Foreign born (%) - Black or African American
Place of birth - Foreign born (%) - Asian
Place of birth - Foreign born (%) - Hispanic or Latino
Place of birth - Foreign born (%) - American Indian and Alaska Native
Place of birth - Foreign born (%) - Multirace
Place of birth - Foreign born (%) - Other Race
Residents speaking English at home (%)
Residents speaking English at home - Born in the United States (%)
Residents speaking English at home - Native, born elsewhere (%)
Residents speaking English at home - Foreign born (%)
Residents speaking Spanish at home (%)
Residents speaking Spanish at home - Born in the United States (%)
Residents speaking Spanish at home - Native, born elsewhere (%)
Residents speaking Spanish at home - Foreign born (%)
Residents speaking other language at home (%)
Residents speaking other language at home - Born in the United States (%)
Residents speaking other language at home - Native, born elsewhere (%)
Residents speaking other language at home - Foreign born (%)
Marital status - Never married (%)
Marital status - Now married (%)
Marital status - Separated (%)
Marital status - Widowed (%)
Marital status - Divorced (%)
Ancestries Reported - Arab (%)
Ancestries Reported - Czech (%)
Ancestries Reported - Danish (%)
Ancestries Reported - Dutch (%)
Ancestries Reported - English (%)
Ancestries Reported - French (%)
Ancestries Reported - French Canadian (%)
Ancestries Reported - German (%)
Ancestries Reported - Greek (%)
Ancestries Reported - Hungarian (%)
Ancestries Reported - Irish (%)
Ancestries Reported - Italian (%)
Ancestries Reported - Lithuanian (%)
Ancestries Reported - Norwegian (%)
Ancestries Reported - Polish (%)
Ancestries Reported - Portuguese (%)
Ancestries Reported - Russian (%)
Ancestries Reported - Scotch-Irish (%)
Ancestries Reported - Scottish (%)
Ancestries Reported - Slovak (%)
Ancestries Reported - Subsaharan African (%)
Ancestries Reported - Swedish (%)
Ancestries Reported - Swiss (%)
Ancestries Reported - Ukrainian (%)
Ancestries Reported - United States (%)
Ancestries Reported - Welsh (%)
Ancestries Reported - West Indian (%)
Ancestries Reported - Other (%)
Geographical mobility - Same house 1 year ago (%)
Geographical mobility - Same house 1 year ago (%) - White
Geographical mobility - Same house 1 year ago (%) - Black or African American
Geographical mobility - Same house 1 year ago (%) - Asian
Geographical mobility - Same house 1 year ago (%) - Hispanic or Latino
Geographical mobility - Same house 1 year ago (%) - American Indian and Alaska Native
Geographical mobility - Same house 1 year ago (%) - Multirace
Geographical mobility - Same house 1 year ago (%) - Other Race
Geographical mobility - Moved within same county (%)
Geographical mobility - Moved within same county (%) - White
Geographical mobility - Moved within same county (%) - Black or African American
Geographical mobility - Moved within same county (%) - Asian
Geographical mobility - Moved within same county (%) - Hispanic or Latino
Geographical mobility - Moved within same county (%) - American Indian and Alaska Native
Geographical mobility - Moved within same county (%) - Multirace
Geographical mobility - Moved within same county (%) - Other Race
Geographical mobility - Moved from different county within same state (%)
Geographical mobility - Moved from different county within same state (%) - White
Geographical mobility - Moved from different county within same state (%) - Black or African American
Geographical mobility - Moved from different county within same state (%) - Asian
Geographical mobility - Moved from different county within same state (%) - Hispanic or Latino
Geographical mobility - Moved from different county within same state (%) - American Indian and Alaska Native
Geographical mobility - Moved from different county within same state (%) - Multirace
Geographical mobility - Moved from different county within same state (%) - Other Race
Geographical mobility - Moved from different state (%)
Geographical mobility - Moved from different state (%) - White
Geographical mobility - Moved from different state (%) - Black or African American
Geographical mobility - Moved from different state (%) - Asian
Geographical mobility - Moved from different state (%) - Hispanic or Latino
Geographical mobility - Moved from different state (%) - American Indian and Alaska Native
Geographical mobility - Moved from different state (%) - Multirace
Geographical mobility - Moved from different state (%) - Other Race
Geographical mobility - Moved from abroad (%)
Geographical mobility - Moved from abroad (%) - White
Geographical mobility - Moved from abroad (%) - Black or African American
Geographical mobility - Moved from abroad (%) - Asian
Geographical mobility - Moved from abroad (%) - Hispanic or Latino
Geographical mobility - Moved from abroad (%) - American Indian and Alaska Native
Geographical mobility - Moved from abroad (%) - Multirace
Geographical mobility - Moved from abroad (%) - Other Race
Place of birth for the foreign-born population - Ireland (%)
Place of birth for the foreign-born population - Denmark (%)
Place of birth for the foreign-born population - Norway (%)
Place of birth for the foreign-born population - Sweden (%)
Place of birth for the foreign-born population - United Kingdom (%)
Place of birth for the foreign-born population - England (%)
Place of birth for the foreign-born population - Scotland (%)
Place of birth for the foreign-born population - Other Northern Europe (%)
Place of birth for the foreign-born population - Austria (%)
Place of birth for the foreign-born population - Belgium (%)
Place of birth for the foreign-born population - France (%)
Place of birth for the foreign-born population - Germany (%)
Place of birth for the foreign-born population - Netherlands (%)
Place of birth for the foreign-born population - Switzerland (%)
Place of birth for the foreign-born population - Other Western Europe (%)
Place of birth for the foreign-born population - Greece (%)
Place of birth for the foreign-born population - Italy (%)
Place of birth for the foreign-born population - Portugal (%)
Place of birth for the foreign-born population - Spain (%)
Place of birth for the foreign-born population - Other Southern Europe (%)
Place of birth for the foreign-born population - Albania (%)
Place of birth for the foreign-born population - Belarus (%)
Place of birth for the foreign-born population - Bosnia and Herzegovina (%)
Place of birth for the foreign-born population - Bulgaria (%)
Place of birth for the foreign-born population - Croatia (%)
Place of birth for the foreign-born population - Czechoslovakia (%)
Place of birth for the foreign-born population - Hungary (%)
Place of birth for the foreign-born population - Latvia (%)
Place of birth for the foreign-born population - Lithuania (%)
Place of birth for the foreign-born population - North Macedonia (Macedonia) (%)
Place of birth for the foreign-born population - Moldova (%)
Place of birth for the foreign-born population - Poland (%)
Place of birth for the foreign-born population - Romania (%)
Place of birth for the foreign-born population - Russia (%)
Place of birth for the foreign-born population - Serbia (%)
Place of birth for the foreign-born population - Ukraine (%)
Place of birth for the foreign-born population - Other Eastern Europe (%)
Place of birth for the foreign-born population - China (%)
Place of birth for the foreign-born population - Hong Kong (%)
Place of birth for the foreign-born population - Taiwan (%)
Place of birth for the foreign-born population - Japan (%)
Place of birth for the foreign-born population - Korea (%)
Place of birth for the foreign-born population - Other Eastern Asia (%)
Place of birth for the foreign-born population - Afghanistan (%)
Place of birth for the foreign-born population - Bangladesh (%)
Place of birth for the foreign-born population - India (%)
Place of birth for the foreign-born population - Iran (%)
Place of birth for the foreign-born population - Kazakhstan (%)
Place of birth for the foreign-born population - Nepal (%)
Place of birth for the foreign-born population - Pakistan (%)
Place of birth for the foreign-born population - Sri Lanka (%)
Place of birth for the foreign-born population - Uzbekistan (%)
Place of birth for the foreign-born population - Other South Central Asia (%)
Place of birth for the foreign-born population - Burma (%)
Place of birth for the foreign-born population - Cambodia (%)
Place of birth for the foreign-born population - Indonesia (%)
Place of birth for the foreign-born population - Laos (%)
Place of birth for the foreign-born population - Malaysia (%)
Place of birth for the foreign-born population - Philippines (%)
Place of birth for the foreign-born population - Singapore (%)
Place of birth for the foreign-born population - Thailand (%)
Place of birth for the foreign-born population - Vietnam (%)
Place of birth for the foreign-born population - Other South Eastern Asia (%)
Place of birth for the foreign-born population - Armenia (%)
Place of birth for the foreign-born population - Iraq (%)
Place of birth for the foreign-born population - Israel (%)
Place of birth for the foreign-born population - Jordan (%)
Place of birth for the foreign-born population - Kuwait (%)
Place of birth for the foreign-born population - Lebanon (%)
Place of birth for the foreign-born population - Saudi Arabia (%)
Place of birth for the foreign-born population - Syria (%)
Place of birth for the foreign-born population - Turkey (%)
Place of birth for the foreign-born population - Yemen (%)
Place of birth for the foreign-born population - Other Western Asia (%)
Place of birth for the foreign-born population - Eritrea (%)
Place of birth for the foreign-born population - Ethiopia (%)
Place of birth for the foreign-born population - Kenya (%)
Place of birth for the foreign-born population - Somalia (%)
Place of birth for the foreign-born population - Uganda (%)
Place of birth for the foreign-born population - Zimbabwe (%)
Place of birth for the foreign-born population - Other Eastern Africa (%)
Place of birth for the foreign-born population - Cameroon (%)
Place of birth for the foreign-born population - Congo (%)
Place of birth for the foreign-born population - Democratic Republic of Congo (Zaire) (%)
Place of birth for the foreign-born population - Other Middle Africa (%)
Place of birth for the foreign-born population - Egypt (%)
Place of birth for the foreign-born population - Morocco (%)
Place of birth for the foreign-born population - Sudan (%)
Place of birth for the foreign-born population - Other Northern Africa (%)
Place of birth for the foreign-born population - South Africa (%)
Place of birth for the foreign-born population - Other Southern Africa (%)
Place of birth for the foreign-born population - Cabo Verde (%)
Place of birth for the foreign-born population - Ghana (%)
Place of birth for the foreign-born population - Liberia (%)
Place of birth for the foreign-born population - Nigeria (%)
Place of birth for the foreign-born population - Senegal (%)
Place of birth for the foreign-born population - Sierra Leone (%)
Place of birth for the foreign-born population - Other Western Africa (%)
Place of birth for the foreign-born population - Australia (%)
Place of birth for the foreign-born population - New Zealand (%)
Place of birth for the foreign-born population - Fiji (%)
Place of birth for the foreign-born population - Micronesia (%)
Place of birth for the foreign-born population - Bahamas (%)
Place of birth for the foreign-born population - Barbados (%)
Place of birth for the foreign-born population - Cuba (%)
Place of birth for the foreign-born population - Dominica (%)
Place of birth for the foreign-born population - Dominican Republic (%)
Place of birth for the foreign-born population - Grenada (%)
Place of birth for the foreign-born population - Haiti (%)
Place of birth for the foreign-born population - Jamaica (%)
Place of birth for the foreign-born population - St. Vincent and the Grenadines (%)
Place of birth for the foreign-born population - Trinidad and Tobago (%)
Place of birth for the foreign-born population - West Indies (%)
Place of birth for the foreign-born population - Other Caribbean (%)
Place of birth for the foreign-born population - Belize (%)
Place of birth for the foreign-born population - Costa Rica (%)
Place of birth for the foreign-born population - El Salvador (%)
Place of birth for the foreign-born population - Guatemala (%)
Place of birth for the foreign-born population - Honduras (%)
Place of birth for the foreign-born population - Mexico (%)
Place of birth for the foreign-born population - Nicaragua (%)
Place of birth for the foreign-born population - Panama (%)
Place of birth for the foreign-born population - Other Central America (%)
Place of birth for the foreign-born population - Argentina (%)
Place of birth for the foreign-born population - Bolivia (%)
Place of birth for the foreign-born population - Brazil (%)
Place of birth for the foreign-born population - Chile (%)
Place of birth for the foreign-born population - Colombia (%)
Place of birth for the foreign-born population - Ecuador (%)
Place of birth for the foreign-born population - Guyana (%)
Place of birth for the foreign-born population - Peru (%)
Place of birth for the foreign-born population - Uruguay (%)
Place of birth for the foreign-born population - Venezuela (%)
Place of birth for the foreign-born population - Other South America (%)
Place of birth for the foreign-born population - Canada (%)
Place of birth for the foreign-born population - Other Northern America (%)
Place of birth for the foreign-born population - Other (%)
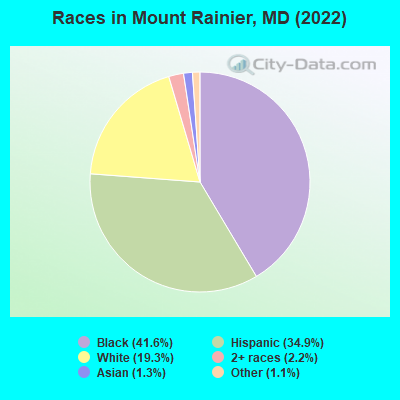
According to 2022 data, the most numerous races in Mount Rainier, MD are White alone (1,579 residents), Black alone (3,401 residents), and Hispanic (2,856 residents). 54.5% of Mount Rainier residents speak English at home. 36.5% of Mount Rainier, MD residents are foreign-born (25.8% born in Latin America, 5.8% born in Africa), which is 56.1% greater than the foreign-born rate of 16.0% across the entire state of Maryland.
Race distribution in Mount Rainier
2000 2022
3,286,547 62.1% White alone 1,464,735 27.7% Black alone 227,916 4.3% Hispanic 209,738 4.0% Asian alone 82,946 1.6% Two or more races 13,312 0.3% American Indian alone 9,379 0.2% Other race alone 1,913 0.04% Native Hawaiian and Other
2,906,492 47.1% White alone 1,800,914 29.2% Black alone 705,842 11.4% Hispanic 401,818 6.5% Asian alone 291,317 4.7% Two or more races 46,930 0.8% Other race alone 8,930 0.1% American Indian alone 2,417 0.04% Native Hawaiian and Other
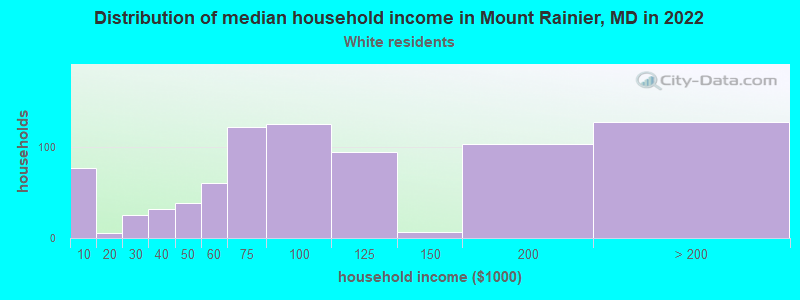
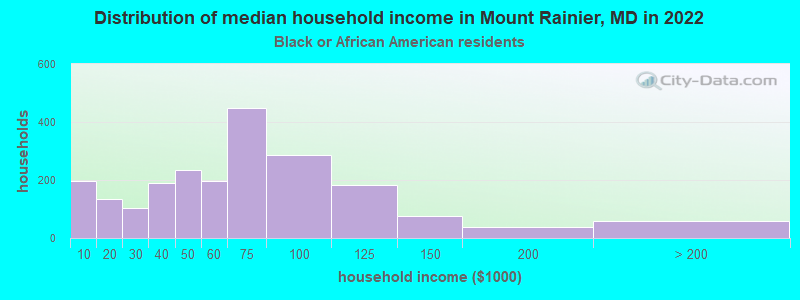
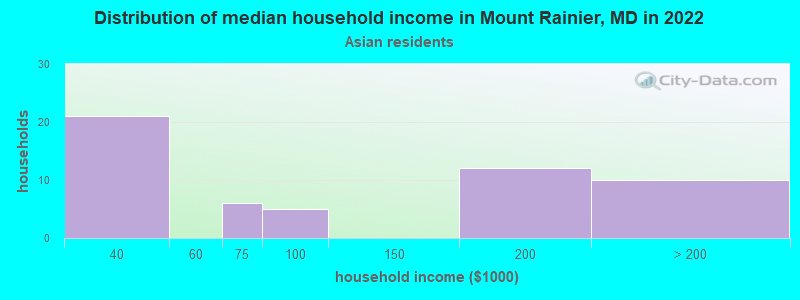
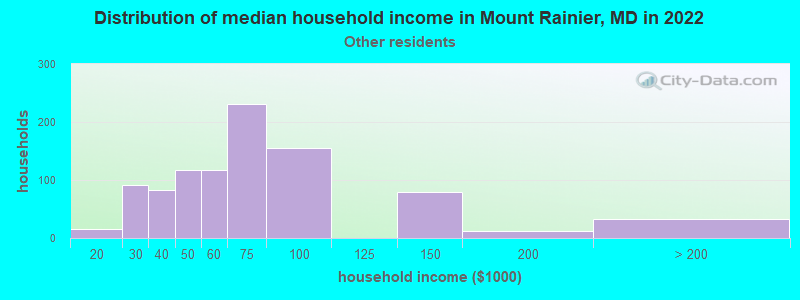
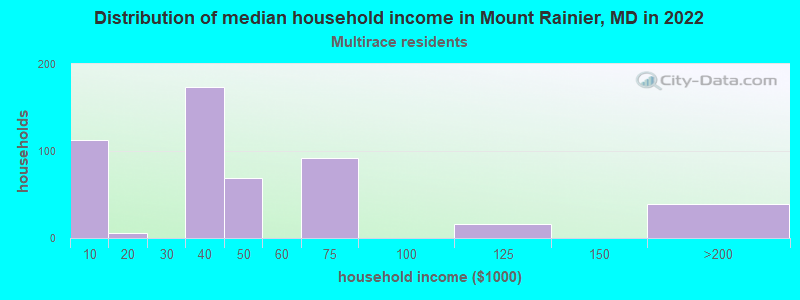
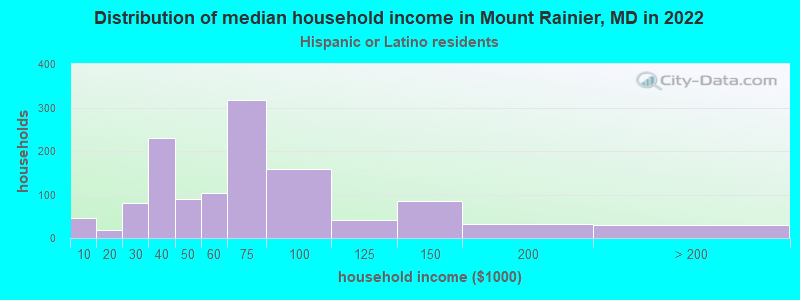
Income and house value in Mount Rainier Median household income in 2022 $86,679 White non-Hispanic householders$62,170 Black householders$60,318 Some other race householders$37,808 Two or more races householders$62,634 Hispanic or Latino race householdersMedian 2022 house value $541,690 White Non-Hispanic householders$532,622 Black or African American householders $702,527 Asian householders$409,966 Some other race householders$564,599 Two or more races householders$465,329 Hispanic or Latino householders
Median age by race in Mount Rainier
36.6 Median age for White residents37.4 36.5 48.4 Median age for Black or African American residents50.2 47.1 -780,410,741.7 Median age for American Indian / Alaska Native residents-888,297,871.5 -689,905,591.2 56.7 Median age for Asian residents53.8 43.5 -571,600,480.8 Median age for Native Hawaiian / Pacific Islander residents-720,061,021.4 -760,942,760.2 32.4 Median age for Other race residents32.1 24.1 43.5 Median age for Two or more races residents57.8 40.6 35.8 Median age for White alone residents35.2 38.0 38.3 Median age for Hispanic or Latino residents38.4 39.2
Owner/renter occupied households by race in Mount Rainier
House owners and renters - White residents 435 53.0% Owner occupied386 47.0% Renter occupiedHouse owners and renters - Black or African American residents 359 16.5% Owner occupied1,814 83.5% Renter occupiedHouse owners and renters - Asian residents 43 82.5% Owner occupied9 17.5% Renter occupiedHouse owners and renters - Other race residents 128 15.7% Owner occupied685 84.3% Renter occupiedHouse owners and renters - Two or more races residents 65 14.2% Owner occupied395 85.8% Renter occupiedHouse owners and renters - White alone residents 453 59.2% Owner occupied312 40.8% Renter occupiedHouse owners and renters - Hispanic or Latino residents 150 12.6% Owner occupied1,041 87.4% Renter occupied
Language usage in Mount Rainier
English speakers - Total 54.5% of residents of Mount Rainier speak English at home.
36.2% of residents speak Spanish at home 1,297 46.6% Speak English very well1,486 53.4% Speak English less than very well9.9% of residents speak other language at home 558 73.7% Speak English very well199 26.3% Speak English less than very well
English speakers - Born in the United States 86.2% of residents of Mount Rainier speak English at home.
9.5% of residents speak Spanish at home 348 98.0% Speak English very well7 2.0% Speak English less than very well5.3% of residents speak other language at home 197 100.0% Speak English very well
English speakers - Native, born elsewhere 0.4% of residents of Mount Rainier speak English at home.
109.2% of residents speak Spanish at home 113 43.3% Speak English very well148 56.7% Speak English less than very well
English speakers - Foreign-born 12.4% of residents of Mount Rainier speak English at home.
66.0% of residents speak Spanish at home 590 29.6% Speak English very well1,403 70.4% Speak English less than very well18.8% of residents speak other language at home 369 65.1% Speak English very well198 34.9% Speak English less than very well
White (Caucasian) - Speak another language Native:
14.6% (212)Foreign-born:
90.7% (81)
Black or African American - Speak only English Native:
96.2% (2,389)Foreign-born:
42.1% (357)
Black or African American - Speak another language Native:
3.8% (93)Foreign-born:
57.3% (485)
Asian - Speak only English Native:
78.1% (22)Foreign-born:
4.4% (4)
Other race - Speak another language Native:
92.4% (548)Foreign-born:
100.0% (1,539)
Two or more races - Speak only English Native:
58.4% (105)Foreign-born:
2.9% (16)
Two or more races - Speak another language Native:
43.4% (78)Foreign-born:
100.0% (568)
White alone - Speak another language Native:
11.0% (149)Foreign-born:
98.2% (47)
Hispanic or Latino - Speak another language Native:
96.5% (729)Foreign-born:
100.0% (2,005)
Foreign-born residents in Mount Rainier 2,981 residents are foreign born (25.8% Latin America , 5.8% Africa ).
This city:
36.5%Maryland:
15.7%
Marital status for residents in Mount Rainier Marital status - White (Caucasian) population 15 years and over
Males 26.2% Never married57.7% Now married8.0% Separated1.4% Widowed6.8% DivorcedFemales 40.6% Never married50.1% Now married0.0% Separated1.6% Widowed7.7% DivorcedWomen who gave birth in the past 12 months Now married:
100.0% (34)Unmarried:
0.0% (0)
Women who did not give birth in the past 12 months Now married:
42.5% (148)Unmarried:
57.5% (201)
Marital status - Black or African American population 15 years and over
Males 43.5% Never married29.3% Now married2.0% Separated11.2% Widowed14.0% DivorcedFemales 45.4% Never married29.5% Now married4.5% Separated7.4% Widowed13.2% DivorcedWomen who gave birth in the past 12 months Now married:
100.0% (60)Unmarried:
0.0% (0)
Women who did not give birth in the past 12 months Now married:
26.6% (210)Unmarried:
73.4% (579)
Marital status - Asian population 15 years and over
Males 38.1% Never married23.8% Now married0.0% Separated19.0% Widowed19.0% DivorcedFemales 6.2% Never married93.8% Now married0.0% Separated0.0% Widowed0.0% DivorcedWomen who did not give birth in the past 12 months Now married:
88.9% (23)Unmarried:
11.1% (3)
Marital status - Other race population 15 years and over
Males 42.4% Never married53.7% Now married0.0% Separated0.0% Widowed3.9% DivorcedFemales 36.9% Never married59.0% Now married1.4% Separated1.4% Widowed1.3% DivorcedWomen who gave birth in the past 12 months Now married:
0.0% (0)Unmarried:
100.0% (56)
Women who did not give birth in the past 12 months Now married:
51.8% (242)Unmarried:
48.2% (225)
Marital status - Two or more races population 15 years and over
Males 2.0% Never married83.4% Now married0.0% Separated0.0% Widowed14.6% DivorcedFemales 34.1% Never married65.9% Now married0.0% Separated0.0% Widowed0.0% DivorcedWomen who did not give birth in the past 12 months Now married:
64.7% (247)Unmarried:
35.3% (135)
Marital status - White alone, not Hispanic / Latino population 15 years and over
Males 23.0% Never married58.3% Now married9.3% Separated1.6% Widowed7.9% DivorcedFemales 39.4% Never married49.4% Now married0.0% Separated1.9% Widowed9.3% DivorcedWomen who gave birth in the past 12 months Now married:
100.0% (38)Unmarried:
0.0% (0)
Women who did not give birth in the past 12 months Now married:
47.1% (149)Unmarried:
52.9% (168)
Marital status - Hispanic or Latino population 15 years and over
Males 36.8% Never married59.3% Now married0.0% Separated0.0% Widowed3.9% DivorcedFemales 33.4% Never married63.9% Now married0.9% Separated0.9% Widowed0.8% DivorcedWomen who gave birth in the past 12 months Now married:
0.0% (0)Unmarried:
100.0% (51)
Women who did not give birth in the past 12 months Now married:
59.2% (463)Unmarried:
40.8% (319)
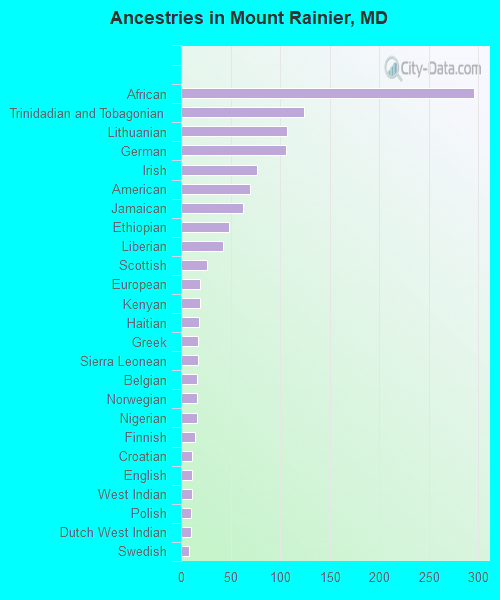
Ancestries in Mount Rainier
296 5.3% African124 2.2% Trinidadian and Tobagonian107 1.9% Lithuanian106 1.9% German77 1.4% Irish70 1.2% American63 1.1% Jamaican48 0.9% Ethiopian42 0.7% Liberian26 0.5% Scottish19 0.3% European19 0.3% Kenyan18 0.3% Haitian17 0.3% Greek17 0.3% Sierra Leonean16 0.3% Belgian16 0.3% Norwegian16 0.3% Nigerian14 0.2% Finnish11 0.2% Croatian11 0.2% English11 0.2% West Indian10 0.2% Polish10 0.2% Dutch West Indian8 0.1% Swedish4 0.07% Scotch-Irish
Geographical mobility in Mount Rainier Same house 1 year ago 1,535 94.3% White (Caucasian)2,981 87.7% Black or African American98 89.3% Asian1,934 88.0% Other race487 66.3% Two or more races1,461 95.3% White alone, not Hispanic / Latino2,371 84.2% Hispanic or LatinoMoved within same county 30 1.8% White / Caucasian201 5.9% Black or African American143 6.5% Other race272 37.0% Two or more races22 1.4% White alone, not Hispanic / Latino269 9.5% Hispanic or LatinoMoved within same state 58 3.6% White / Caucasian22 0.7% Black or African American11 10.4% Asian47 3.1% White alone, not Hispanic / Latino23 0.8% Hispanic or LatinoMoved from different state 12 0.7% White / Caucasian138 4.1% Black or African American51 2.3% Other race9 1.2% Two or more races13 0.8% White alone, not Hispanic / Latino56 2.0% Hispanic or LatinoMoved from abroad 12 0.7% White9 0.3% Black or African American12 0.8% White alone, not Hispanic / Latino
Children Nativity (place of birth) in Mount Rainier
Children under 6 years - Living with two parents Both parents native 131 100.0% NativeBoth parents foreign-born 179 100.0% NativeOne native, one foreign-born parent 46 100.0% NativeChildren under 6 years - Living with one parent Native parent 29 100.0% NativeForeign-born parent 100 100.0% NativeChildren 6 to 17 years - Living with two parents Both parents native 136 99.5% Native1 0.5% Foreign-bornBoth parents foreign-born 415 69.8% Native180 30.2% Foreign-bornChildren 6 to 17 years - Living with one parent Native parent 77 46.6% Native89 53.4% Foreign-bornForeign-born parent 146 78.9% Native39 21.1% Foreign-born
Grandparents responsible for own grandchildren in Mount Rainier
Grandparents (30 to 59 years) Black or African American 3 100.0% Not responsible for grandchildren
Grandparents (60 years and over) Black or African American 15 100.0% Not responsible for grandchildren