Races in McKinney, Texas (TX) Detailed Stats
Data:
Races - White alone (%)
Races - White alone (% change since 2000)
Races - Black alone (%)
Races - Black alone (% change since 2000)
Races - American Indian alone (%)
Races - American Indian alone (% change since 2000)
Races - Asian alone (%)
Races - Asian alone (% change since 2000)
Races - Hispanic (%)
Races - Hispanic (% change since 2000)
Races - Native Hawaiian and Other Pacific Islander alone (%)
Races - Native Hawaiian and Other Pacific Islander alone (% change since 2000)
Races - Two or more races(%)
Races - Two or more races(% change since 2000)
Races - Other race alone (%)
Races - Other race alone (% change since 2000)
Racial diversity
Place of birth - Born in state of residence (%)
Place of birth - Born in state of residence (%) - White
Place of birth - Born in state of residence (%) - Black or African American
Place of birth - Born in state of residence (%) - Asian
Place of birth - Born in state of residence (%) - Hispanic or Latino
Place of birth - Born in state of residence (%) - American Indian and Alaska Native
Place of birth - Born in state of residence (%) - Multirace
Place of birth - Born in state of residence (%) - Other Race
Place of birth - Born in other state (%)
Place of birth - Born in other state (%) - White
Place of birth - Born in other state (%) - Black or African American
Place of birth - Born in other state (%) - Asian
Place of birth - Born in other state (%) - Hispanic or Latino
Place of birth - Born in other state (%) - American Indian and Alaska Native
Place of birth - Born in other state (%) - Multirace
Place of birth - Born in other state (%) - Other Race
Place of birth - Native, outside of US (%)
Place of birth - Native, outside of US (%) - White
Place of birth - Native, outside of US (%) - Black or African American
Place of birth - Native, outside of US (%) - Asian
Place of birth - Native, outside of US (%) - Hispanic or Latino
Place of birth - Native, outside of US (%) - American Indian and Alaska Native
Place of birth - Native, outside of US (%) - Multirace
Place of birth - Native, outside of US (%) - Other Race
Place of birth - Foreign born (%)
Place of birth - Foreign born (%) - White
Place of birth - Foreign born (%) - Black or African American
Place of birth - Foreign born (%) - Asian
Place of birth - Foreign born (%) - Hispanic or Latino
Place of birth - Foreign born (%) - American Indian and Alaska Native
Place of birth - Foreign born (%) - Multirace
Place of birth - Foreign born (%) - Other Race
Residents speaking English at home (%)
Residents speaking English at home - Born in the United States (%)
Residents speaking English at home - Native, born elsewhere (%)
Residents speaking English at home - Foreign born (%)
Residents speaking Spanish at home (%)
Residents speaking Spanish at home - Born in the United States (%)
Residents speaking Spanish at home - Native, born elsewhere (%)
Residents speaking Spanish at home - Foreign born (%)
Residents speaking other language at home (%)
Residents speaking other language at home - Born in the United States (%)
Residents speaking other language at home - Native, born elsewhere (%)
Residents speaking other language at home - Foreign born (%)
Marital status - Never married (%)
Marital status - Now married (%)
Marital status - Separated (%)
Marital status - Widowed (%)
Marital status - Divorced (%)
Ancestries Reported - Arab (%)
Ancestries Reported - Czech (%)
Ancestries Reported - Danish (%)
Ancestries Reported - Dutch (%)
Ancestries Reported - English (%)
Ancestries Reported - French (%)
Ancestries Reported - French Canadian (%)
Ancestries Reported - German (%)
Ancestries Reported - Greek (%)
Ancestries Reported - Hungarian (%)
Ancestries Reported - Irish (%)
Ancestries Reported - Italian (%)
Ancestries Reported - Lithuanian (%)
Ancestries Reported - Norwegian (%)
Ancestries Reported - Polish (%)
Ancestries Reported - Portuguese (%)
Ancestries Reported - Russian (%)
Ancestries Reported - Scotch-Irish (%)
Ancestries Reported - Scottish (%)
Ancestries Reported - Slovak (%)
Ancestries Reported - Subsaharan African (%)
Ancestries Reported - Swedish (%)
Ancestries Reported - Swiss (%)
Ancestries Reported - Ukrainian (%)
Ancestries Reported - United States (%)
Ancestries Reported - Welsh (%)
Ancestries Reported - West Indian (%)
Ancestries Reported - Other (%)
Geographical mobility - Same house 1 year ago (%)
Geographical mobility - Same house 1 year ago (%) - White
Geographical mobility - Same house 1 year ago (%) - Black or African American
Geographical mobility - Same house 1 year ago (%) - Asian
Geographical mobility - Same house 1 year ago (%) - Hispanic or Latino
Geographical mobility - Same house 1 year ago (%) - American Indian and Alaska Native
Geographical mobility - Same house 1 year ago (%) - Multirace
Geographical mobility - Same house 1 year ago (%) - Other Race
Geographical mobility - Moved within same county (%)
Geographical mobility - Moved within same county (%) - White
Geographical mobility - Moved within same county (%) - Black or African American
Geographical mobility - Moved within same county (%) - Asian
Geographical mobility - Moved within same county (%) - Hispanic or Latino
Geographical mobility - Moved within same county (%) - American Indian and Alaska Native
Geographical mobility - Moved within same county (%) - Multirace
Geographical mobility - Moved within same county (%) - Other Race
Geographical mobility - Moved from different county within same state (%)
Geographical mobility - Moved from different county within same state (%) - White
Geographical mobility - Moved from different county within same state (%) - Black or African American
Geographical mobility - Moved from different county within same state (%) - Asian
Geographical mobility - Moved from different county within same state (%) - Hispanic or Latino
Geographical mobility - Moved from different county within same state (%) - American Indian and Alaska Native
Geographical mobility - Moved from different county within same state (%) - Multirace
Geographical mobility - Moved from different county within same state (%) - Other Race
Geographical mobility - Moved from different state (%)
Geographical mobility - Moved from different state (%) - White
Geographical mobility - Moved from different state (%) - Black or African American
Geographical mobility - Moved from different state (%) - Asian
Geographical mobility - Moved from different state (%) - Hispanic or Latino
Geographical mobility - Moved from different state (%) - American Indian and Alaska Native
Geographical mobility - Moved from different state (%) - Multirace
Geographical mobility - Moved from different state (%) - Other Race
Geographical mobility - Moved from abroad (%)
Geographical mobility - Moved from abroad (%) - White
Geographical mobility - Moved from abroad (%) - Black or African American
Geographical mobility - Moved from abroad (%) - Asian
Geographical mobility - Moved from abroad (%) - Hispanic or Latino
Geographical mobility - Moved from abroad (%) - American Indian and Alaska Native
Geographical mobility - Moved from abroad (%) - Multirace
Geographical mobility - Moved from abroad (%) - Other Race
Place of birth for the foreign-born population - Ireland (%)
Place of birth for the foreign-born population - Denmark (%)
Place of birth for the foreign-born population - Norway (%)
Place of birth for the foreign-born population - Sweden (%)
Place of birth for the foreign-born population - United Kingdom (%)
Place of birth for the foreign-born population - England (%)
Place of birth for the foreign-born population - Scotland (%)
Place of birth for the foreign-born population - Other Northern Europe (%)
Place of birth for the foreign-born population - Austria (%)
Place of birth for the foreign-born population - Belgium (%)
Place of birth for the foreign-born population - France (%)
Place of birth for the foreign-born population - Germany (%)
Place of birth for the foreign-born population - Netherlands (%)
Place of birth for the foreign-born population - Switzerland (%)
Place of birth for the foreign-born population - Other Western Europe (%)
Place of birth for the foreign-born population - Greece (%)
Place of birth for the foreign-born population - Italy (%)
Place of birth for the foreign-born population - Portugal (%)
Place of birth for the foreign-born population - Spain (%)
Place of birth for the foreign-born population - Other Southern Europe (%)
Place of birth for the foreign-born population - Albania (%)
Place of birth for the foreign-born population - Belarus (%)
Place of birth for the foreign-born population - Bosnia and Herzegovina (%)
Place of birth for the foreign-born population - Bulgaria (%)
Place of birth for the foreign-born population - Croatia (%)
Place of birth for the foreign-born population - Czechoslovakia (%)
Place of birth for the foreign-born population - Hungary (%)
Place of birth for the foreign-born population - Latvia (%)
Place of birth for the foreign-born population - Lithuania (%)
Place of birth for the foreign-born population - North Macedonia (Macedonia) (%)
Place of birth for the foreign-born population - Moldova (%)
Place of birth for the foreign-born population - Poland (%)
Place of birth for the foreign-born population - Romania (%)
Place of birth for the foreign-born population - Russia (%)
Place of birth for the foreign-born population - Serbia (%)
Place of birth for the foreign-born population - Ukraine (%)
Place of birth for the foreign-born population - Other Eastern Europe (%)
Place of birth for the foreign-born population - China (%)
Place of birth for the foreign-born population - Hong Kong (%)
Place of birth for the foreign-born population - Taiwan (%)
Place of birth for the foreign-born population - Japan (%)
Place of birth for the foreign-born population - Korea (%)
Place of birth for the foreign-born population - Other Eastern Asia (%)
Place of birth for the foreign-born population - Afghanistan (%)
Place of birth for the foreign-born population - Bangladesh (%)
Place of birth for the foreign-born population - India (%)
Place of birth for the foreign-born population - Iran (%)
Place of birth for the foreign-born population - Kazakhstan (%)
Place of birth for the foreign-born population - Nepal (%)
Place of birth for the foreign-born population - Pakistan (%)
Place of birth for the foreign-born population - Sri Lanka (%)
Place of birth for the foreign-born population - Uzbekistan (%)
Place of birth for the foreign-born population - Other South Central Asia (%)
Place of birth for the foreign-born population - Burma (%)
Place of birth for the foreign-born population - Cambodia (%)
Place of birth for the foreign-born population - Indonesia (%)
Place of birth for the foreign-born population - Laos (%)
Place of birth for the foreign-born population - Malaysia (%)
Place of birth for the foreign-born population - Philippines (%)
Place of birth for the foreign-born population - Singapore (%)
Place of birth for the foreign-born population - Thailand (%)
Place of birth for the foreign-born population - Vietnam (%)
Place of birth for the foreign-born population - Other South Eastern Asia (%)
Place of birth for the foreign-born population - Armenia (%)
Place of birth for the foreign-born population - Iraq (%)
Place of birth for the foreign-born population - Israel (%)
Place of birth for the foreign-born population - Jordan (%)
Place of birth for the foreign-born population - Kuwait (%)
Place of birth for the foreign-born population - Lebanon (%)
Place of birth for the foreign-born population - Saudi Arabia (%)
Place of birth for the foreign-born population - Syria (%)
Place of birth for the foreign-born population - Turkey (%)
Place of birth for the foreign-born population - Yemen (%)
Place of birth for the foreign-born population - Other Western Asia (%)
Place of birth for the foreign-born population - Eritrea (%)
Place of birth for the foreign-born population - Ethiopia (%)
Place of birth for the foreign-born population - Kenya (%)
Place of birth for the foreign-born population - Somalia (%)
Place of birth for the foreign-born population - Uganda (%)
Place of birth for the foreign-born population - Zimbabwe (%)
Place of birth for the foreign-born population - Other Eastern Africa (%)
Place of birth for the foreign-born population - Cameroon (%)
Place of birth for the foreign-born population - Congo (%)
Place of birth for the foreign-born population - Democratic Republic of Congo (Zaire) (%)
Place of birth for the foreign-born population - Other Middle Africa (%)
Place of birth for the foreign-born population - Egypt (%)
Place of birth for the foreign-born population - Morocco (%)
Place of birth for the foreign-born population - Sudan (%)
Place of birth for the foreign-born population - Other Northern Africa (%)
Place of birth for the foreign-born population - South Africa (%)
Place of birth for the foreign-born population - Other Southern Africa (%)
Place of birth for the foreign-born population - Cabo Verde (%)
Place of birth for the foreign-born population - Ghana (%)
Place of birth for the foreign-born population - Liberia (%)
Place of birth for the foreign-born population - Nigeria (%)
Place of birth for the foreign-born population - Senegal (%)
Place of birth for the foreign-born population - Sierra Leone (%)
Place of birth for the foreign-born population - Other Western Africa (%)
Place of birth for the foreign-born population - Australia (%)
Place of birth for the foreign-born population - New Zealand (%)
Place of birth for the foreign-born population - Fiji (%)
Place of birth for the foreign-born population - Micronesia (%)
Place of birth for the foreign-born population - Bahamas (%)
Place of birth for the foreign-born population - Barbados (%)
Place of birth for the foreign-born population - Cuba (%)
Place of birth for the foreign-born population - Dominica (%)
Place of birth for the foreign-born population - Dominican Republic (%)
Place of birth for the foreign-born population - Grenada (%)
Place of birth for the foreign-born population - Haiti (%)
Place of birth for the foreign-born population - Jamaica (%)
Place of birth for the foreign-born population - St. Vincent and the Grenadines (%)
Place of birth for the foreign-born population - Trinidad and Tobago (%)
Place of birth for the foreign-born population - West Indies (%)
Place of birth for the foreign-born population - Other Caribbean (%)
Place of birth for the foreign-born population - Belize (%)
Place of birth for the foreign-born population - Costa Rica (%)
Place of birth for the foreign-born population - El Salvador (%)
Place of birth for the foreign-born population - Guatemala (%)
Place of birth for the foreign-born population - Honduras (%)
Place of birth for the foreign-born population - Mexico (%)
Place of birth for the foreign-born population - Nicaragua (%)
Place of birth for the foreign-born population - Panama (%)
Place of birth for the foreign-born population - Other Central America (%)
Place of birth for the foreign-born population - Argentina (%)
Place of birth for the foreign-born population - Bolivia (%)
Place of birth for the foreign-born population - Brazil (%)
Place of birth for the foreign-born population - Chile (%)
Place of birth for the foreign-born population - Colombia (%)
Place of birth for the foreign-born population - Ecuador (%)
Place of birth for the foreign-born population - Guyana (%)
Place of birth for the foreign-born population - Peru (%)
Place of birth for the foreign-born population - Uruguay (%)
Place of birth for the foreign-born population - Venezuela (%)
Place of birth for the foreign-born population - Other South America (%)
Place of birth for the foreign-born population - Canada (%)
Place of birth for the foreign-born population - Other Northern America (%)
Place of birth for the foreign-born population - Other (%)
Latest news about races in McKinney, TX collected exclusively by city-data.com from local newspapers, TV, and radio stations
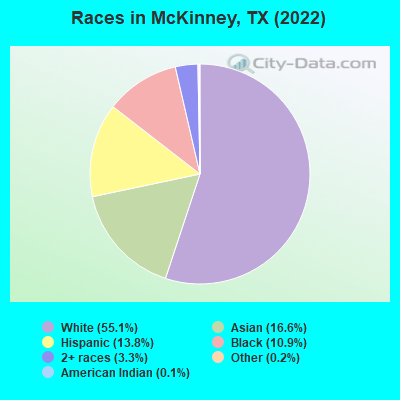
According to 2022 data, the most numerous races in McKinney, TX are Hispanic (28,588 residents), White alone (114,266 residents), and Black alone (22,693 residents). 73.0% of McKinney residents speak English at home. 16.6% of McKinney, TX residents are foreign-born (8.9% born in Asia, 5.4% born in Latin America), which is 2.5% less than the foreign-born rate of 17.0% across the entire state of Texas.
Race distribution in McKinney
2000 2022
10,933,313 52.4% White alone 6,669,666 32.0% Hispanic 2,364,255 11.3% Black alone 554,445 2.7% Asian alone 230,567 1.1% Two or more races 68,859 0.3% American Indian alone 19,958 0.10% Other race alone 10,757 0.05% Native Hawaiian and Other
12,070,642 40.2% Hispanic 11,683,430 38.9% White alone 3,508,706 11.7% Black alone 1,608,173 5.4% Asian alone 956,560 3.2% Two or more races 125,763 0.4% Other race alone 47,023 0.2% American Indian alone 29,275 0.10% Native Hawaiian and Other
Income and house value in McKinney Median household income in 2022 $102,069 White non-Hispanic householders$92,788 Black householders$89,418 American Indian and Alaska Native householders$153,986 Asian householders$89,645 Some other race householders$104,982 Two or more races householders$84,397 Hispanic or Latino race householdersMedian 2022 house value $498,203 White Non-Hispanic householders$243,429 Black or African American householders$374,706 American Indian or Alaska Native householders $573,404 Asian householders$729,315 Native Hawaiian and other Pacific Islander householders$193,835 Some other race householders$500,472 Two or more races householders$285,891 Hispanic or Latino householders
Median age by race in McKinney
39.0 Median age for White residents36.9 40.3 31.8 Median age for Black or African American residents29.5 32.9 52.0 Median age for American Indian / Alaska Native residents52.7 33.2 38.2 Median age for Asian residents38.8 37.8 -666,666,666.0 Median age for Native Hawaiian / Pacific Islander residents-666,666,666.0 -666,666,666.0 34.3 Median age for Other race residents31.5 37.4 32.5 Median age for Two or more races residents35.9 27.9 40.4 Median age for White alone residents39.4 41.5 32.8 Median age for Hispanic or Latino residents33.5 32.6
Owner/renter occupied households by race in McKinney
House owners and renters - White residents 31,089 62.7% Owner occupied18,527 37.3% Renter occupiedHouse owners and renters - Black or African American residents 2,581 36.7% Owner occupied4,443 63.3% Renter occupiedHouse owners and renters - American Indian / Alaska Native residents 131 32.3% Owner occupied274 67.7% Renter occupiedHouse owners and renters - Asian residents 7,349 66.2% Owner occupied3,752 33.8% Renter occupiedHouse owners and renters - Native Hawaiian / Pacific Islander residents 14 100.0% Owner occupiedHouse owners and renters - Other race residents 1,010 70.4% Owner occupied425 29.6% Renter occupiedHouse owners and renters - Two or more races residents 4,426 77.4% Owner occupied1,291 22.6% Renter occupiedHouse owners and renters - White alone residents 29,871 65.2% Owner occupied15,945 34.8% Renter occupiedHouse owners and renters - Hispanic or Latino residents 5,452 57.3% Owner occupied4,056 42.7% Renter occupied
Language usage in McKinney
English speakers - Total 73.0% of residents of McKinney speak English at home.
10.9% of residents speak Spanish at home 15,227 71.4% Speak English very well6,104 28.6% Speak English less than very well16.2% of residents speak other language at home 24,255 76.6% Speak English very well7,390 23.4% Speak English less than very well
English speakers - Born in the United States 90.6% of residents of McKinney speak English at home.
5.3% of residents speak Spanish at home 3,546 84.9% Speak English very well632 15.1% Speak English less than very well4.0% of residents speak other language at home 2,583 81.7% Speak English very well578 18.3% Speak English less than very well
English speakers - Native, born elsewhere 63.0% of residents of McKinney speak English at home.
33.3% of residents speak Spanish at home 520 73.6% Speak English very well187 26.4% Speak English less than very well3.7% of residents speak other language at home 79 100.0% Speak English very well
English speakers - Foreign-born 16.2% of residents of McKinney speak English at home.
19.5% of residents speak Spanish at home 3,765 47.5% Speak English very well4,160 52.5% Speak English less than very well64.4% of residents speak other language at home 19,703 75.1% Speak English very well6,519 24.9% Speak English less than very well
White (Caucasian) - Speak only English Native:
92.0% (103,111)Foreign-born:
22.0% (1,680)
White (Caucasian) - Speak another language Native:
8.0% (8,976)Foreign-born:
78.0% (5,941)
Black or African American - Speak only English Native:
97.6% (21,664)Foreign-born:
30.2% (720)
Black or African American - Speak another language Native:
2.5% (550)Foreign-born:
69.8% (1,662)
American Indian / Alaska Native - Speak only English Native:
70.6% (460)Foreign-born:
28.8% (76)
American Indian / Alaska Native - Speak another language Native:
28.5% (185)Foreign-born:
72.8% (192)
Asian - Speak only English Native:
55.5% (4,443)Foreign-born:
13.6% (3,314)
Asian - Speak another language Native:
44.5% (3,560)Foreign-born:
86.4% (21,028)
Other race - Speak only English Native:
44.1% (1,436)Foreign-born:
3.8% (80)
Other race - Speak another language Native:
55.9% (1,819)Foreign-born:
96.2% (2,020)
Two or more races - Speak only English Native:
68.2% (8,685)Foreign-born:
12.5% (497)
Two or more races - Speak another language Native:
31.8% (4,053)Foreign-born:
87.5% (3,475)
White alone - Speak only English Native:
96.9% (101,204)Foreign-born:
32.7% (1,680)
White alone - Speak another language Native:
3.1% (3,242)Foreign-born:
67.3% (3,454)
Hispanic or Latino - Speak only English Native:
38.3% (7,146)Foreign-born:
2.3% (190)
Hispanic or Latino - Speak another language Native:
61.7% (11,506)Foreign-born:
97.7% (7,925)
Foreign-born residents in McKinney 34,915 residents are foreign born (8.9% Asia , 5.4% Latin America ).
This city:
16.6%Texas:
17.1%
Marital status for residents in McKinney Marital status - White (Caucasian) population 15 years and over
Males 31.0% Never married55.5% Now married0.8% Separated1.2% Widowed11.5% DivorcedFemales 27.0% Never married53.5% Now married1.1% Separated7.1% Widowed11.3% DivorcedWomen who gave birth in the past 12 months Now married:
92.7% (1,460)Unmarried:
7.3% (115)
Women who did not give birth in the past 12 months Now married:
47.3% (13,823)Unmarried:
52.7% (15,416)
Marital status - Black or African American population 15 years and over
Males 36.9% Never married45.4% Now married4.3% Separated3.3% Widowed10.1% DivorcedFemales 43.0% Never married29.3% Now married4.9% Separated5.0% Widowed17.9% DivorcedWomen who gave birth in the past 12 months Now married:
67.0% (226)Unmarried:
33.0% (111)
Women who did not give birth in the past 12 months Now married:
34.7% (2,755)Unmarried:
65.3% (5,176)
Marital status - American Indian / Alaska Native population 15 years and over
Males 56.9% Never married39.6% Now married0.0% Separated0.0% Widowed3.5% DivorcedFemales 28.6% Never married62.4% Now married1.4% Separated0.0% Widowed7.7% DivorcedWomen who gave birth in the past 12 months Now married:
0.0% (0)Unmarried:
100.0% (16)
Women who did not give birth in the past 12 months Now married:
58.6% (234)Unmarried:
41.4% (165)
Marital status - Asian population 15 years and over
Males 20.4% Never married77.0% Now married0.0% Separated1.0% Widowed1.6% DivorcedFemales 16.9% Never married71.9% Now married2.3% Separated3.1% Widowed5.8% DivorcedWomen who gave birth in the past 12 months Now married:
100.0% (319)Unmarried:
0.0% (0)
Women who did not give birth in the past 12 months Now married:
72.4% (7,272)Unmarried:
27.6% (2,772)
Marital status - Other race population 15 years and over
Males 27.2% Never married64.3% Now married0.0% Separated0.9% Widowed7.6% DivorcedFemales 19.2% Never married61.2% Now married3.1% Separated2.3% Widowed14.2% DivorcedWomen who gave birth in the past 12 months Now married:
66.1% (42)Unmarried:
33.9% (22)
Women who did not give birth in the past 12 months Now married:
65.4% (717)Unmarried:
34.6% (379)
Marital status - Two or more races population 15 years and over
Males 40.4% Never married50.6% Now married0.8% Separated0.0% Widowed8.3% DivorcedFemales 33.8% Never married52.0% Now married0.0% Separated6.1% Widowed8.1% DivorcedWomen who gave birth in the past 12 months Now married:
100.0% (160)Unmarried:
0.0% (0)
Women who did not give birth in the past 12 months Now married:
46.2% (1,951)Unmarried:
53.8% (2,272)
Marital status - White alone, not Hispanic / Latino population 15 years and over
Males 29.8% Never married55.9% Now married0.8% Separated1.2% Widowed12.3% DivorcedFemales 25.9% Never married54.2% Now married1.2% Separated7.1% Widowed11.6% DivorcedWomen who gave birth in the past 12 months Now married:
100.0% (1,460)Unmarried:
0.0% (0)
Women who did not give birth in the past 12 months Now married:
47.5% (12,539)Unmarried:
52.5% (13,865)
Marital status - Hispanic or Latino population 15 years and over
Males 42.8% Never married51.1% Now married0.4% Separated0.1% Widowed5.5% DivorcedFemales 33.1% Never married49.5% Now married0.7% Separated4.9% Widowed11.8% DivorcedWomen who gave birth in the past 12 months Now married:
29.0% (85)Unmarried:
71.0% (208)
Women who did not give birth in the past 12 months Now married:
48.1% (3,426)Unmarried:
51.9% (3,690)
Ancestries in McKinney
20,081 16.8% American10,098 8.4% English5,714 4.8% German3,125 2.6% Irish2,884 2.4% European1,550 1.3% Italian1,270 1.1% Nigerian793 0.7% Scottish775 0.6% Norwegian748 0.6% Scotch-Irish686 0.6% African673 0.6% Iranian647 0.5% Canadian614 0.5% Russian582 0.5% French548 0.5% Ghanaian388 0.3% Polish335 0.3% Dutch316 0.3% Hungarian306 0.3% Portuguese291 0.2% British277 0.2% South African276 0.2% Ukrainian261 0.2% Palestinian248 0.2% Welsh244 0.2% Kenyan233 0.2% French Canadian230 0.2% Swedish226 0.2% Jordanian222 0.2% Romanian220 0.2% Egyptian192 0.2% Czech189 0.2% Greek159 0.1% Danish151 0.1% Serbian151 0.1% Scandinavian131 0.1% Slovak111 0.09% Eastern European107 0.09% Brazilian103 0.09% Cajun101 0.08% Haitian95 0.08% Lebanese73 0.06% Arab69 0.06% Finnish68 0.06% Israeli66 0.06% Jamaican57 0.05% Afghan56 0.05% Guyanese56 0.05% Croatian56 0.05% Yugoslavian55 0.05% Pennsylvania German55 0.05% Barbadian54 0.05% Northern European49 0.04% Austrian48 0.04% Belgian40 0.03% Iraqi40 0.03% Syrian38 0.03% Moroccan38 0.03% Zimbabwean35 0.03% Basque33 0.03% Lithuanian30 0.03% West Indian24 0.02% Latvian22 0.02% Ethiopian17 0.01% Czechoslovakian15 0.01% Swiss8 0.01% Bulgarian8 0.01% Turkish
Geographical mobility in McKinney Same house 1 year ago 107,627 87.5% White (Caucasian)19,212 83.2% Black or African American1,209 77.3% American Indian / Alaska Native24,374 71.2% Asian149 89.2% Native Hawaiian / Pacific Islander3,642 84.9% Other race14,100 79.1% Two or more races97,815 86.8% White alone, not Hispanic / Latino23,936 87.0% Hispanic or LatinoMoved within same county 8,559 7.0% White / Caucasian786 3.4% Black or African American121 7.8% American Indian / Alaska Native5,035 14.7% Asian7 4.1% Native Hawaiian / Pacific Islander229 5.3% Other race620 3.5% Two or more races8,242 7.3% White alone, not Hispanic / Latino1,103 4.0% Hispanic or LatinoMoved within same state 4,227 3.4% White / Caucasian973 4.2% Black or African American116 7.4% American Indian / Alaska Native778 2.3% Asian303 7.1% Other race921 5.2% Two or more races4,016 3.6% White alone, not Hispanic / Latino754 2.7% Hispanic or LatinoMoved from different state 1,911 1.6% White / Caucasian1,581 6.8% Black or African American112 7.2% American Indian / Alaska Native3,108 9.1% Asian124 2.9% Other race1,489 8.3% Two or more races1,911 1.7% White alone, not Hispanic / Latino1,230 4.5% Hispanic or LatinoMoved from abroad 717 0.6% White531 2.3% Black or African American953 2.8% Asian706 4.0% Two or more races717 0.6% White alone, not Hispanic / Latino475 1.7% Hispanic or Latino
Children Nativity (place of birth) in McKinney
Children under 6 years - Living with two parents Both parents native 6,587 100.0% NativeBoth parents foreign-born 3,608 95.5% Native170 4.5% Foreign-bornOne native, one foreign-born parent 877 100.0% NativeChildren under 6 years - Living with one parent Native parent 2,456 100.0% NativeForeign-born parent 915 82.6% Native193 17.4% Foreign-bornChildren 6 to 17 years - Living with two parents Both parents native 18,982 100.0% NativeBoth parents foreign-born 5,361 60.0% Native3,581 40.0% Foreign-bornOne native, one foreign-born parent 1,415 100.0% NativeChildren 6 to 17 years - Living with one parent Native parent 6,855 100.0% NativeForeign-born parent 1,074 53.7% Native926 46.3% Foreign-born
Place of birth for residents in McKinney 18,032 Asia12,019 Americas10,922 Latin America10,280 South Central Asia8,618 Central America4,196 Eastern Asia2,729 South Eastern Asia2,726 Africa2,327 China2,075 Europe1,705 South America1,101 Western Africa1,097 Northern America1,059 Eastern Europe713 Western Asia658 Eastern Africa597 Caribbean531 Middle Africa517 Northern Europe282 Western Europe239 Southern Africa216 Southern Europe155 Northern Africa61 Oceania61 Australia and New Zealand Subregion7,555 India7,430 Mexico1,846 China1,410 Korea1,237 Philippines1,071 Canada974 Vietnam774 Pakistan761 Nigeria724 Bangladesh664 Iran593 Venezuela556 El Salvador458 Japan408 Cameroon376 Nepal376 Colombia362 Romania345 Kenya335 Honduras317 Taiwan294 Brazil261 Cuba258 Ghana221 Ethiopia190 United Kingdom190 Russia180 England175 Indonesia169 Guyana166 Germany165 Israel163 Hong Kong159 Ukraine156 Jordan147 Guatemala135 Nicaragua116 Italy112 South Africa112 Singapore111 Bolivia103 Peru99 Serbia90 Egypt90 Malaysia88 Jamaica87 United Arab Emirates76 Haiti73 Congo69 France67 Sri Lanka63 Dominica61 Uzbekistan56 Barbados55 Morocco53 Cambodia52 Australia50 Portugal48 Thailand47 Lebanon46 Argentina44 Saudi Arabia42 Poland37 Laos35 Ivory Coast35 Netherlands34 Dominican Republic32 Zimbabwe30 Turkey29 Greece27 Afghanistan26 Lithuania25 Georgia25 Hungary20 Spain20 Liberia18 Scotland17 Trinidad and Tobago16 Iraq15 Bulgaria14 Ireland13 Syria12 Panama11 Belarus11 Belgium10 North Macedonia (Macedonia)10 Azerbaijan10 Kuwait9 Ecuador8 Sweden8 New Zealand
Grandparents responsible for own grandchildren in McKinney
Grandparents (30 to 59 years) White / Caucasian 101 18.4% Responsible for grandchildren446 81.6% Not responsible for grandchildrenBlack or African American 127 54.4% Responsible for grandchildren106 45.6% Not responsible for grandchildrenAsian 75 43.3% Responsible for grandchildren99 56.7% Not responsible for grandchildrenNative Hawaiian / Pacific Islander 8 100.0% Not responsible for grandchildrenOther race 14 32.1% Responsible for grandchildren30 67.9% Not responsible for grandchildrenTwo or more races 14 13.5% Responsible for grandchildren90 86.5% Not responsible for grandchildrenWhite alone, not Hispanic / Latino 98 26.5% Responsible for grandchildren272 73.5% Not responsible for grandchildrenHispanic or Latino 9 5.1% Responsible for grandchildren160 94.9% Not responsible for grandchildrenGrandparents (60 years and over) White / Caucasian 245 25.9% Responsible for grandchildren701 74.1% Not responsible for grandchildrenBlack or African American 29 4.5% Responsible for grandchildren615 95.5% Not responsible for grandchildrenAsian 29 6.6% Responsible for grandchildren403 93.4% Not responsible for grandchildrenOther race 42 45.2% Responsible for grandchildren51 54.8% Not responsible for grandchildrenTwo or more races 13 11.4% Responsible for grandchildren100 88.6% Not responsible for grandchildrenWhite alone, not Hispanic / Latino 190 26.6% Responsible for grandchildren523 73.4% Not responsible for grandchildrenHispanic or Latino 119 23.1% Responsible for grandchildren396 76.9% Not responsible for grandchildren