Races in Makaha, Hawaii (HI) Detailed Stats
Data:
Races - White alone (%)
Races - White alone (% change since 2000)
Races - Black alone (%)
Races - Black alone (% change since 2000)
Races - American Indian alone (%)
Races - American Indian alone (% change since 2000)
Races - Asian alone (%)
Races - Asian alone (% change since 2000)
Races - Hispanic (%)
Races - Hispanic (% change since 2000)
Races - Native Hawaiian and Other Pacific Islander alone (%)
Races - Native Hawaiian and Other Pacific Islander alone (% change since 2000)
Races - Two or more races(%)
Races - Two or more races(% change since 2000)
Races - Other race alone (%)
Races - Other race alone (% change since 2000)
Racial diversity
Place of birth - Born in state of residence (%)
Place of birth - Born in state of residence (%) - White
Place of birth - Born in state of residence (%) - Black or African American
Place of birth - Born in state of residence (%) - Asian
Place of birth - Born in state of residence (%) - Hispanic or Latino
Place of birth - Born in state of residence (%) - American Indian and Alaska Native
Place of birth - Born in state of residence (%) - Multirace
Place of birth - Born in state of residence (%) - Other Race
Place of birth - Born in other state (%)
Place of birth - Born in other state (%) - White
Place of birth - Born in other state (%) - Black or African American
Place of birth - Born in other state (%) - Asian
Place of birth - Born in other state (%) - Hispanic or Latino
Place of birth - Born in other state (%) - American Indian and Alaska Native
Place of birth - Born in other state (%) - Multirace
Place of birth - Born in other state (%) - Other Race
Place of birth - Native, outside of US (%)
Place of birth - Native, outside of US (%) - White
Place of birth - Native, outside of US (%) - Black or African American
Place of birth - Native, outside of US (%) - Asian
Place of birth - Native, outside of US (%) - Hispanic or Latino
Place of birth - Native, outside of US (%) - American Indian and Alaska Native
Place of birth - Native, outside of US (%) - Multirace
Place of birth - Native, outside of US (%) - Other Race
Place of birth - Foreign born (%)
Place of birth - Foreign born (%) - White
Place of birth - Foreign born (%) - Black or African American
Place of birth - Foreign born (%) - Asian
Place of birth - Foreign born (%) - Hispanic or Latino
Place of birth - Foreign born (%) - American Indian and Alaska Native
Place of birth - Foreign born (%) - Multirace
Place of birth - Foreign born (%) - Other Race
Residents speaking English at home (%)
Residents speaking English at home - Born in the United States (%)
Residents speaking English at home - Native, born elsewhere (%)
Residents speaking English at home - Foreign born (%)
Residents speaking Spanish at home (%)
Residents speaking Spanish at home - Born in the United States (%)
Residents speaking Spanish at home - Native, born elsewhere (%)
Residents speaking Spanish at home - Foreign born (%)
Residents speaking other language at home (%)
Residents speaking other language at home - Born in the United States (%)
Residents speaking other language at home - Native, born elsewhere (%)
Residents speaking other language at home - Foreign born (%)
Marital status - Never married (%)
Marital status - Now married (%)
Marital status - Separated (%)
Marital status - Widowed (%)
Marital status - Divorced (%)
Ancestries Reported - Arab (%)
Ancestries Reported - Czech (%)
Ancestries Reported - Danish (%)
Ancestries Reported - Dutch (%)
Ancestries Reported - English (%)
Ancestries Reported - French (%)
Ancestries Reported - French Canadian (%)
Ancestries Reported - German (%)
Ancestries Reported - Greek (%)
Ancestries Reported - Hungarian (%)
Ancestries Reported - Irish (%)
Ancestries Reported - Italian (%)
Ancestries Reported - Lithuanian (%)
Ancestries Reported - Norwegian (%)
Ancestries Reported - Polish (%)
Ancestries Reported - Portuguese (%)
Ancestries Reported - Russian (%)
Ancestries Reported - Scotch-Irish (%)
Ancestries Reported - Scottish (%)
Ancestries Reported - Slovak (%)
Ancestries Reported - Subsaharan African (%)
Ancestries Reported - Swedish (%)
Ancestries Reported - Swiss (%)
Ancestries Reported - Ukrainian (%)
Ancestries Reported - United States (%)
Ancestries Reported - Welsh (%)
Ancestries Reported - West Indian (%)
Ancestries Reported - Other (%)
Geographical mobility - Same house 1 year ago (%)
Geographical mobility - Same house 1 year ago (%) - White
Geographical mobility - Same house 1 year ago (%) - Black or African American
Geographical mobility - Same house 1 year ago (%) - Asian
Geographical mobility - Same house 1 year ago (%) - Hispanic or Latino
Geographical mobility - Same house 1 year ago (%) - American Indian and Alaska Native
Geographical mobility - Same house 1 year ago (%) - Multirace
Geographical mobility - Same house 1 year ago (%) - Other Race
Geographical mobility - Moved within same county (%)
Geographical mobility - Moved within same county (%) - White
Geographical mobility - Moved within same county (%) - Black or African American
Geographical mobility - Moved within same county (%) - Asian
Geographical mobility - Moved within same county (%) - Hispanic or Latino
Geographical mobility - Moved within same county (%) - American Indian and Alaska Native
Geographical mobility - Moved within same county (%) - Multirace
Geographical mobility - Moved within same county (%) - Other Race
Geographical mobility - Moved from different county within same state (%)
Geographical mobility - Moved from different county within same state (%) - White
Geographical mobility - Moved from different county within same state (%) - Black or African American
Geographical mobility - Moved from different county within same state (%) - Asian
Geographical mobility - Moved from different county within same state (%) - Hispanic or Latino
Geographical mobility - Moved from different county within same state (%) - American Indian and Alaska Native
Geographical mobility - Moved from different county within same state (%) - Multirace
Geographical mobility - Moved from different county within same state (%) - Other Race
Geographical mobility - Moved from different state (%)
Geographical mobility - Moved from different state (%) - White
Geographical mobility - Moved from different state (%) - Black or African American
Geographical mobility - Moved from different state (%) - Asian
Geographical mobility - Moved from different state (%) - Hispanic or Latino
Geographical mobility - Moved from different state (%) - American Indian and Alaska Native
Geographical mobility - Moved from different state (%) - Multirace
Geographical mobility - Moved from different state (%) - Other Race
Geographical mobility - Moved from abroad (%)
Geographical mobility - Moved from abroad (%) - White
Geographical mobility - Moved from abroad (%) - Black or African American
Geographical mobility - Moved from abroad (%) - Asian
Geographical mobility - Moved from abroad (%) - Hispanic or Latino
Geographical mobility - Moved from abroad (%) - American Indian and Alaska Native
Geographical mobility - Moved from abroad (%) - Multirace
Geographical mobility - Moved from abroad (%) - Other Race
Place of birth for the foreign-born population - Ireland (%)
Place of birth for the foreign-born population - Denmark (%)
Place of birth for the foreign-born population - Norway (%)
Place of birth for the foreign-born population - Sweden (%)
Place of birth for the foreign-born population - United Kingdom (%)
Place of birth for the foreign-born population - England (%)
Place of birth for the foreign-born population - Scotland (%)
Place of birth for the foreign-born population - Other Northern Europe (%)
Place of birth for the foreign-born population - Austria (%)
Place of birth for the foreign-born population - Belgium (%)
Place of birth for the foreign-born population - France (%)
Place of birth for the foreign-born population - Germany (%)
Place of birth for the foreign-born population - Netherlands (%)
Place of birth for the foreign-born population - Switzerland (%)
Place of birth for the foreign-born population - Other Western Europe (%)
Place of birth for the foreign-born population - Greece (%)
Place of birth for the foreign-born population - Italy (%)
Place of birth for the foreign-born population - Portugal (%)
Place of birth for the foreign-born population - Spain (%)
Place of birth for the foreign-born population - Other Southern Europe (%)
Place of birth for the foreign-born population - Albania (%)
Place of birth for the foreign-born population - Belarus (%)
Place of birth for the foreign-born population - Bosnia and Herzegovina (%)
Place of birth for the foreign-born population - Bulgaria (%)
Place of birth for the foreign-born population - Croatia (%)
Place of birth for the foreign-born population - Czechoslovakia (%)
Place of birth for the foreign-born population - Hungary (%)
Place of birth for the foreign-born population - Latvia (%)
Place of birth for the foreign-born population - Lithuania (%)
Place of birth for the foreign-born population - North Macedonia (Macedonia) (%)
Place of birth for the foreign-born population - Moldova (%)
Place of birth for the foreign-born population - Poland (%)
Place of birth for the foreign-born population - Romania (%)
Place of birth for the foreign-born population - Russia (%)
Place of birth for the foreign-born population - Serbia (%)
Place of birth for the foreign-born population - Ukraine (%)
Place of birth for the foreign-born population - Other Eastern Europe (%)
Place of birth for the foreign-born population - China (%)
Place of birth for the foreign-born population - Hong Kong (%)
Place of birth for the foreign-born population - Taiwan (%)
Place of birth for the foreign-born population - Japan (%)
Place of birth for the foreign-born population - Korea (%)
Place of birth for the foreign-born population - Other Eastern Asia (%)
Place of birth for the foreign-born population - Afghanistan (%)
Place of birth for the foreign-born population - Bangladesh (%)
Place of birth for the foreign-born population - India (%)
Place of birth for the foreign-born population - Iran (%)
Place of birth for the foreign-born population - Kazakhstan (%)
Place of birth for the foreign-born population - Nepal (%)
Place of birth for the foreign-born population - Pakistan (%)
Place of birth for the foreign-born population - Sri Lanka (%)
Place of birth for the foreign-born population - Uzbekistan (%)
Place of birth for the foreign-born population - Other South Central Asia (%)
Place of birth for the foreign-born population - Burma (%)
Place of birth for the foreign-born population - Cambodia (%)
Place of birth for the foreign-born population - Indonesia (%)
Place of birth for the foreign-born population - Laos (%)
Place of birth for the foreign-born population - Malaysia (%)
Place of birth for the foreign-born population - Philippines (%)
Place of birth for the foreign-born population - Singapore (%)
Place of birth for the foreign-born population - Thailand (%)
Place of birth for the foreign-born population - Vietnam (%)
Place of birth for the foreign-born population - Other South Eastern Asia (%)
Place of birth for the foreign-born population - Armenia (%)
Place of birth for the foreign-born population - Iraq (%)
Place of birth for the foreign-born population - Israel (%)
Place of birth for the foreign-born population - Jordan (%)
Place of birth for the foreign-born population - Kuwait (%)
Place of birth for the foreign-born population - Lebanon (%)
Place of birth for the foreign-born population - Saudi Arabia (%)
Place of birth for the foreign-born population - Syria (%)
Place of birth for the foreign-born population - Turkey (%)
Place of birth for the foreign-born population - Yemen (%)
Place of birth for the foreign-born population - Other Western Asia (%)
Place of birth for the foreign-born population - Eritrea (%)
Place of birth for the foreign-born population - Ethiopia (%)
Place of birth for the foreign-born population - Kenya (%)
Place of birth for the foreign-born population - Somalia (%)
Place of birth for the foreign-born population - Uganda (%)
Place of birth for the foreign-born population - Zimbabwe (%)
Place of birth for the foreign-born population - Other Eastern Africa (%)
Place of birth for the foreign-born population - Cameroon (%)
Place of birth for the foreign-born population - Congo (%)
Place of birth for the foreign-born population - Democratic Republic of Congo (Zaire) (%)
Place of birth for the foreign-born population - Other Middle Africa (%)
Place of birth for the foreign-born population - Egypt (%)
Place of birth for the foreign-born population - Morocco (%)
Place of birth for the foreign-born population - Sudan (%)
Place of birth for the foreign-born population - Other Northern Africa (%)
Place of birth for the foreign-born population - South Africa (%)
Place of birth for the foreign-born population - Other Southern Africa (%)
Place of birth for the foreign-born population - Cabo Verde (%)
Place of birth for the foreign-born population - Ghana (%)
Place of birth for the foreign-born population - Liberia (%)
Place of birth for the foreign-born population - Nigeria (%)
Place of birth for the foreign-born population - Senegal (%)
Place of birth for the foreign-born population - Sierra Leone (%)
Place of birth for the foreign-born population - Other Western Africa (%)
Place of birth for the foreign-born population - Australia (%)
Place of birth for the foreign-born population - New Zealand (%)
Place of birth for the foreign-born population - Fiji (%)
Place of birth for the foreign-born population - Micronesia (%)
Place of birth for the foreign-born population - Bahamas (%)
Place of birth for the foreign-born population - Barbados (%)
Place of birth for the foreign-born population - Cuba (%)
Place of birth for the foreign-born population - Dominica (%)
Place of birth for the foreign-born population - Dominican Republic (%)
Place of birth for the foreign-born population - Grenada (%)
Place of birth for the foreign-born population - Haiti (%)
Place of birth for the foreign-born population - Jamaica (%)
Place of birth for the foreign-born population - St. Vincent and the Grenadines (%)
Place of birth for the foreign-born population - Trinidad and Tobago (%)
Place of birth for the foreign-born population - West Indies (%)
Place of birth for the foreign-born population - Other Caribbean (%)
Place of birth for the foreign-born population - Belize (%)
Place of birth for the foreign-born population - Costa Rica (%)
Place of birth for the foreign-born population - El Salvador (%)
Place of birth for the foreign-born population - Guatemala (%)
Place of birth for the foreign-born population - Honduras (%)
Place of birth for the foreign-born population - Mexico (%)
Place of birth for the foreign-born population - Nicaragua (%)
Place of birth for the foreign-born population - Panama (%)
Place of birth for the foreign-born population - Other Central America (%)
Place of birth for the foreign-born population - Argentina (%)
Place of birth for the foreign-born population - Bolivia (%)
Place of birth for the foreign-born population - Brazil (%)
Place of birth for the foreign-born population - Chile (%)
Place of birth for the foreign-born population - Colombia (%)
Place of birth for the foreign-born population - Ecuador (%)
Place of birth for the foreign-born population - Guyana (%)
Place of birth for the foreign-born population - Peru (%)
Place of birth for the foreign-born population - Uruguay (%)
Place of birth for the foreign-born population - Venezuela (%)
Place of birth for the foreign-born population - Other South America (%)
Place of birth for the foreign-born population - Canada (%)
Place of birth for the foreign-born population - Other Northern America (%)
Place of birth for the foreign-born population - Other (%)
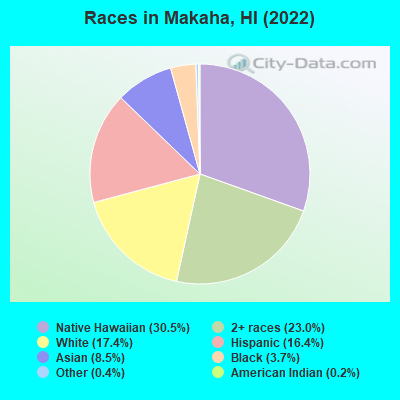
According to 2022 data, the most numerous races in Makaha, HI are Asian alone (839 residents), Two or more races (2,273 residents), and White alone (1,724 residents). 77.9% of Makaha residents speak English at home. 14.4% of Makaha, HI residents are foreign-born (7.8% born in Oceania, 4.2% born in Asia), which is 25.3% less than the foreign-born rate of 18.0% across the entire state of Hawaii.
Race distribution in Makaha
2000 2022
494,149 40.8% Asian alone 277,091 22.9% White alone 218,700 18.1% Two or more races 108,441 9.0% Native Hawaiian and Other 87,699 7.2% Hispanic 20,829 1.7% Black alone 2,089 0.2% Other race alone 2,539 0.2% American Indian alone
498,125 34.6% Asian alone 318,574 22.1% Two or more races 297,937 20.7% White alone 160,103 11.1% Hispanic 134,567 9.3% Native Hawaiian and Other 23,682 1.6% Black alone 5,378 0.4% Other race alone 1,830 0.1% American Indian alone
Income and house value in Makaha Median household income in 2022 $82,820 White non-Hispanic householders$35,187 Native Hawaiian and other Pacific Islander householders$56,599 Two or more races householders$42,487 Hispanic or Latino race householdersMedian 2022 house value $394,235 White Non-Hispanic householders $494,484 Asian householders$416,200 Native Hawaiian and other Pacific Islander householders$523,770 Two or more races householders$468,014 Hispanic or Latino householders
Median age by race in Makaha
48.6 Median age for White residents47.9 51.2 37.1 Median age for Black or African American residents26.7 59.9 70.0 Median age for American Indian / Alaska Native residents-715,953,306.7 -629,508,196.1 61.5 Median age for Asian residents60.7 61.9 25.2 Median age for Native Hawaiian / Pacific Islander residents21.8 35.8 32.1 Median age for Other race residents38.0 27.9 30.7 Median age for Two or more races residents33.2 29.9 51.8 Median age for White alone residents53.9 51.0 17.1 Median age for Hispanic or Latino residents12.0 24.6
Owner/renter occupied households by race in Makaha
House owners and renters - White residents 519 52.1% Owner occupied476 47.9% Renter occupiedHouse owners and renters - Black or African American residents 116 41.5% Owner occupied163 58.5% Renter occupiedHouse owners and renters - American Indian / Alaska Native residents 18 100.0% Renter occupiedHouse owners and renters - Asian residents 153 43.9% Owner occupied195 56.1% Renter occupiedHouse owners and renters - Native Hawaiian / Pacific Islander residents 135 15.9% Owner occupied716 84.1% Renter occupiedHouse owners and renters - Other race residents 45 70.0% Owner occupied19 30.0% Renter occupiedHouse owners and renters - Two or more races residents 410 51.5% Owner occupied385 48.5% Renter occupiedHouse owners and renters - White alone residents 499 53.5% Owner occupied433 46.5% Renter occupiedHouse owners and renters - Hispanic or Latino residents 111 32.8% Owner occupied228 67.2% Renter occupied
Language usage in Makaha
English speakers - Total 77.9% of residents of Makaha speak English at home.
1.5% of residents speak Spanish at home 102 77.9% Speak English very well29 22.1% Speak English less than very well20.8% of residents speak other language at home 982 52.7% Speak English very well883 47.3% Speak English less than very well
English speakers - Born in the United States 94.4% of residents of Makaha speak English at home.
3.8% of residents speak Spanish at home 59 73.8% Speak English very well21 26.2% Speak English less than very well2.3% of residents speak other language at home 47 97.9% Speak English very well1 2.1% Speak English less than very well
English speakers - Native, born elsewhere 95.2% of residents of Makaha speak English at home.
9.1% of residents speak other language at home 17 100.0% Speak English very well
English speakers - Foreign-born 13.8% of residents of Makaha speak English at home.
1.9% of residents speak Spanish at home 17 65.4% Speak English very well9 34.6% Speak English less than very well84.1% of residents speak other language at home 356 31.6% Speak English very well769 68.4% Speak English less than very well
White (Caucasian) - Speak only English Native:
94.1% (1,511)Foreign-born:
50.5% (90)
White (Caucasian) - Speak another language Native:
5.8% (92)Foreign-born:
49.0% (87)
Black or African American - Speak only English Native:
97.0% (371)Foreign-born:
32.3% (1)
Black or African American - Speak another language Native:
3.4% (13)Foreign-born:
100.0% (4)
Asian - Speak only English Native:
99.4% (493)Foreign-born:
24.9% (89)
Asian - Speak another language Native:
1.5% (7)Foreign-born:
75.0% (269)
Native Hawaiian / Pacific Islander - Speak only English Native:
81.1% (2,060)Foreign-born:
1.5% (11)
Native Hawaiian / Pacific Islander - Speak another language Native:
18.8% (478)Foreign-born:
99.0% (701)
Other race - Speak another language Native:
14.0% (20)Foreign-born:
98.0% (18)
Two or more races - Speak another language Native:
8.1% (193)Foreign-born:
99.2% (117)
White alone - Speak only English Native:
95.9% (1,387)Foreign-born:
54.9% (91)
White alone - Speak another language Native:
4.2% (60)Foreign-born:
45.0% (75)
Hispanic or Latino - Speak another language Native:
15.3% (179)Foreign-born:
95.6% (78)
Foreign-born residents in Makaha 1,422 residents are foreign born (7.8% Oceania , 4.2% Asia ).
This city:
14.4%Hawaii:
18.0%
Marital status for residents in Makaha Marital status - White (Caucasian) population 15 years and over
Males 33.1% Never married43.8% Now married10.5% Separated3.7% Widowed8.9% DivorcedFemales 22.6% Never married36.0% Now married2.9% Separated16.9% Widowed21.6% DivorcedWomen who gave birth in the past 12 months Now married:
62.5% (9)Unmarried:
37.5% (6)
Women who did not give birth in the past 12 months Now married:
43.9% (140)Unmarried:
56.1% (180)
Marital status - Black or African American population 15 years and over
Males 51.4% Never married15.2% Now married0.0% Separated0.0% Widowed33.3% DivorcedFemales 36.8% Never married45.3% Now married0.0% Separated0.0% Widowed17.9% DivorcedWomen who did not give birth in the past 12 months Now married:
20.0% (9)Unmarried:
80.0% (34)
Marital status - American Indian / Alaska Native population 15 years and over
Males 0.0% Never married0.0% Now married0.0% Separated0.0% Widowed100.0% DivorcedFemales 60.9% Never married0.0% Now married0.0% Separated39.1% Widowed0.0% DivorcedMarital status - Asian population 15 years and over
Males 47.9% Never married44.8% Now married1.2% Separated0.0% Widowed6.1% DivorcedFemales 40.1% Never married44.5% Now married0.0% Separated8.6% Widowed6.9% DivorcedWomen who did not give birth in the past 12 months Now married:
55.3% (113)Unmarried:
44.7% (91)
Marital status - Native Hawaiian / Pacific Islander population 15 years and over
Males 67.3% Never married24.7% Now married0.0% Separated3.4% Widowed4.6% DivorcedFemales 52.5% Never married23.5% Now married1.3% Separated2.7% Widowed20.0% DivorcedWomen who gave birth in the past 12 months Now married:
54.3% (22)Unmarried:
45.7% (19)
Women who did not give birth in the past 12 months Now married:
26.0% (193)Unmarried:
74.0% (551)
Marital status - Other race population 15 years and over
Males 61.9% Never married33.3% Now married0.0% Separated0.0% Widowed4.8% DivorcedFemales 69.0% Never married24.1% Now married0.0% Separated0.0% Widowed6.9% DivorcedWomen who did not give birth in the past 12 months Now married:
18.4% (11)Unmarried:
81.6% (50)
Marital status - Two or more races population 15 years and over
Males 39.5% Never married37.5% Now married0.7% Separated7.1% Widowed15.2% DivorcedFemales 50.4% Never married30.4% Now married3.1% Separated6.5% Widowed9.6% DivorcedWomen who gave birth in the past 12 months Now married:
39.4% (30)Unmarried:
60.6% (46)
Women who did not give birth in the past 12 months Now married:
29.3% (191)Unmarried:
70.7% (462)
Marital status - White alone, not Hispanic / Latino population 15 years and over
Males 31.9% Never married45.5% Now married11.3% Separated3.9% Widowed7.4% DivorcedFemales 21.4% Never married35.3% Now married3.3% Separated19.0% Widowed21.1% DivorcedWomen who gave birth in the past 12 months Now married:
0.0% (0)Unmarried:
100.0% (6)
Women who did not give birth in the past 12 months Now married:
47.9% (142)Unmarried:
52.1% (154)
Marital status - Hispanic or Latino population 15 years and over
Males 57.8% Never married30.8% Now married0.8% Separated0.0% Widowed10.5% DivorcedFemales 58.1% Never married28.9% Now married1.3% Separated2.0% Widowed9.7% DivorcedWomen who gave birth in the past 12 months Now married:
100.0% (10)Unmarried:
0.0% (0)
Women who did not give birth in the past 12 months Now married:
23.1% (114)Unmarried:
76.9% (380)
Ancestries in Makaha
216 5.6% German67 1.7% English50 1.3% Polish42 1.1% Irish25 0.6% Canadian20 0.5% Danish20 0.5% Icelander19 0.5% Scotch-Irish18 0.5% Italian17 0.4% Portuguese14 0.4% Northern European12 0.3% Slavic11 0.3% Scottish11 0.3% Ukrainian9 0.2% European7 0.2% Norwegian7 0.2% Russian7 0.2% Scandinavian5 0.1% British5 0.1% Swedish2 0.05% American2 0.05% Ethiopian
Geographical mobility in Makaha Same house 1 year ago 1,560 82.1% White (Caucasian)237 63.5% Black or African American39 100.0% American Indian / Alaska Native786 91.2% Asian2,407 65.7% Native Hawaiian / Pacific Islander183 100.0% Other race2,367 87.2% Two or more races1,413 81.9% White alone, not Hispanic / Latino915 56.9% Hispanic or LatinoMoved within same county 107 5.6% White / Caucasian114 30.6% Black or African American41 4.8% Asian1,200 32.7% Native Hawaiian / Pacific Islander7 3.7% Other race245 9.0% Two or more races102 5.9% White alone, not Hispanic / Latino450 28.0% Hispanic or LatinoMoved within same state 22 1.2% White / Caucasian3 0.1% Two or more races22 1.3% White alone, not Hispanic / LatinoMoved from different state 188 9.9% White / Caucasian12 3.1% Black or African American9 1.1% Asian39 1.1% Native Hawaiian / Pacific Islander83 3.1% Two or more races158 9.1% White alone, not Hispanic / Latino71 4.4% Hispanic or LatinoMoved from abroad 33 1.7% White18 2.0% Asian35 2.0% White alone, not Hispanic / Latino
Children Nativity (place of birth) in Makaha
Children under 6 years - Living with two parents Both parents native 214 100.0% NativeBoth parents foreign-born 102 100.0% NativeOne native, one foreign-born parent 107 100.0% NativeChildren under 6 years - Living with one parent Native parent 534 100.0% NativeForeign-born parent 34 100.0% NativeChildren 6 to 17 years - Living with two parents Both parents native 344 100.0% NativeBoth parents foreign-born 80 38.0% Native130 62.0% Foreign-bornOne native, one foreign-born parent 190 100.0% NativeChildren 6 to 17 years - Living with one parent Native parent 921 100.0% NativeForeign-born parent 109 62.0% Native67 38.0% Foreign-born
Grandparents responsible for own grandchildren in Makaha
Grandparents (30 to 59 years) White / Caucasian 3 100.0% Not responsible for grandchildrenAsian 11 100.0% Not responsible for grandchildrenNative Hawaiian / Pacific Islander 14 35.2% Responsible for grandchildren25 64.8% Not responsible for grandchildrenTwo or more races 4 19.3% Responsible for grandchildren17 80.7% Not responsible for grandchildrenWhite alone, not Hispanic / Latino 3 100.0% Not responsible for grandchildrenHispanic or Latino 8 100.0% Not responsible for grandchildrenGrandparents (60 years and over) White / Caucasian 10 100.0% Not responsible for grandchildrenAsian 9 40.1% Responsible for grandchildren13 59.9% Not responsible for grandchildrenNative Hawaiian / Pacific Islander 89 67.6% Responsible for grandchildren43 32.4% Not responsible for grandchildrenTwo or more races 15 21.7% Responsible for grandchildren52 78.3% Not responsible for grandchildrenWhite alone, not Hispanic / Latino 10 100.0% Not responsible for grandchildrenHispanic or Latino 4 100.0% Responsible for grandchildren