Races in Ilchester, Maryland (MD) Detailed Stats
Data:
Races - White alone (%)
Races - White alone (% change since 2000)
Races - Black alone (%)
Races - Black alone (% change since 2000)
Races - American Indian alone (%)
Races - American Indian alone (% change since 2000)
Races - Asian alone (%)
Races - Asian alone (% change since 2000)
Races - Hispanic (%)
Races - Hispanic (% change since 2000)
Races - Native Hawaiian and Other Pacific Islander alone (%)
Races - Native Hawaiian and Other Pacific Islander alone (% change since 2000)
Races - Two or more races(%)
Races - Two or more races(% change since 2000)
Races - Other race alone (%)
Races - Other race alone (% change since 2000)
Racial diversity
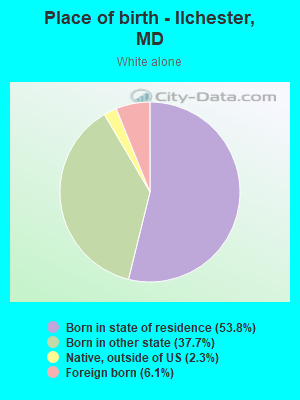
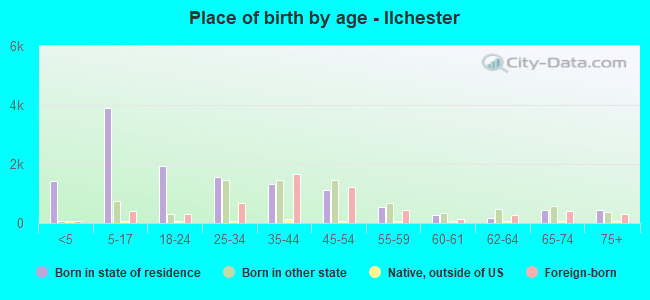
Place of birth - Born in state of residence (%)
Place of birth - Born in state of residence (%) - White
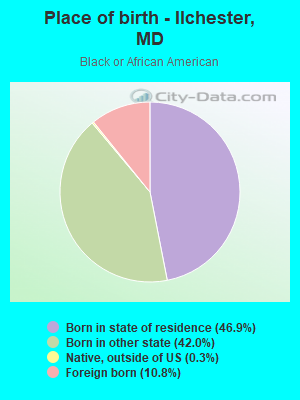
Place of birth - Born in state of residence (%) - Black or African American
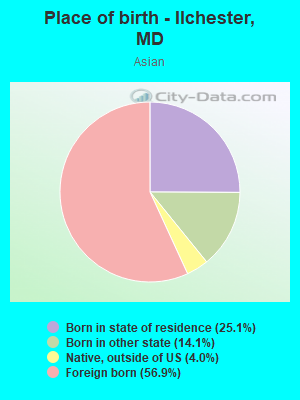
Place of birth - Born in state of residence (%) - Asian
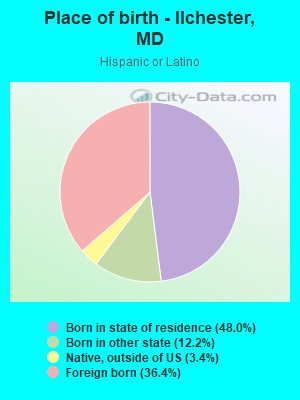
Place of birth - Born in state of residence (%) - Hispanic or Latino
Place of birth - Born in state of residence (%) - American Indian and Alaska Native
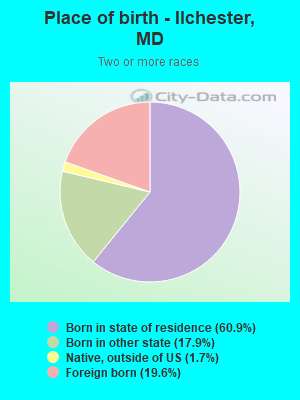
Place of birth - Born in state of residence (%) - Multirace
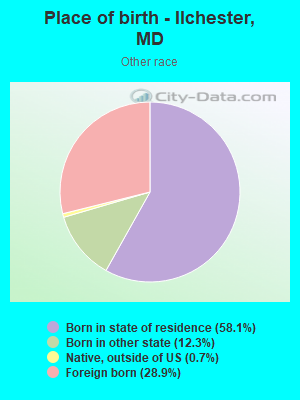
Place of birth - Born in state of residence (%) - Other Race
Place of birth - Born in other state (%)
Place of birth - Born in other state (%) - White
Place of birth - Born in other state (%) - Black or African American
Place of birth - Born in other state (%) - Asian
Place of birth - Born in other state (%) - Hispanic or Latino
Place of birth - Born in other state (%) - American Indian and Alaska Native
Place of birth - Born in other state (%) - Multirace
Place of birth - Born in other state (%) - Other Race
Place of birth - Native, outside of US (%)
Place of birth - Native, outside of US (%) - White
Place of birth - Native, outside of US (%) - Black or African American
Place of birth - Native, outside of US (%) - Asian
Place of birth - Native, outside of US (%) - Hispanic or Latino
Place of birth - Native, outside of US (%) - American Indian and Alaska Native
Place of birth - Native, outside of US (%) - Multirace
Place of birth - Native, outside of US (%) - Other Race
Place of birth - Foreign born (%)
Place of birth - Foreign born (%) - White
Place of birth - Foreign born (%) - Black or African American
Place of birth - Foreign born (%) - Asian
Place of birth - Foreign born (%) - Hispanic or Latino
Place of birth - Foreign born (%) - American Indian and Alaska Native
Place of birth - Foreign born (%) - Multirace
Place of birth - Foreign born (%) - Other Race
Residents speaking English at home (%)
Residents speaking English at home - Born in the United States (%)
Residents speaking English at home - Native, born elsewhere (%)
Residents speaking English at home - Foreign born (%)
Residents speaking Spanish at home (%)
Residents speaking Spanish at home - Born in the United States (%)
Residents speaking Spanish at home - Native, born elsewhere (%)
Residents speaking Spanish at home - Foreign born (%)
Residents speaking other language at home (%)
Residents speaking other language at home - Born in the United States (%)
Residents speaking other language at home - Native, born elsewhere (%)
Residents speaking other language at home - Foreign born (%)
Marital status - Never married (%)
Marital status - Now married (%)
Marital status - Separated (%)
Marital status - Widowed (%)
Marital status - Divorced (%)
Ancestries Reported - Arab (%)
Ancestries Reported - Czech (%)
Ancestries Reported - Danish (%)
Ancestries Reported - Dutch (%)
Ancestries Reported - English (%)
Ancestries Reported - French (%)
Ancestries Reported - French Canadian (%)
Ancestries Reported - German (%)
Ancestries Reported - Greek (%)
Ancestries Reported - Hungarian (%)
Ancestries Reported - Irish (%)
Ancestries Reported - Italian (%)
Ancestries Reported - Lithuanian (%)
Ancestries Reported - Norwegian (%)
Ancestries Reported - Polish (%)
Ancestries Reported - Portuguese (%)
Ancestries Reported - Russian (%)
Ancestries Reported - Scotch-Irish (%)
Ancestries Reported - Scottish (%)
Ancestries Reported - Slovak (%)
Ancestries Reported - Subsaharan African (%)
Ancestries Reported - Swedish (%)
Ancestries Reported - Swiss (%)
Ancestries Reported - Ukrainian (%)
Ancestries Reported - United States (%)
Ancestries Reported - Welsh (%)
Ancestries Reported - West Indian (%)
Ancestries Reported - Other (%)
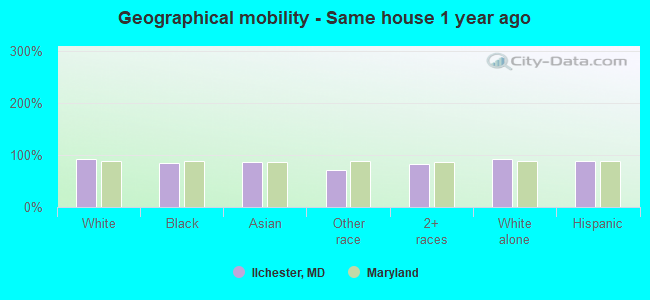
Geographical mobility - Same house 1 year ago (%)
Geographical mobility - Same house 1 year ago (%) - White
Geographical mobility - Same house 1 year ago (%) - Black or African American
Geographical mobility - Same house 1 year ago (%) - Asian
Geographical mobility - Same house 1 year ago (%) - Hispanic or Latino
Geographical mobility - Same house 1 year ago (%) - American Indian and Alaska Native
Geographical mobility - Same house 1 year ago (%) - Multirace
Geographical mobility - Same house 1 year ago (%) - Other Race
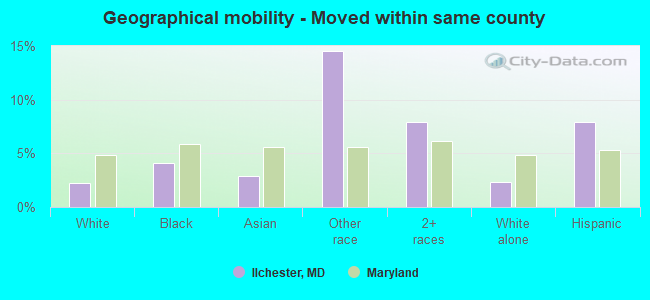
Geographical mobility - Moved within same county (%)
Geographical mobility - Moved within same county (%) - White
Geographical mobility - Moved within same county (%) - Black or African American
Geographical mobility - Moved within same county (%) - Asian
Geographical mobility - Moved within same county (%) - Hispanic or Latino
Geographical mobility - Moved within same county (%) - American Indian and Alaska Native
Geographical mobility - Moved within same county (%) - Multirace
Geographical mobility - Moved within same county (%) - Other Race
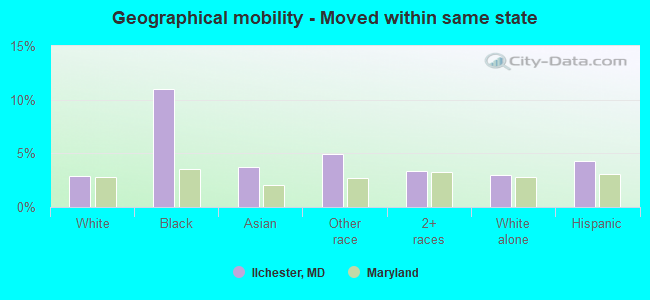
Geographical mobility - Moved from different county within same state (%)
Geographical mobility - Moved from different county within same state (%) - White
Geographical mobility - Moved from different county within same state (%) - Black or African American
Geographical mobility - Moved from different county within same state (%) - Asian
Geographical mobility - Moved from different county within same state (%) - Hispanic or Latino
Geographical mobility - Moved from different county within same state (%) - American Indian and Alaska Native
Geographical mobility - Moved from different county within same state (%) - Multirace
Geographical mobility - Moved from different county within same state (%) - Other Race
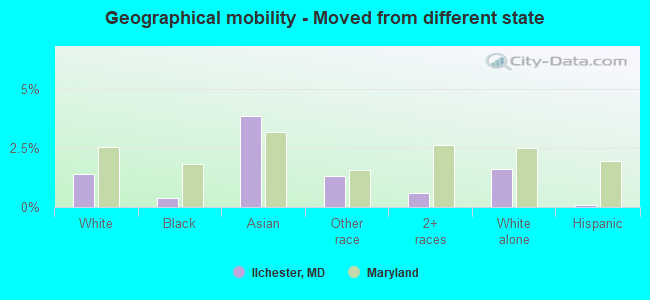
Geographical mobility - Moved from different state (%)
Geographical mobility - Moved from different state (%) - White
Geographical mobility - Moved from different state (%) - Black or African American
Geographical mobility - Moved from different state (%) - Asian
Geographical mobility - Moved from different state (%) - Hispanic or Latino
Geographical mobility - Moved from different state (%) - American Indian and Alaska Native
Geographical mobility - Moved from different state (%) - Multirace
Geographical mobility - Moved from different state (%) - Other Race
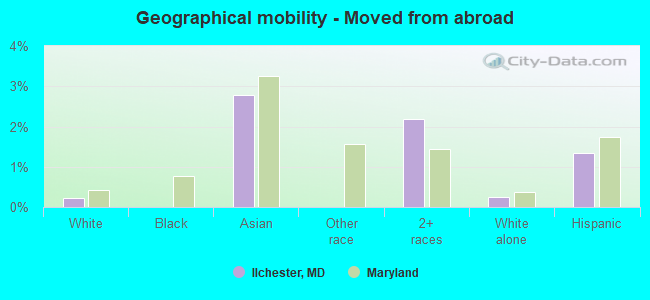
Geographical mobility - Moved from abroad (%)
Geographical mobility - Moved from abroad (%) - White
Geographical mobility - Moved from abroad (%) - Black or African American
Geographical mobility - Moved from abroad (%) - Asian
Geographical mobility - Moved from abroad (%) - Hispanic or Latino
Geographical mobility - Moved from abroad (%) - American Indian and Alaska Native
Geographical mobility - Moved from abroad (%) - Multirace
Geographical mobility - Moved from abroad (%) - Other Race
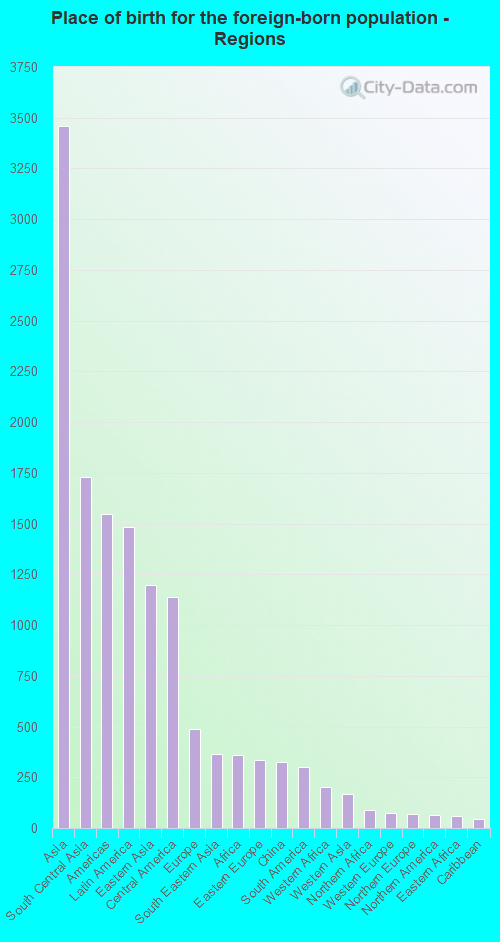
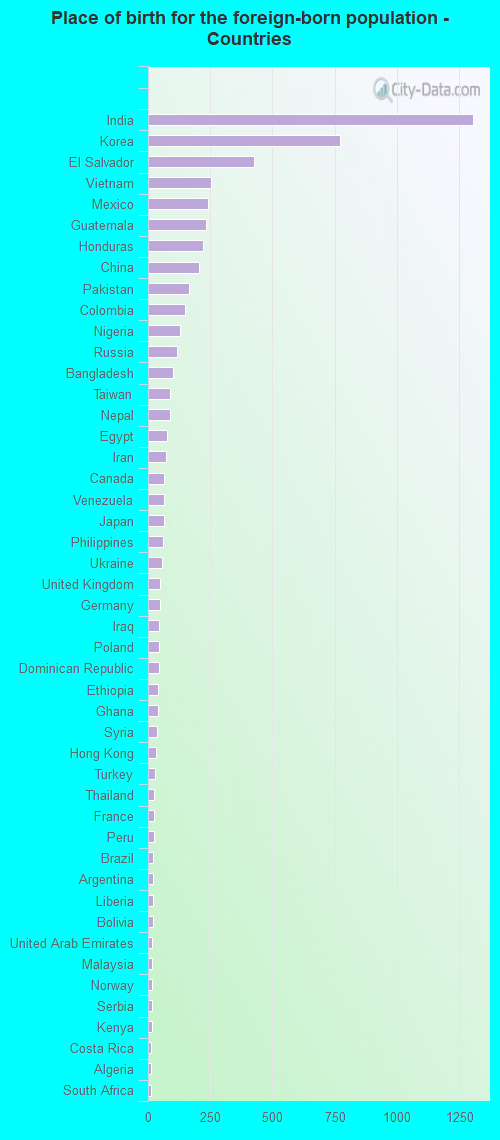
Place of birth for the foreign-born population - Ireland (%)
Place of birth for the foreign-born population - Denmark (%)
Place of birth for the foreign-born population - Norway (%)
Place of birth for the foreign-born population - Sweden (%)
Place of birth for the foreign-born population - United Kingdom (%)
Place of birth for the foreign-born population - England (%)
Place of birth for the foreign-born population - Scotland (%)
Place of birth for the foreign-born population - Other Northern Europe (%)
Place of birth for the foreign-born population - Austria (%)
Place of birth for the foreign-born population - Belgium (%)
Place of birth for the foreign-born population - France (%)
Place of birth for the foreign-born population - Germany (%)
Place of birth for the foreign-born population - Netherlands (%)
Place of birth for the foreign-born population - Switzerland (%)
Place of birth for the foreign-born population - Other Western Europe (%)
Place of birth for the foreign-born population - Greece (%)
Place of birth for the foreign-born population - Italy (%)
Place of birth for the foreign-born population - Portugal (%)
Place of birth for the foreign-born population - Spain (%)
Place of birth for the foreign-born population - Other Southern Europe (%)
Place of birth for the foreign-born population - Albania (%)
Place of birth for the foreign-born population - Belarus (%)
Place of birth for the foreign-born population - Bosnia and Herzegovina (%)
Place of birth for the foreign-born population - Bulgaria (%)
Place of birth for the foreign-born population - Croatia (%)
Place of birth for the foreign-born population - Czechoslovakia (%)
Place of birth for the foreign-born population - Hungary (%)
Place of birth for the foreign-born population - Latvia (%)
Place of birth for the foreign-born population - Lithuania (%)
Place of birth for the foreign-born population - North Macedonia (Macedonia) (%)
Place of birth for the foreign-born population - Moldova (%)
Place of birth for the foreign-born population - Poland (%)
Place of birth for the foreign-born population - Romania (%)
Place of birth for the foreign-born population - Russia (%)
Place of birth for the foreign-born population - Serbia (%)
Place of birth for the foreign-born population - Ukraine (%)
Place of birth for the foreign-born population - Other Eastern Europe (%)
Place of birth for the foreign-born population - China (%)
Place of birth for the foreign-born population - Hong Kong (%)
Place of birth for the foreign-born population - Taiwan (%)
Place of birth for the foreign-born population - Japan (%)
Place of birth for the foreign-born population - Korea (%)
Place of birth for the foreign-born population - Other Eastern Asia (%)
Place of birth for the foreign-born population - Afghanistan (%)
Place of birth for the foreign-born population - Bangladesh (%)
Place of birth for the foreign-born population - India (%)
Place of birth for the foreign-born population - Iran (%)
Place of birth for the foreign-born population - Kazakhstan (%)
Place of birth for the foreign-born population - Nepal (%)
Place of birth for the foreign-born population - Pakistan (%)
Place of birth for the foreign-born population - Sri Lanka (%)
Place of birth for the foreign-born population - Uzbekistan (%)
Place of birth for the foreign-born population - Other South Central Asia (%)
Place of birth for the foreign-born population - Burma (%)
Place of birth for the foreign-born population - Cambodia (%)
Place of birth for the foreign-born population - Indonesia (%)
Place of birth for the foreign-born population - Laos (%)
Place of birth for the foreign-born population - Malaysia (%)
Place of birth for the foreign-born population - Philippines (%)
Place of birth for the foreign-born population - Singapore (%)
Place of birth for the foreign-born population - Thailand (%)
Place of birth for the foreign-born population - Vietnam (%)
Place of birth for the foreign-born population - Other South Eastern Asia (%)
Place of birth for the foreign-born population - Armenia (%)
Place of birth for the foreign-born population - Iraq (%)
Place of birth for the foreign-born population - Israel (%)
Place of birth for the foreign-born population - Jordan (%)
Place of birth for the foreign-born population - Kuwait (%)
Place of birth for the foreign-born population - Lebanon (%)
Place of birth for the foreign-born population - Saudi Arabia (%)
Place of birth for the foreign-born population - Syria (%)
Place of birth for the foreign-born population - Turkey (%)
Place of birth for the foreign-born population - Yemen (%)
Place of birth for the foreign-born population - Other Western Asia (%)
Place of birth for the foreign-born population - Eritrea (%)
Place of birth for the foreign-born population - Ethiopia (%)
Place of birth for the foreign-born population - Kenya (%)
Place of birth for the foreign-born population - Somalia (%)
Place of birth for the foreign-born population - Uganda (%)
Place of birth for the foreign-born population - Zimbabwe (%)
Place of birth for the foreign-born population - Other Eastern Africa (%)
Place of birth for the foreign-born population - Cameroon (%)
Place of birth for the foreign-born population - Congo (%)
Place of birth for the foreign-born population - Democratic Republic of Congo (Zaire) (%)
Place of birth for the foreign-born population - Other Middle Africa (%)
Place of birth for the foreign-born population - Egypt (%)
Place of birth for the foreign-born population - Morocco (%)
Place of birth for the foreign-born population - Sudan (%)
Place of birth for the foreign-born population - Other Northern Africa (%)
Place of birth for the foreign-born population - South Africa (%)
Place of birth for the foreign-born population - Other Southern Africa (%)
Place of birth for the foreign-born population - Cabo Verde (%)
Place of birth for the foreign-born population - Ghana (%)
Place of birth for the foreign-born population - Liberia (%)
Place of birth for the foreign-born population - Nigeria (%)
Place of birth for the foreign-born population - Senegal (%)
Place of birth for the foreign-born population - Sierra Leone (%)
Place of birth for the foreign-born population - Other Western Africa (%)
Place of birth for the foreign-born population - Australia (%)
Place of birth for the foreign-born population - New Zealand (%)
Place of birth for the foreign-born population - Fiji (%)
Place of birth for the foreign-born population - Micronesia (%)
Place of birth for the foreign-born population - Bahamas (%)
Place of birth for the foreign-born population - Barbados (%)
Place of birth for the foreign-born population - Cuba (%)
Place of birth for the foreign-born population - Dominica (%)
Place of birth for the foreign-born population - Dominican Republic (%)
Place of birth for the foreign-born population - Grenada (%)
Place of birth for the foreign-born population - Haiti (%)
Place of birth for the foreign-born population - Jamaica (%)
Place of birth for the foreign-born population - St. Vincent and the Grenadines (%)
Place of birth for the foreign-born population - Trinidad and Tobago (%)
Place of birth for the foreign-born population - West Indies (%)
Place of birth for the foreign-born population - Other Caribbean (%)
Place of birth for the foreign-born population - Belize (%)
Place of birth for the foreign-born population - Costa Rica (%)
Place of birth for the foreign-born population - El Salvador (%)
Place of birth for the foreign-born population - Guatemala (%)
Place of birth for the foreign-born population - Honduras (%)
Place of birth for the foreign-born population - Mexico (%)
Place of birth for the foreign-born population - Nicaragua (%)
Place of birth for the foreign-born population - Panama (%)
Place of birth for the foreign-born population - Other Central America (%)
Place of birth for the foreign-born population - Argentina (%)
Place of birth for the foreign-born population - Bolivia (%)
Place of birth for the foreign-born population - Brazil (%)
Place of birth for the foreign-born population - Chile (%)
Place of birth for the foreign-born population - Colombia (%)
Place of birth for the foreign-born population - Ecuador (%)
Place of birth for the foreign-born population - Guyana (%)
Place of birth for the foreign-born population - Peru (%)
Place of birth for the foreign-born population - Uruguay (%)
Place of birth for the foreign-born population - Venezuela (%)
Place of birth for the foreign-born population - Other South America (%)
Place of birth for the foreign-born population - Canada (%)
Place of birth for the foreign-born population - Other Northern America (%)
Place of birth for the foreign-born population - Other (%)
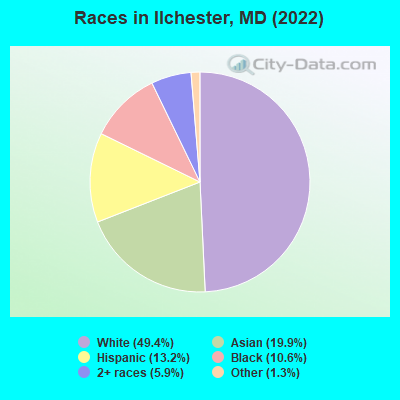
According to 2022 data, the most numerous races in Ilchester, MD are White alone (13,623 residents), Black alone (2,911 residents), and Hispanic (3,652 residents). 72.3% of Ilchester residents speak English at home.
Race distribution in Ilchester 13,623 49.4% White alone 5,482 19.9% Asian alone 3,652 13.2% Hispanic 2,911 10.6% Black alone 1,622 5.9% Two or more races 357 1.3% Other race alone
2000 2022
3,286,547 62.1% White alone 1,464,735 27.7% Black alone 227,916 4.3% Hispanic 209,738 4.0% Asian alone 82,946 1.6% Two or more races 13,312 0.3% American Indian alone 9,379 0.2% Other race alone 1,913 0.04% Native Hawaiian and Other
2,906,492 47.1% White alone 1,800,914 29.2% Black alone 705,842 11.4% Hispanic 401,818 6.5% Asian alone 291,317 4.7% Two or more races 46,930 0.8% Other race alone 8,930 0.1% American Indian alone 2,417 0.04% Native Hawaiian and Other
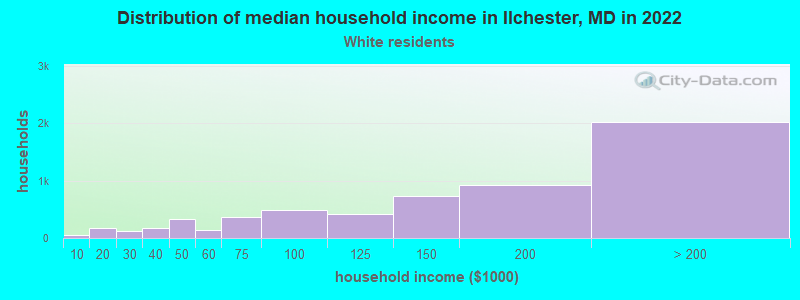
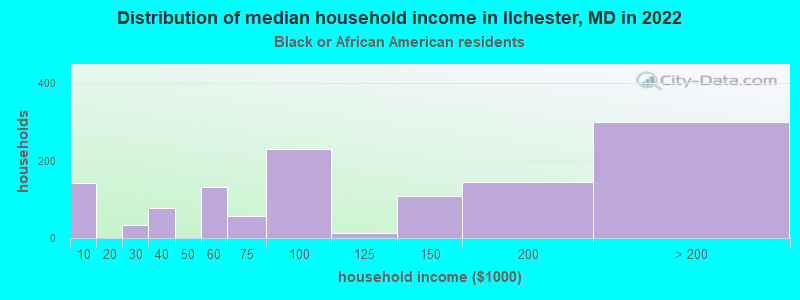
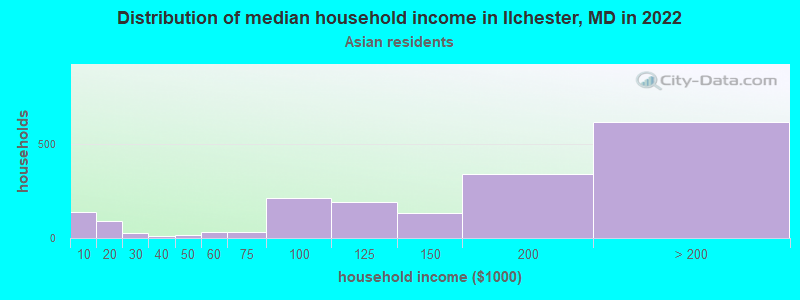
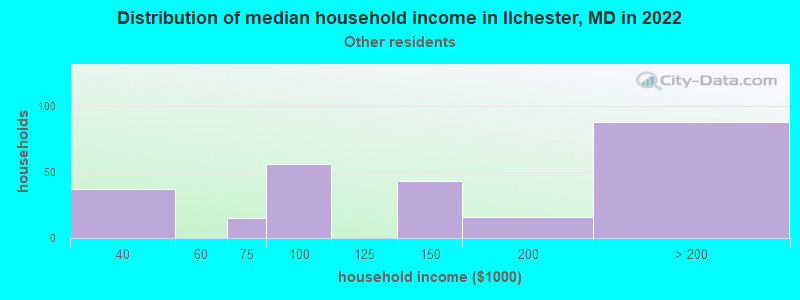
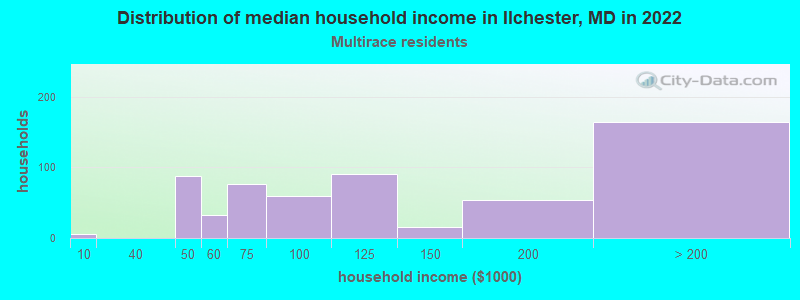
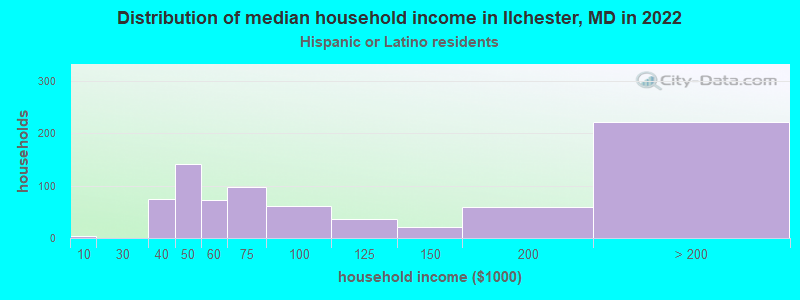
Income and house value in Ilchester Median household income in 2022 $150,421 White non-Hispanic householders$120,341 Black householders$170,173 Asian householders$117,724 Some other race householders$84,803 Two or more races householders$80,964 Hispanic or Latino race householders
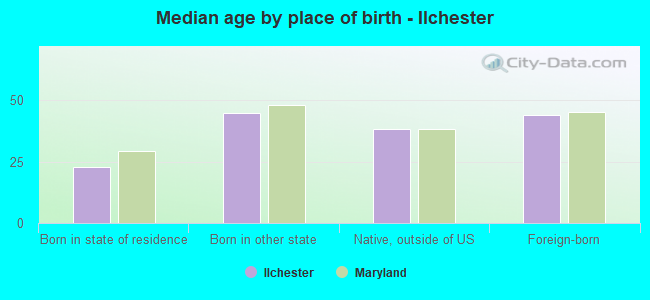
Median age by race in Ilchester
40.1 Median age for White residents40.4 40.3 40.0 Median age for Black or African American residents35.4 41.9 -617,131,062.3 Median age for American Indian / Alaska Native residents-634,408,601.5 -953,703,702.8 38.5 Median age for Asian residents37.8 39.1 -763,333,332.6 Median age for Native Hawaiian / Pacific Islander residents-720,061,021.4 -760,942,760.2 21.9 Median age for Other race residents21.7 23.0 19.2 Median age for Two or more races residents19.4 17.8 40.5 Median age for White alone residents40.1 40.3 28.0 Median age for Hispanic or Latino residents22.8 29.5
Owner/renter occupied households by race in Ilchester
House owners and renters - White residents 5,042 85.6% Owner occupied846 14.4% Renter occupiedHouse owners and renters - Black or African American residents 741 63.5% Owner occupied425 36.5% Renter occupiedHouse owners and renters - Asian residents 1,357 72.4% Owner occupied518 27.6% Renter occupiedHouse owners and renters - Other race residents 145 42.6% Owner occupied196 57.4% Renter occupiedHouse owners and renters - Two or more races residents 368 70.4% Owner occupied155 29.6% Renter occupiedHouse owners and renters - White alone residents 4,956 85.7% Owner occupied825 14.3% Renter occupiedHouse owners and renters - Hispanic or Latino residents 402 58.1% Owner occupied289 41.9% Renter occupied
Language usage in Ilchester
English speakers - Total 72.3% of residents of Ilchester speak English at home.
9.3% of residents speak Spanish at home 1,428 58.9% Speak English very well995 41.1% Speak English less than very well18.5% of residents speak other language at home 3,493 72.4% Speak English very well1,330 27.6% Speak English less than very well
English speakers - Born in the United States 92.1% of residents of Ilchester speak English at home.
2.0% of residents speak Spanish at home 154 97.5% Speak English very well4 2.5% Speak English less than very well5.8% of residents speak other language at home 396 86.1% Speak English very well64 13.9% Speak English less than very well
English speakers - Native, born elsewhere 64.0% of residents of Ilchester speak English at home.
23.1% of residents speak Spanish at home 72 56.2% Speak English very well56 43.8% Speak English less than very well9.4% of residents speak other language at home 45 86.5% Speak English very well7 13.5% Speak English less than very well
English speakers - Foreign-born 14.4% of residents of Ilchester speak English at home.
23.7% of residents speak Spanish at home 450 32.6% Speak English very well932 67.4% Speak English less than very well61.0% of residents speak other language at home 2,430 68.3% Speak English very well1,126 31.7% Speak English less than very well
White (Caucasian) - Speak only English Native:
94.8% (11,884)Foreign-born:
29.3% (277)
White (Caucasian) - Speak another language Native:
5.3% (662)Foreign-born:
70.8% (670)
Black or African American - Speak only English Native:
97.3% (2,436)Foreign-born:
10.6% (33)
Black or African American - Speak another language Native:
3.0% (76)Foreign-born:
97.9% (307)
Asian - Speak only English Native:
71.0% (1,566)Foreign-born:
16.1% (503)
Asian - Speak another language Native:
32.0% (706)Foreign-born:
84.0% (2,622)
Other race - Speak another language Native:
19.6% (219)Foreign-born:
100.0% (665)
Two or more races - Speak only English Native:
72.2% (1,566)Foreign-born:
3.7% (26)
Two or more races - Speak another language Native:
28.1% (609)Foreign-born:
87.6% (621)
White alone - Speak only English Native:
96.2% (11,885)Foreign-born:
33.2% (278)
White alone - Speak another language Native:
3.8% (469)Foreign-born:
65.8% (550)
Hispanic or Latino - Speak only English Native:
40.5% (778)Foreign-born:
2.9% (41)
Hispanic or Latino - Speak another language Native:
58.2% (1,119)Foreign-born:
91.8% (1,291)
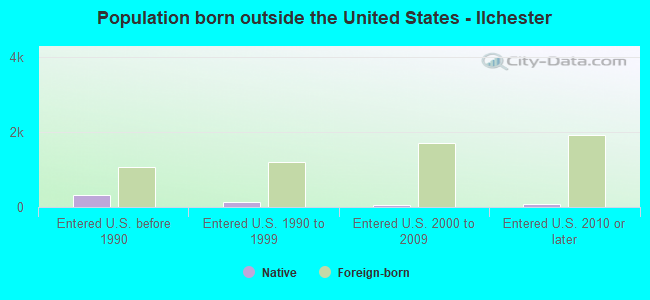
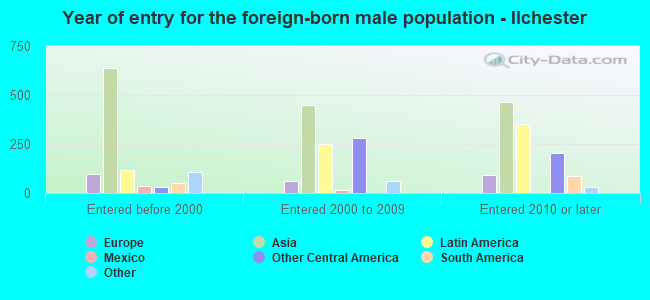
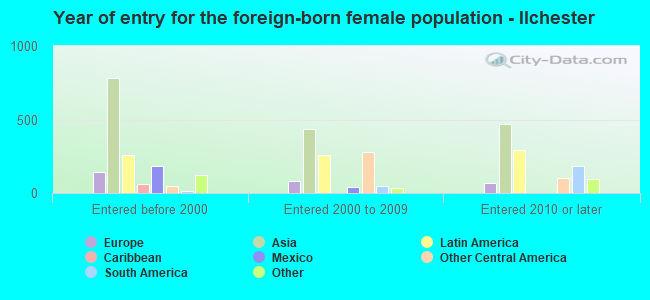
Foreign-born residents in Ilchester
Marital status for residents in Ilchester Marital status - White (Caucasian) population 15 years and over
Males 30.6% Never married59.6% Now married1.3% Separated2.5% Widowed5.9% DivorcedFemales 28.7% Never married53.3% Now married1.0% Separated5.3% Widowed11.7% DivorcedWomen who gave birth in the past 12 months Now married:
100.0% (163)Unmarried:
0.0% (0)
Women who did not give birth in the past 12 months Now married:
46.5% (1,571)Unmarried:
53.5% (1,808)
Marital status - Black or African American population 15 years and over
Males 50.5% Never married39.9% Now married1.2% Separated0.0% Widowed8.4% DivorcedFemales 31.7% Never married42.5% Now married0.0% Separated12.0% Widowed13.9% DivorcedWomen who gave birth in the past 12 months Now married:
100.0% (18)Unmarried:
0.0% (0)
Women who did not give birth in the past 12 months Now married:
33.3% (214)Unmarried:
66.7% (428)
Marital status - Asian population 15 years and over
Males 24.6% Never married71.2% Now married0.0% Separated2.3% Widowed2.0% DivorcedFemales 16.9% Never married70.1% Now married2.6% Separated7.1% Widowed3.3% DivorcedWomen who gave birth in the past 12 months Now married:
100.0% (57)Unmarried:
0.0% (0)
Women who did not give birth in the past 12 months Now married:
76.1% (1,241)Unmarried:
23.9% (390)
Marital status - Other race population 15 years and over
Males 81.3% Never married18.7% Now married0.0% Separated0.0% Widowed0.0% DivorcedFemales 41.6% Never married29.6% Now married0.0% Separated6.5% Widowed22.3% DivorcedWomen who gave birth in the past 12 months Now married:
0.0% (0)Unmarried:
100.0% (40)
Women who did not give birth in the past 12 months Now married:
39.6% (130)Unmarried:
60.4% (198)
Marital status - Two or more races population 15 years and over
Males 38.4% Never married61.6% Now married0.0% Separated0.0% Widowed0.0% DivorcedFemales 43.9% Never married49.8% Now married0.0% Separated5.4% Widowed0.9% DivorcedWomen who did not give birth in the past 12 months Now married:
48.1% (355)Unmarried:
51.9% (382)
Marital status - White alone, not Hispanic / Latino population 15 years and over
Males 30.2% Never married60.0% Now married1.0% Separated2.7% Widowed6.1% DivorcedFemales 28.3% Never married52.9% Now married1.0% Separated5.6% Widowed12.1% DivorcedWomen who gave birth in the past 12 months Now married:
100.0% (164)Unmarried:
0.0% (0)
Women who did not give birth in the past 12 months Now married:
45.4% (1,482)Unmarried:
54.6% (1,784)
Marital status - Hispanic or Latino population 15 years and over
Males 58.1% Never married40.2% Now married1.8% Separated0.0% Widowed0.0% DivorcedFemales 29.7% Never married54.1% Now married0.0% Separated6.2% Widowed10.0% DivorcedWomen who gave birth in the past 12 months Now married:
21.2% (8)Unmarried:
78.8% (29)
Women who did not give birth in the past 12 months Now married:
57.8% (497)Unmarried:
42.2% (363)
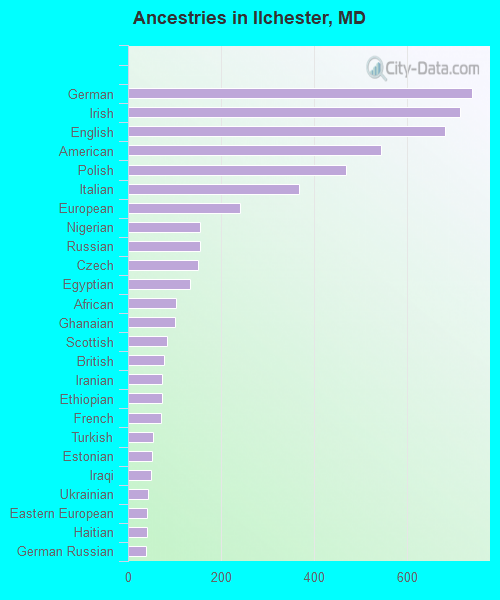
Ancestries in Ilchester
740 5.2% German714 5.0% Irish683 4.8% English544 3.8% American469 3.3% Polish369 2.6% Italian240 1.7% European156 1.1% Nigerian154 1.1% Russian151 1.1% Czech133 0.9% Egyptian104 0.7% African102 0.7% Ghanaian84 0.6% Scottish77 0.5% British74 0.5% Iranian74 0.5% Ethiopian71 0.5% French54 0.4% Turkish52 0.4% Estonian49 0.3% Iraqi44 0.3% Ukrainian40 0.3% Eastern European40 0.3% Haitian38 0.3% German Russian37 0.3% Norwegian25 0.2% Greek24 0.2% Brazilian24 0.2% Scotch-Irish21 0.1% Canadian16 0.1% Serbian15 0.1% Dutch13 0.09% South African12 0.08% Slovak9 0.06% Northern European9 0.06% Lebanese9 0.06% Czechoslovakian6 0.04% West Indian5 0.04% Swiss5 0.04% Cajun
Geographical mobility in Ilchester Same house 1 year ago 12,825 92.9% White (Caucasian)2,472 85.3% Black or African American4,718 86.1% Asian1,411 71.9% Other race2,865 82.7% Two or more races12,479 92.4% White alone, not Hispanic / Latino3,093 87.9% Hispanic or LatinoMoved within same county 307 2.2% White / Caucasian120 4.1% Black or African American158 2.9% Asian284 14.5% Other race274 7.9% Two or more races317 2.3% White alone, not Hispanic / Latino277 7.9% Hispanic or LatinoMoved within same state 393 2.8% White / Caucasian318 11.0% Black or African American206 3.8% Asian97 5.0% Other race116 3.3% Two or more races396 2.9% White alone, not Hispanic / Latino152 4.3% Hispanic or LatinoMoved from different state 193 1.4% White / Caucasian11 0.4% Black or African American210 3.8% Asian25 1.3% Other race21 0.6% Two or more races219 1.6% White alone, not Hispanic / Latino3 0.1% Hispanic or LatinoMoved from abroad 32 0.2% White153 2.8% Asian76 2.2% Two or more races33 0.2% White alone, not Hispanic / Latino47 1.3% Hispanic or Latino
Children Nativity (place of birth) in Ilchester
Children under 6 years - Living with two parents Both parents native 842 100.0% NativeBoth parents foreign-born 303 96.3% Native11 3.7% Foreign-bornOne native, one foreign-born parent 450 100.0% NativeChildren under 6 years - Living with one parent Native parent 151 100.0% NativeChildren 6 to 17 years - Living with two parents Both parents native 1,791 99.0% Native19 1.0% Foreign-bornBoth parents foreign-born 870 83.8% Native168 16.2% Foreign-bornOne native, one foreign-born parent 710 96.8% Native24 3.2% Foreign-bornChildren 6 to 17 years - Living with one parent Native parent 297 100.0% NativeForeign-born parent 379 60.7% Native245 39.3% Foreign-born
Grandparents responsible for own grandchildren in Ilchester
Grandparents (30 to 59 years) White / Caucasian 14 29.1% Responsible for grandchildren34 70.9% Not responsible for grandchildrenBlack or African American 20 100.0% Responsible for grandchildrenOther race 35 100.0% Not responsible for grandchildrenTwo or more races 26 100.0% Not responsible for grandchildrenWhite alone, not Hispanic / Latino 14 27.9% Responsible for grandchildren37 72.1% Not responsible for grandchildrenHispanic or Latino 55 100.0% Not responsible for grandchildrenGrandparents (60 years and over) White / Caucasian 12 6.7% Responsible for grandchildren163 93.3% Not responsible for grandchildrenBlack or African American 29 100.0% Not responsible for grandchildrenTwo or more races 96 100.0% Not responsible for grandchildrenWhite alone, not Hispanic / Latino 12 8.2% Responsible for grandchildren131 91.8% Not responsible for grandchildrenHispanic or Latino 91 100.0% Not responsible for grandchildren