Races in Happy Valley, Oregon (OR) Detailed Stats
Data:
Races - White alone (%)
Races - White alone (% change since 2000)
Races - Black alone (%)
Races - Black alone (% change since 2000)
Races - American Indian alone (%)
Races - American Indian alone (% change since 2000)
Races - Asian alone (%)
Races - Asian alone (% change since 2000)
Races - Hispanic (%)
Races - Hispanic (% change since 2000)
Races - Native Hawaiian and Other Pacific Islander alone (%)
Races - Native Hawaiian and Other Pacific Islander alone (% change since 2000)
Races - Two or more races(%)
Races - Two or more races(% change since 2000)
Races - Other race alone (%)
Races - Other race alone (% change since 2000)
Racial diversity
Place of birth - Born in state of residence (%)
Place of birth - Born in state of residence (%) - White
Place of birth - Born in state of residence (%) - Black or African American
Place of birth - Born in state of residence (%) - Asian
Place of birth - Born in state of residence (%) - Hispanic or Latino
Place of birth - Born in state of residence (%) - American Indian and Alaska Native
Place of birth - Born in state of residence (%) - Multirace
Place of birth - Born in state of residence (%) - Other Race
Place of birth - Born in other state (%)
Place of birth - Born in other state (%) - White
Place of birth - Born in other state (%) - Black or African American
Place of birth - Born in other state (%) - Asian
Place of birth - Born in other state (%) - Hispanic or Latino
Place of birth - Born in other state (%) - American Indian and Alaska Native
Place of birth - Born in other state (%) - Multirace
Place of birth - Born in other state (%) - Other Race
Place of birth - Native, outside of US (%)
Place of birth - Native, outside of US (%) - White
Place of birth - Native, outside of US (%) - Black or African American
Place of birth - Native, outside of US (%) - Asian
Place of birth - Native, outside of US (%) - Hispanic or Latino
Place of birth - Native, outside of US (%) - American Indian and Alaska Native
Place of birth - Native, outside of US (%) - Multirace
Place of birth - Native, outside of US (%) - Other Race
Place of birth - Foreign born (%)
Place of birth - Foreign born (%) - White
Place of birth - Foreign born (%) - Black or African American
Place of birth - Foreign born (%) - Asian
Place of birth - Foreign born (%) - Hispanic or Latino
Place of birth - Foreign born (%) - American Indian and Alaska Native
Place of birth - Foreign born (%) - Multirace
Place of birth - Foreign born (%) - Other Race
Residents speaking English at home (%)
Residents speaking English at home - Born in the United States (%)
Residents speaking English at home - Native, born elsewhere (%)
Residents speaking English at home - Foreign born (%)
Residents speaking Spanish at home (%)
Residents speaking Spanish at home - Born in the United States (%)
Residents speaking Spanish at home - Native, born elsewhere (%)
Residents speaking Spanish at home - Foreign born (%)
Residents speaking other language at home (%)
Residents speaking other language at home - Born in the United States (%)
Residents speaking other language at home - Native, born elsewhere (%)
Residents speaking other language at home - Foreign born (%)
Marital status - Never married (%)
Marital status - Now married (%)
Marital status - Separated (%)
Marital status - Widowed (%)
Marital status - Divorced (%)
Ancestries Reported - Arab (%)
Ancestries Reported - Czech (%)
Ancestries Reported - Danish (%)
Ancestries Reported - Dutch (%)
Ancestries Reported - English (%)
Ancestries Reported - French (%)
Ancestries Reported - French Canadian (%)
Ancestries Reported - German (%)
Ancestries Reported - Greek (%)
Ancestries Reported - Hungarian (%)
Ancestries Reported - Irish (%)
Ancestries Reported - Italian (%)
Ancestries Reported - Lithuanian (%)
Ancestries Reported - Norwegian (%)
Ancestries Reported - Polish (%)
Ancestries Reported - Portuguese (%)
Ancestries Reported - Russian (%)
Ancestries Reported - Scotch-Irish (%)
Ancestries Reported - Scottish (%)
Ancestries Reported - Slovak (%)
Ancestries Reported - Subsaharan African (%)
Ancestries Reported - Swedish (%)
Ancestries Reported - Swiss (%)
Ancestries Reported - Ukrainian (%)
Ancestries Reported - United States (%)
Ancestries Reported - Welsh (%)
Ancestries Reported - West Indian (%)
Ancestries Reported - Other (%)
Geographical mobility - Same house 1 year ago (%)
Geographical mobility - Same house 1 year ago (%) - White
Geographical mobility - Same house 1 year ago (%) - Black or African American
Geographical mobility - Same house 1 year ago (%) - Asian
Geographical mobility - Same house 1 year ago (%) - Hispanic or Latino
Geographical mobility - Same house 1 year ago (%) - American Indian and Alaska Native
Geographical mobility - Same house 1 year ago (%) - Multirace
Geographical mobility - Same house 1 year ago (%) - Other Race
Geographical mobility - Moved within same county (%)
Geographical mobility - Moved within same county (%) - White
Geographical mobility - Moved within same county (%) - Black or African American
Geographical mobility - Moved within same county (%) - Asian
Geographical mobility - Moved within same county (%) - Hispanic or Latino
Geographical mobility - Moved within same county (%) - American Indian and Alaska Native
Geographical mobility - Moved within same county (%) - Multirace
Geographical mobility - Moved within same county (%) - Other Race
Geographical mobility - Moved from different county within same state (%)
Geographical mobility - Moved from different county within same state (%) - White
Geographical mobility - Moved from different county within same state (%) - Black or African American
Geographical mobility - Moved from different county within same state (%) - Asian
Geographical mobility - Moved from different county within same state (%) - Hispanic or Latino
Geographical mobility - Moved from different county within same state (%) - American Indian and Alaska Native
Geographical mobility - Moved from different county within same state (%) - Multirace
Geographical mobility - Moved from different county within same state (%) - Other Race
Geographical mobility - Moved from different state (%)
Geographical mobility - Moved from different state (%) - White
Geographical mobility - Moved from different state (%) - Black or African American
Geographical mobility - Moved from different state (%) - Asian
Geographical mobility - Moved from different state (%) - Hispanic or Latino
Geographical mobility - Moved from different state (%) - American Indian and Alaska Native
Geographical mobility - Moved from different state (%) - Multirace
Geographical mobility - Moved from different state (%) - Other Race
Geographical mobility - Moved from abroad (%)
Geographical mobility - Moved from abroad (%) - White
Geographical mobility - Moved from abroad (%) - Black or African American
Geographical mobility - Moved from abroad (%) - Asian
Geographical mobility - Moved from abroad (%) - Hispanic or Latino
Geographical mobility - Moved from abroad (%) - American Indian and Alaska Native
Geographical mobility - Moved from abroad (%) - Multirace
Geographical mobility - Moved from abroad (%) - Other Race
Place of birth for the foreign-born population - Ireland (%)
Place of birth for the foreign-born population - Denmark (%)
Place of birth for the foreign-born population - Norway (%)
Place of birth for the foreign-born population - Sweden (%)
Place of birth for the foreign-born population - United Kingdom (%)
Place of birth for the foreign-born population - England (%)
Place of birth for the foreign-born population - Scotland (%)
Place of birth for the foreign-born population - Other Northern Europe (%)
Place of birth for the foreign-born population - Austria (%)
Place of birth for the foreign-born population - Belgium (%)
Place of birth for the foreign-born population - France (%)
Place of birth for the foreign-born population - Germany (%)
Place of birth for the foreign-born population - Netherlands (%)
Place of birth for the foreign-born population - Switzerland (%)
Place of birth for the foreign-born population - Other Western Europe (%)
Place of birth for the foreign-born population - Greece (%)
Place of birth for the foreign-born population - Italy (%)
Place of birth for the foreign-born population - Portugal (%)
Place of birth for the foreign-born population - Spain (%)
Place of birth for the foreign-born population - Other Southern Europe (%)
Place of birth for the foreign-born population - Albania (%)
Place of birth for the foreign-born population - Belarus (%)
Place of birth for the foreign-born population - Bosnia and Herzegovina (%)
Place of birth for the foreign-born population - Bulgaria (%)
Place of birth for the foreign-born population - Croatia (%)
Place of birth for the foreign-born population - Czechoslovakia (%)
Place of birth for the foreign-born population - Hungary (%)
Place of birth for the foreign-born population - Latvia (%)
Place of birth for the foreign-born population - Lithuania (%)
Place of birth for the foreign-born population - North Macedonia (Macedonia) (%)
Place of birth for the foreign-born population - Moldova (%)
Place of birth for the foreign-born population - Poland (%)
Place of birth for the foreign-born population - Romania (%)
Place of birth for the foreign-born population - Russia (%)
Place of birth for the foreign-born population - Serbia (%)
Place of birth for the foreign-born population - Ukraine (%)
Place of birth for the foreign-born population - Other Eastern Europe (%)
Place of birth for the foreign-born population - China (%)
Place of birth for the foreign-born population - Hong Kong (%)
Place of birth for the foreign-born population - Taiwan (%)
Place of birth for the foreign-born population - Japan (%)
Place of birth for the foreign-born population - Korea (%)
Place of birth for the foreign-born population - Other Eastern Asia (%)
Place of birth for the foreign-born population - Afghanistan (%)
Place of birth for the foreign-born population - Bangladesh (%)
Place of birth for the foreign-born population - India (%)
Place of birth for the foreign-born population - Iran (%)
Place of birth for the foreign-born population - Kazakhstan (%)
Place of birth for the foreign-born population - Nepal (%)
Place of birth for the foreign-born population - Pakistan (%)
Place of birth for the foreign-born population - Sri Lanka (%)
Place of birth for the foreign-born population - Uzbekistan (%)
Place of birth for the foreign-born population - Other South Central Asia (%)
Place of birth for the foreign-born population - Burma (%)
Place of birth for the foreign-born population - Cambodia (%)
Place of birth for the foreign-born population - Indonesia (%)
Place of birth for the foreign-born population - Laos (%)
Place of birth for the foreign-born population - Malaysia (%)
Place of birth for the foreign-born population - Philippines (%)
Place of birth for the foreign-born population - Singapore (%)
Place of birth for the foreign-born population - Thailand (%)
Place of birth for the foreign-born population - Vietnam (%)
Place of birth for the foreign-born population - Other South Eastern Asia (%)
Place of birth for the foreign-born population - Armenia (%)
Place of birth for the foreign-born population - Iraq (%)
Place of birth for the foreign-born population - Israel (%)
Place of birth for the foreign-born population - Jordan (%)
Place of birth for the foreign-born population - Kuwait (%)
Place of birth for the foreign-born population - Lebanon (%)
Place of birth for the foreign-born population - Saudi Arabia (%)
Place of birth for the foreign-born population - Syria (%)
Place of birth for the foreign-born population - Turkey (%)
Place of birth for the foreign-born population - Yemen (%)
Place of birth for the foreign-born population - Other Western Asia (%)
Place of birth for the foreign-born population - Eritrea (%)
Place of birth for the foreign-born population - Ethiopia (%)
Place of birth for the foreign-born population - Kenya (%)
Place of birth for the foreign-born population - Somalia (%)
Place of birth for the foreign-born population - Uganda (%)
Place of birth for the foreign-born population - Zimbabwe (%)
Place of birth for the foreign-born population - Other Eastern Africa (%)
Place of birth for the foreign-born population - Cameroon (%)
Place of birth for the foreign-born population - Congo (%)
Place of birth for the foreign-born population - Democratic Republic of Congo (Zaire) (%)
Place of birth for the foreign-born population - Other Middle Africa (%)
Place of birth for the foreign-born population - Egypt (%)
Place of birth for the foreign-born population - Morocco (%)
Place of birth for the foreign-born population - Sudan (%)
Place of birth for the foreign-born population - Other Northern Africa (%)
Place of birth for the foreign-born population - South Africa (%)
Place of birth for the foreign-born population - Other Southern Africa (%)
Place of birth for the foreign-born population - Cabo Verde (%)
Place of birth for the foreign-born population - Ghana (%)
Place of birth for the foreign-born population - Liberia (%)
Place of birth for the foreign-born population - Nigeria (%)
Place of birth for the foreign-born population - Senegal (%)
Place of birth for the foreign-born population - Sierra Leone (%)
Place of birth for the foreign-born population - Other Western Africa (%)
Place of birth for the foreign-born population - Australia (%)
Place of birth for the foreign-born population - New Zealand (%)
Place of birth for the foreign-born population - Fiji (%)
Place of birth for the foreign-born population - Micronesia (%)
Place of birth for the foreign-born population - Bahamas (%)
Place of birth for the foreign-born population - Barbados (%)
Place of birth for the foreign-born population - Cuba (%)
Place of birth for the foreign-born population - Dominica (%)
Place of birth for the foreign-born population - Dominican Republic (%)
Place of birth for the foreign-born population - Grenada (%)
Place of birth for the foreign-born population - Haiti (%)
Place of birth for the foreign-born population - Jamaica (%)
Place of birth for the foreign-born population - St. Vincent and the Grenadines (%)
Place of birth for the foreign-born population - Trinidad and Tobago (%)
Place of birth for the foreign-born population - West Indies (%)
Place of birth for the foreign-born population - Other Caribbean (%)
Place of birth for the foreign-born population - Belize (%)
Place of birth for the foreign-born population - Costa Rica (%)
Place of birth for the foreign-born population - El Salvador (%)
Place of birth for the foreign-born population - Guatemala (%)
Place of birth for the foreign-born population - Honduras (%)
Place of birth for the foreign-born population - Mexico (%)
Place of birth for the foreign-born population - Nicaragua (%)
Place of birth for the foreign-born population - Panama (%)
Place of birth for the foreign-born population - Other Central America (%)
Place of birth for the foreign-born population - Argentina (%)
Place of birth for the foreign-born population - Bolivia (%)
Place of birth for the foreign-born population - Brazil (%)
Place of birth for the foreign-born population - Chile (%)
Place of birth for the foreign-born population - Colombia (%)
Place of birth for the foreign-born population - Ecuador (%)
Place of birth for the foreign-born population - Guyana (%)
Place of birth for the foreign-born population - Peru (%)
Place of birth for the foreign-born population - Uruguay (%)
Place of birth for the foreign-born population - Venezuela (%)
Place of birth for the foreign-born population - Other South America (%)
Place of birth for the foreign-born population - Canada (%)
Place of birth for the foreign-born population - Other Northern America (%)
Place of birth for the foreign-born population - Other (%)
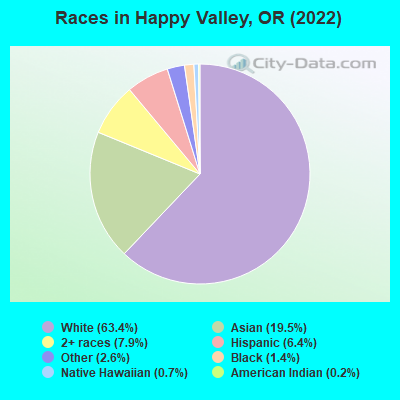
According to 2022 data, the most numerous races in Happy Valley, OR are White alone (15,547 residents), Hispanic (1,579 residents), and Two or more races (1,948 residents). 81.5% of Happy Valley residents speak English at home. 15.8% of Happy Valley, OR residents are foreign-born (11.6% born in Asia, 1.9% born in Latin America, 1.8% born in Europe), which is 43.2% greater than the foreign-born rate of 9.0% across the entire state of Oregon.
Race distribution in Happy Valley
2000 2022
2,857,616 83.5% White alone 275,314 8.0% Hispanic 100,333 2.9% Asian alone 82,733 2.4% Two or more races 53,325 1.6% Black alone 40,130 1.2% American Indian alone 7,398 0.2% Native Hawaiian and Other 4,550 0.1% Other race alone
3,037,571 71.6% White alone 609,538 14.4% Hispanic 252,744 6.0% Two or more races 191,283 4.5% Asian alone 78,228 1.8% Black alone 29,399 0.7% American Indian alone 25,731 0.6% Other race alone 15,643 0.4% Native Hawaiian and Other
Income and house value in Happy Valley Median household income in 2022 $122,873 White non-Hispanic householdersover $200,000 Black householders$167,038 Asian householders$115,139 Some other race householders$120,530 Two or more races householders$153,820 Hispanic or Latino race householdersMedian 2022 house value $754,038 White Non-Hispanic householders$542,387 Black or African American householdersover $1,000,000 American Indian or Alaska Native householders $613,500 Asian householders$662,917 Native Hawaiian and other Pacific Islander householders$923,986 Two or more races householders$843,713 Hispanic or Latino householders
Median age by race in Happy Valley
43.5 Median age for White residents43.4 43.7 35.4 Median age for Black or African American residents43.7 44.0 5.2 Median age for American Indian / Alaska Native residents-600,368,323.5 -684,287,811.4 40.6 Median age for Asian residents39.1 39.8 -764,705,881.6 Median age for Native Hawaiian / Pacific Islander residents-764,119,600.6 -774,891,774.1 18.2 Median age for Other race residents20.6 17.2 29.1 Median age for Two or more races residents28.1 31.6 44.3 Median age for White alone residents43.5 44.9 35.6 Median age for Hispanic or Latino residents39.1 35.5
Owner/renter occupied households by race in Happy Valley
House owners and renters - White residents 4,946 82.4% Owner occupied1,058 17.6% Renter occupiedHouse owners and renters - Black or African American residents 100 100.0% Owner occupiedHouse owners and renters - American Indian / Alaska Native residents 7 100.0% Owner occupiedHouse owners and renters - Asian residents 1,376 96.7% Owner occupied47 3.3% Renter occupiedHouse owners and renters - Native Hawaiian / Pacific Islander residents 80 100.0% Owner occupiedHouse owners and renters - Other race residents 61 62.6% Owner occupied37 37.4% Renter occupiedHouse owners and renters - Two or more races residents 344 60.2% Owner occupied228 39.8% Renter occupiedHouse owners and renters - White alone residents 4,873 82.4% Owner occupied1,042 17.6% Renter occupiedHouse owners and renters - Hispanic or Latino residents 276 85.5% Owner occupied47 14.5% Renter occupied
Language usage in Happy Valley
English speakers - Total 81.5% of residents of Happy Valley speak English at home.
2.8% of residents speak Spanish at home 519 79.4% Speak English very well135 20.6% Speak English less than very well16.1% of residents speak other language at home 2,185 57.7% Speak English very well1,600 42.3% Speak English less than very well
English speakers - Born in the United States 90.7% of residents of Happy Valley speak English at home.
2.8% of residents speak Spanish at home 222 94.5% Speak English very well13 5.5% Speak English less than very well7.3% of residents speak other language at home 621 100.0% Speak English very well
English speakers - Native, born elsewhere 62.6% of residents of Happy Valley speak English at home.
62.0% of residents speak other language at home 222 100.0% Speak English very well
English speakers - Foreign-born 22.3% of residents of Happy Valley speak English at home.
7.9% of residents speak Spanish at home 188 66.9% Speak English very well93 33.1% Speak English less than very well74.4% of residents speak other language at home 982 36.9% Speak English very well1,677 63.1% Speak English less than very well
White (Caucasian) - Speak only English Native:
97.7% (14,324)Foreign-born:
44.5% (268)
White (Caucasian) - Speak another language Native:
2.4% (359)Foreign-born:
55.3% (333)
Black or African American - Speak only English Native:
99.2% (324)Foreign-born:
100.0% (16)
Asian - Speak only English Native:
60.9% (1,270)Foreign-born:
12.8% (333)
Asian - Speak another language Native:
36.9% (769)Foreign-born:
88.0% (2,289)
Other race - Speak another language Native:
4.1% (24)Foreign-born:
89.1% (53)
Two or more races - Speak only English Native:
84.7% (2,095)Foreign-born:
3.6% (16)
Two or more races - Speak another language Native:
15.3% (380)Foreign-born:
84.8% (369)
White alone - Speak only English Native:
97.6% (14,025)Foreign-born:
42.9% (281)
White alone - Speak another language Native:
2.4% (339)Foreign-born:
56.9% (372)
Hispanic or Latino - Speak another language Native:
21.2% (226)Foreign-born:
83.8% (329)
Foreign-born residents in Happy Valley 3,881 residents are foreign born (11.6% Asia , 1.9% Latin America , 1.8% Europe ).
This city:
15.8%Oregon:
9.8%
Marital status for residents in Happy Valley Marital status - White (Caucasian) population 15 years and over
Males 25.9% Never married62.7% Now married0.5% Separated1.8% Widowed8.9% DivorcedFemales 21.2% Never married57.3% Now married0.0% Separated5.9% Widowed15.6% DivorcedWomen who gave birth in the past 12 months Now married:
100.0% (70)Unmarried:
0.0% (0)
Women who did not give birth in the past 12 months Now married:
46.7% (1,576)Unmarried:
53.3% (1,797)
Marital status - Black or African American population 15 years and over
Males 53.4% Never married46.6% Now married0.0% Separated0.0% Widowed0.0% DivorcedFemales 46.5% Never married31.8% Now married0.0% Separated0.0% Widowed21.7% DivorcedWomen who did not give birth in the past 12 months Now married:
0.0% (0)Unmarried:
100.0% (94)
Marital status - Asian population 15 years and over
Males 23.9% Never married61.5% Now married0.0% Separated11.1% Widowed3.5% DivorcedFemales 24.9% Never married71.3% Now married0.0% Separated1.7% Widowed2.1% DivorcedWomen who gave birth in the past 12 months Now married:
100.0% (25)Unmarried:
0.0% (0)
Women who did not give birth in the past 12 months Now married:
64.4% (714)Unmarried:
35.6% (395)
Marital status - Other race population 15 years and over
Males 69.6% Never married30.4% Now married0.0% Separated0.0% Widowed0.0% DivorcedFemales 34.1% Never married47.3% Now married0.0% Separated0.0% Widowed18.6% DivorcedWomen who did not give birth in the past 12 months Now married:
58.1% (83)Unmarried:
41.9% (60)
Marital status - Two or more races population 15 years and over
Males 52.0% Never married41.5% Now married0.0% Separated1.1% Widowed5.5% DivorcedFemales 51.8% Never married32.3% Now married0.0% Separated9.7% Widowed6.2% DivorcedWomen who gave birth in the past 12 months Now married:
0.0% (0)Unmarried:
100.0% (2)
Women who did not give birth in the past 12 months Now married:
24.9% (201)Unmarried:
75.1% (605)
Marital status - White alone, not Hispanic / Latino population 15 years and over
Males 25.8% Never married62.6% Now married0.6% Separated1.9% Widowed9.2% DivorcedFemales 20.7% Never married57.3% Now married0.0% Separated6.0% Widowed16.0% DivorcedWomen who gave birth in the past 12 months Now married:
100.0% (71)Unmarried:
0.0% (0)
Women who did not give birth in the past 12 months Now married:
46.2% (1,516)Unmarried:
53.8% (1,767)
Marital status - Hispanic or Latino population 15 years and over
Males 33.9% Never married61.3% Now married0.0% Separated0.0% Widowed4.8% DivorcedFemales 32.9% Never married49.2% Now married0.0% Separated17.9% Widowed0.0% DivorcedWomen who gave birth in the past 12 months Now married:
0.0% (0)Unmarried:
100.0% (2)
Women who did not give birth in the past 12 months Now married:
48.7% (180)Unmarried:
51.3% (189)
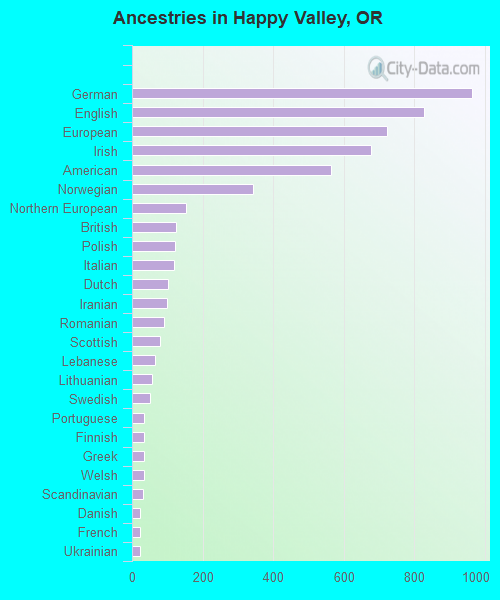
Ancestries in Happy Valley
963 9.6% German827 8.2% English721 7.2% European676 6.7% Irish563 5.6% American344 3.4% Norwegian154 1.5% Northern European125 1.2% British121 1.2% Polish118 1.2% Italian101 1.0% Dutch98 1.0% Iranian92 0.9% Romanian79 0.8% Scottish66 0.7% Lebanese58 0.6% Lithuanian50 0.5% Swedish35 0.3% Portuguese33 0.3% Finnish33 0.3% Greek33 0.3% Welsh32 0.3% Scandinavian24 0.2% Danish24 0.2% French23 0.2% Ukrainian22 0.2% Croatian21 0.2% Scotch-Irish19 0.2% Slovene19 0.2% Swiss14 0.1% Syrian14 0.1% Canadian10 0.10% Czech10 0.10% Russian8 0.08% Iraqi6 0.06% Kenyan5 0.05% African
Geographical mobility in Happy Valley Same house 1 year ago 13,915 88.0% White (Caucasian)263 78.4% Black or African American7 12.8% American Indian / Alaska Native4,473 92.2% Asian105 100.0% Native Hawaiian / Pacific Islander762 100.0% Other race2,449 79.5% Two or more races13,649 88.0% White alone, not Hispanic / Latino1,443 90.7% Hispanic or LatinoMoved within same county 487 3.1% White / Caucasian35 10.4% Black or African American135 2.8% Asian214 6.9% Two or more races477 3.1% White alone, not Hispanic / Latino89 5.6% Hispanic or LatinoMoved within same state 1,124 7.1% White / Caucasian25 7.5% Black or African American61 100.0% American Indian / Alaska Native176 3.6% Asian209 6.8% Two or more races1,143 7.4% White alone, not Hispanic / Latino22 1.4% Hispanic or LatinoMoved from different state 357 2.3% White / Caucasian1 0.3% Black or African American161 5.2% Two or more races313 2.0% White alone, not Hispanic / Latino54 3.4% Hispanic or LatinoMoved from abroad 68 0.4% White11 0.2% Asian18 0.6% Two or more races27 0.2% White alone, not Hispanic / Latino
Children Nativity (place of birth) in Happy Valley
Children under 6 years - Living with two parents Both parents native 888 100.0% NativeBoth parents foreign-born 133 100.0% NativeOne native, one foreign-born parent 80 100.0% NativeChildren under 6 years - Living with one parent Native parent 176 100.0% NativeChildren 6 to 17 years - Living with two parents Both parents native 2,476 100.0% NativeBoth parents foreign-born 244 88.4% Native32 11.6% Foreign-bornOne native, one foreign-born parent 440 95.7% Native20 4.3% Foreign-bornChildren 6 to 17 years - Living with one parent Native parent 1,568 100.0% NativeForeign-born parent 205 47.4% Native227 52.6% Foreign-born
Grandparents responsible for own grandchildren in Happy Valley
Grandparents (30 to 59 years) White / Caucasian 3 8.3% Responsible for grandchildren32 91.7% Not responsible for grandchildrenAsian 34 100.0% Not responsible for grandchildrenTwo or more races 61 100.0% Not responsible for grandchildrenWhite alone, not Hispanic / Latino 3 14.2% Responsible for grandchildren18 85.8% Not responsible for grandchildrenHispanic or Latino 9 100.0% Not responsible for grandchildrenGrandparents (60 years and over) White / Caucasian 54 28.1% Responsible for grandchildren138 71.9% Not responsible for grandchildrenAsian 175 100.0% Not responsible for grandchildrenWhite alone, not Hispanic / Latino 54 26.9% Responsible for grandchildren146 73.1% Not responsible for grandchildren