Races in Griffith, Indiana (IN) Detailed Stats
Ancestries, Foreign-born residents, place of birth
Settings
X


Recent posts about races in Griffith, Indiana on our local forum with over 2,400,000 registered users:
 | Is buying a house in Hammond safe? (12 replies) |
| Any nice parts of NWI? (16 replies) |
| Hammond housing prices (11 replies) |
| Illinois To NWI Migration (361 replies) |
| Merrillville, Griffith, Cedar Lake or Lowell? (7 replies) |
| Highland (155 replies) |
Latest news about races in Griffith, IN collected exclusively by city-data.com from local newspapers, TV, and radio stations
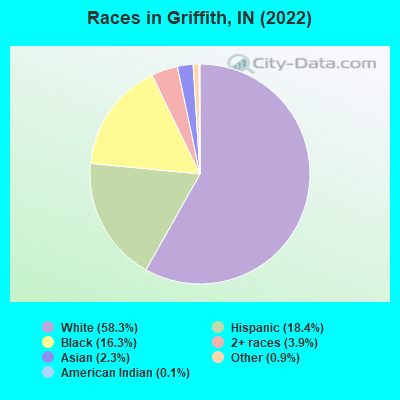
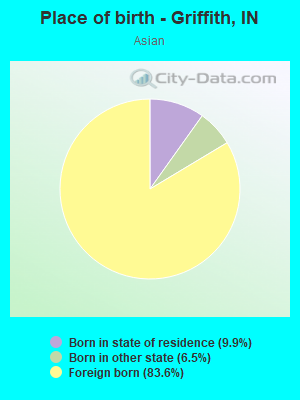
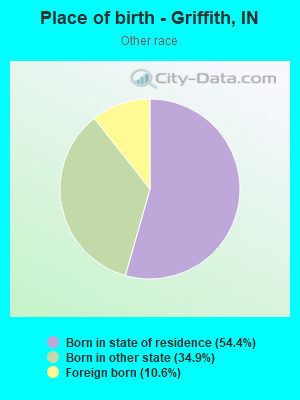
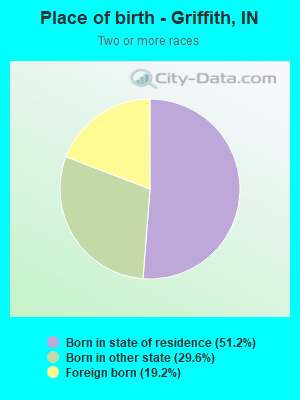
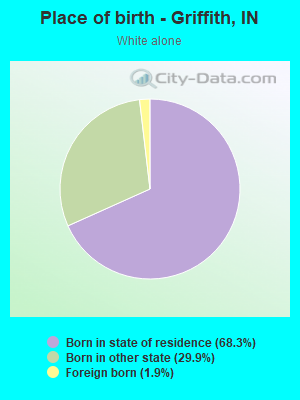
According to 2022 data, the most numerous races in Griffith, IN are White alone (9,470 residents), Black alone (2,641 residents), and Hispanic (2,986 residents). 86.6% of Griffith residents speak English at home. 6.3% of Griffith, IN residents are foreign-born (2.9% born in Latin America, 1.8% born in Asia, 0.8% born in Europe), which is 5.3% greater than the foreign-born rate of 6.0% across the entire state of Indiana.
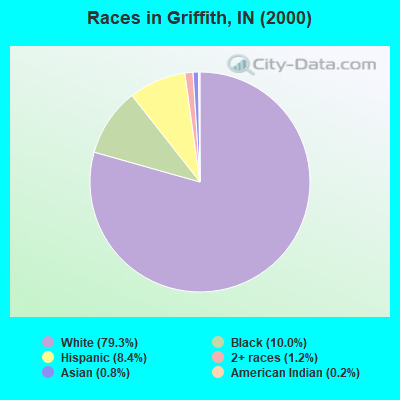
Race distribution in Griffith
2000
2022

- 13,73879.3%White alone
- 1,73410.0%Black alone
- 1,4618.4%Hispanic
- 2011.2%Two or more races
- 1360.8%Asian alone
- 420.2%American Indian alone
- 170.10%Other race alone
- 50.03%Native Hawaiian and Other
Pacific Islander alone
-
- 9,47058.3%White alone
- 2,98618.4%Hispanic
- 2,64116.3%Black alone
- 6303.9%Two or more races
- 3742.3%Asian alone
- 1540.9%Other race alone
- 210.1%American Indian alone
2000
2022
-
- 5,219,37385.8%White alone
- 505,4628.3%Black alone
- 214,5363.5%Hispanic
- 61,1151.0%Two or more races
- 58,4241.0%Asian alone
- 13,6540.2%American Indian alone
- 6,3480.1%Other race alone
- 1,5730.03%Native Hawaiian and Other
Pacific Islander alone

-
- 5,192,45576.0%White alone
- 628,0549.2%Black alone
- 534,5287.8%Hispanic
- 263,2423.9%Two or more races
- 172,8802.5%Asian alone
- 33,4670.5%Other race alone
- 5,8660.09%American Indian alone
- 2,5450.04%Native Hawaiian and Other
Pacific Islander alone

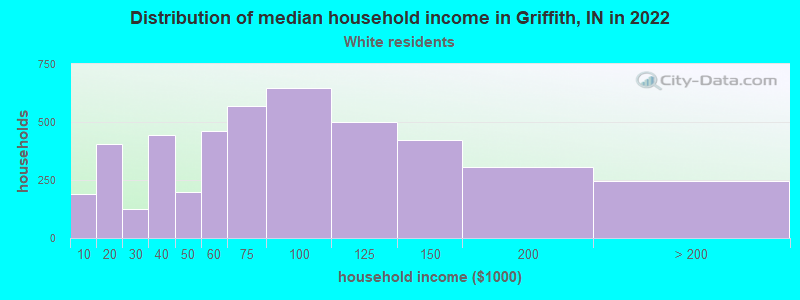
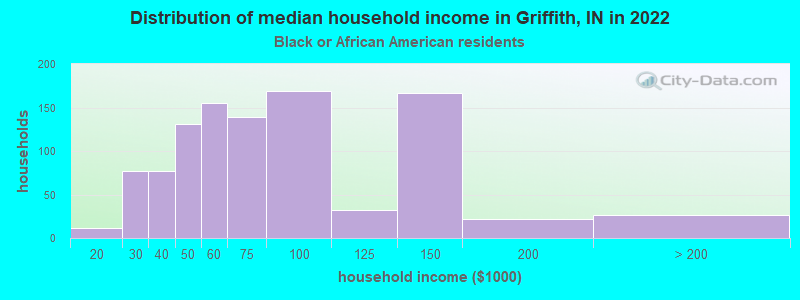
Income and house value in Griffith
- Median household income in 2022
- $72,584White non-Hispanic householders
- $65,042Black householders
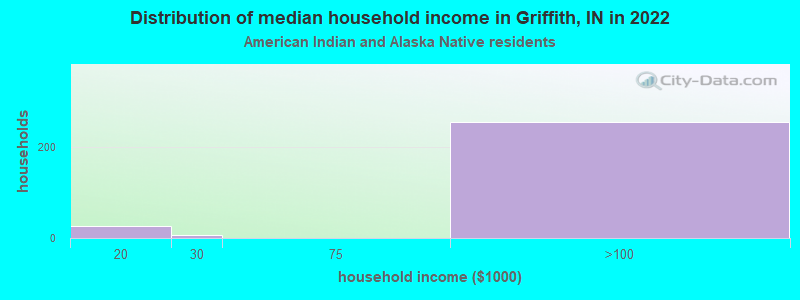
- $52,003American Indian and Alaska Native householders
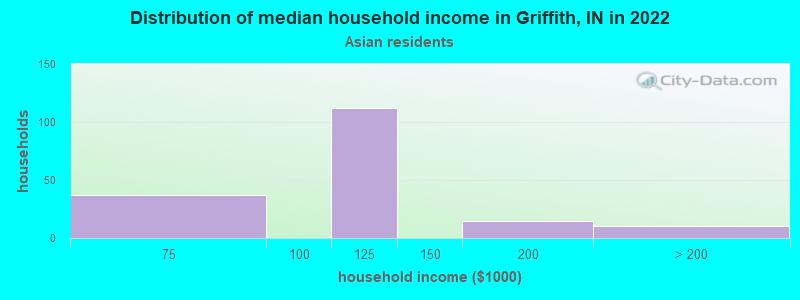
- $109,718Asian householders
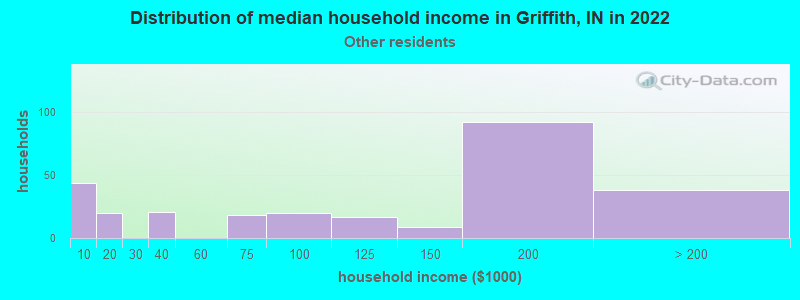
- $112,670Some other race householders
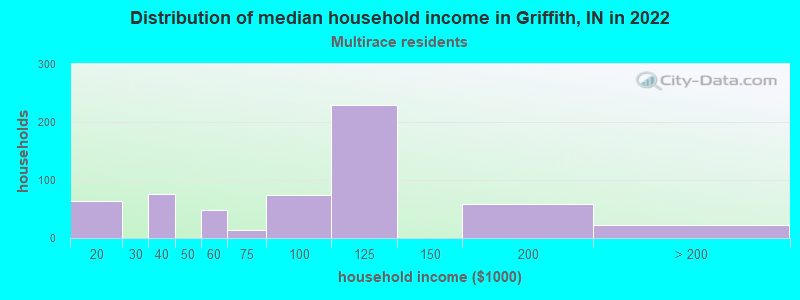
- $99,712Two or more races householders
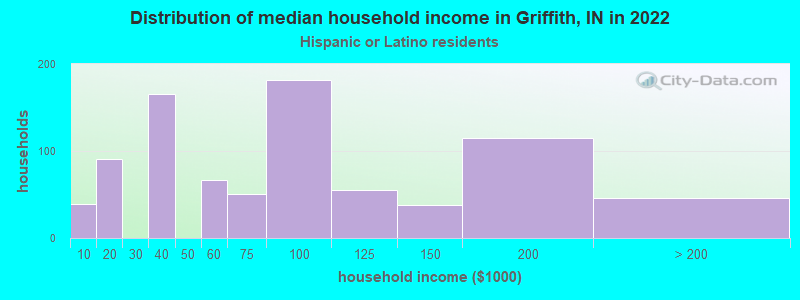
- $75,005Hispanic or Latino race householders
- Median 2022 house value
- $211,585White Non-Hispanic householders
- $192,527Black or African American householders
- $184,748Asian householders
- $165,301Native Hawaiian and other Pacific Islander householders
- $224,615Some other race householders
- $184,748Two or more races householders
- $213,141Hispanic or Latino householders
Household income for White non-Hispanic householders
Household income for Black householders
Household income for American Indian and Alaska Native householders
Household income for Asian householders
Household income for Some other race householders
Household income for Two or more races householders
Household income for Hispanic or Latino race householders
Median age by race in Griffith
- 43.9Median age for White residents
- 44.3Males
- 42.0Females
- 28.5Median age for Black or African American residents
- 18.8Males
- 37.5Females
- 50.4Median age for American Indian / Alaska Native residents
- -531,041,069.2Males
- 50.3Females
- 42.2Median age for Asian residents
- 67.1Males
- 42.0Females
- -664,335,663.7Median age for Native Hawaiian / Pacific Islander residents
- -644,025,156.6Males
- -664,437,011.6Females
- 33.6Median age for Other race residents
- 36.1Males
- 33.8Females
- 38.5Median age for Two or more races residents
- 30.7Males
- 37.7Females
- 44.4Median age for White alone residents
- 45.5Males
- 44.5Females
- 32.7Median age for Hispanic or Latino residents
- 31.2Males
- 32.9Females
Owner/renter occupied households by race in Griffith
- House owners and renters - White residents
- 3,77284.8%Owner occupied
- 67715.2%Renter occupied
- House owners and renters - Black or African American residents
- 17315.8%Owner occupied
- 92584.2%Renter occupied
- House owners and renters - American Indian / Alaska Native residents
- 19195.0%Owner occupied
- 105.0%Renter occupied
- House owners and renters - Asian residents
- 165100.0%Owner occupied
- House owners and renters - Other race residents
- 18771.6%Owner occupied
- 7428.4%Renter occupied
- House owners and renters - Two or more races residents
- 52693.1%Owner occupied
- 396.9%Renter occupied
- House owners and renters - White alone residents
- 3,71286.0%Owner occupied
- 60414.0%Renter occupied
- House owners and renters - Hispanic or Latino residents
- 67975.2%Owner occupied
- 22424.8%Renter occupied
Language usage in Griffith
- English speakers - Total
- 86.6% of residents of Griffith speak English at home.
- 9.0% of residents speak Spanish at home
- 1,20188.6%Speak English very well
- 15411.4%Speak English less than very well
- 4.4% of residents speak other language at home
- 43064.6%Speak English very well
- 23635.4%Speak English less than very well
- English speakers - Born in the United States
- 92.7% of residents of Griffith speak English at home.
- 6.1% of residents speak Spanish at home
- 29387.2%Speak English very well
- 4312.8%Speak English less than very well
- 0.3% of residents speak other language at home
- 16100.0%Speak English very well
- English speakers - Native, born elsewhere
- 0.0% of residents of Griffith speak English at home.
- 120.0% of residents speak Spanish at home
- 60100.0%Speak English very well
- English speakers - Foreign-born
- 3.8% of residents of Griffith speak English at home.
- 51.5% of residents speak Spanish at home
- 42282.1%Speak English very well
- 9217.9%Speak English less than very well
- 47.0% of residents speak other language at home
- 25654.6%Speak English very well
- 21345.4%Speak English less than very well
White (Caucasian) - Speak only English
| Native: | 96.4% (8,796) |
| Foreign-born: | 18.7% (26) |
White (Caucasian) - Speak another language
| Native: | 3.7% (336) |
| Foreign-born: | 81.1% (113) |
Black or African American - Speak another language
| Native: | 0.3% (8) |
| Foreign-born: | 70.0% (17) |
Asian - Speak another language
| Native: | 4.7% (1) |
| Foreign-born: | 92.9% (290) |
Other race - Speak another language
| Native: | 25.2% (211) |
| Foreign-born: | 97.6% (106) |
Two or more races - Speak another language
| Native: | 31.3% (519) |
| Foreign-born: | 100.0% (444) |
White alone - Speak only English
| Native: | 96.6% (8,441) |
| Foreign-born: | 14.4% (25) |
White alone - Speak another language
| Native: | 3.2% (280) |
| Foreign-born: | 89.3% (155) |
Hispanic or Latino - Speak another language
| Native: | 30.8% (710) |
| Foreign-born: | 99.9% (479) |
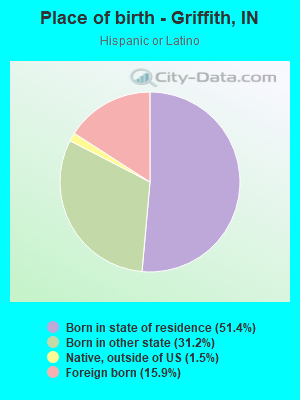
Foreign-born residents in Griffith
1,029 residents are foreign born (2.9% Latin America, 1.8% Asia, 0.8% Europe).
| This city: | 6.3% |
| Indiana: | 5.6% |

Marital status for residents in Griffith
Marital status - White (Caucasian) population 15 years and over
- Males
- 28.6%Never married
- 48.9%Now married
- 0.3%Separated
- 4.4%Widowed
- 17.7%Divorced
- Females
- 23.9%Never married
- 50.6%Now married
- 0.9%Separated
- 9.7%Widowed
- 14.9%Divorced
Women who gave birth in the past 12 months
| Now married: | 24.9% (41) |
| Unmarried: | 75.1% (125) |
Women who did not give birth in the past 12 months
| Now married: | 50.0% (1,039) |
| Unmarried: | 50.0% (1,037) |
Marital status - Black or African American population 15 years and over
- Males
- 71.8%Never married
- 24.1%Now married
- 2.6%Separated
- 0.3%Widowed
- 1.2%Divorced
- Females
- 55.5%Never married
- 22.9%Now married
- 4.6%Separated
- 4.1%Widowed
- 12.9%Divorced
Women who gave birth in the past 12 months
| Now married: | 42.6% (53) |
| Unmarried: | 57.4% (71) |
Women who did not give birth in the past 12 months
| Now married: | 19.0% (132) |
| Unmarried: | 81.0% (561) |
Marital status - American Indian / Alaska Native population 15 years and over
- Males
- 100.0%Never married
- 0.0%Now married
- 0.0%Separated
- 0.0%Widowed
- 0.0%Divorced
- Females
- 4.5%Never married
- 0.0%Now married
- 0.0%Separated
- 0.0%Widowed
- 95.5%Divorced
Women who did not give birth in the past 12 months
| Now married: | 0.0% (0) |
| Unmarried: | 100.0% (14) |
Marital status - Asian population 15 years and over
- Males
- 0.0%Never married
- 100.0%Now married
- 0.0%Separated
- 0.0%Widowed
- 0.0%Divorced
- Females
- 7.7%Never married
- 92.3%Now married
- 0.0%Separated
- 0.0%Widowed
- 0.0%Divorced
Women who did not give birth in the past 12 months
| Now married: | 98.5% (136) |
| Unmarried: | 1.5% (2) |
Marital status - Other race population 15 years and over
- Males
- 31.1%Never married
- 68.9%Now married
- 0.0%Separated
- 0.0%Widowed
- 0.0%Divorced
- Females
- 38.5%Never married
- 61.5%Now married
- 0.0%Separated
- 0.0%Widowed
- 0.0%Divorced
Women who did not give birth in the past 12 months
| Now married: | 54.1% (166) |
| Unmarried: | 45.9% (141) |
Marital status - Two or more races population 15 years and over
- Males
- 24.3%Never married
- 50.1%Now married
- 0.0%Separated
- 8.5%Widowed
- 17.1%Divorced
- Females
- 50.9%Never married
- 35.3%Now married
- 0.0%Separated
- 4.3%Widowed
- 9.5%Divorced
Women who did not give birth in the past 12 months
| Now married: | 24.8% (179) |
| Unmarried: | 75.2% (544) |
Marital status - White alone, not Hispanic / Latino population 15 years and over
- Males
- 28.3%Never married
- 50.6%Now married
- 0.3%Separated
- 4.2%Widowed
- 16.5%Divorced
- Females
- 21.6%Never married
- 50.9%Now married
- 1.0%Separated
- 10.4%Widowed
- 16.0%Divorced
Women who gave birth in the past 12 months
| Now married: | 17.4% (27) |
| Unmarried: | 82.6% (129) |
Women who did not give birth in the past 12 months
| Now married: | 51.9% (982) |
| Unmarried: | 48.1% (911) |
Marital status - Hispanic or Latino population 15 years and over
- Males
- 33.1%Never married
- 49.9%Now married
- 0.0%Separated
- 4.7%Widowed
- 12.3%Divorced
- Females
- 43.5%Never married
- 41.8%Now married
- 0.0%Separated
- 2.4%Widowed
- 12.4%Divorced
Women who gave birth in the past 12 months
| Now married: | 100.0% (17) |
| Unmarried: | 0.0% (0) |
Women who did not give birth in the past 12 months
| Now married: | 39.8% (408) |
| Unmarried: | 60.2% (616) |
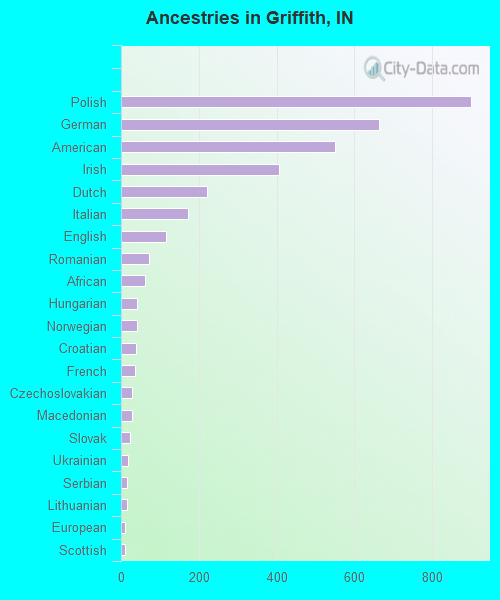
Ancestries in Griffith

- 90111.7%Polish
- 6648.7%German
- 5497.2%American
- 4065.3%Irish
- 2202.9%Dutch
- 1712.2%Italian
- 1151.5%English
- 710.9%Romanian
- 610.8%African
- 420.5%Hungarian
- 400.5%Norwegian
- 380.5%Croatian
- 370.5%French
- 280.4%Czechoslovakian
- 270.4%Macedonian
- 220.3%Slovak
- 170.2%Ukrainian
- 160.2%Serbian
- 150.2%Lithuanian
- 110.1%European
- 100.1%Scottish
- 80.1%Czech
- 80.1%French Canadian
- 70.09%Swiss
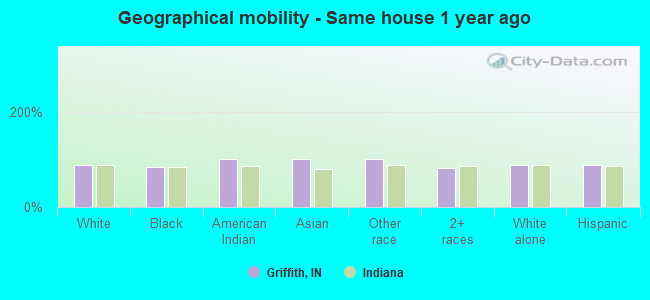
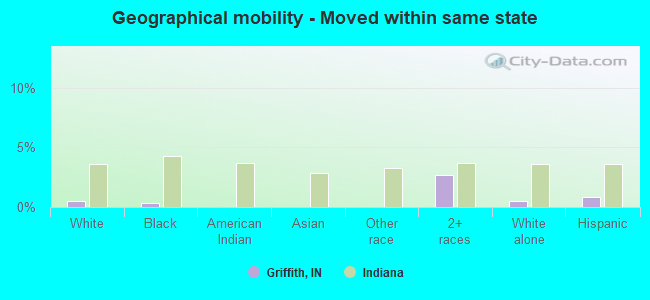
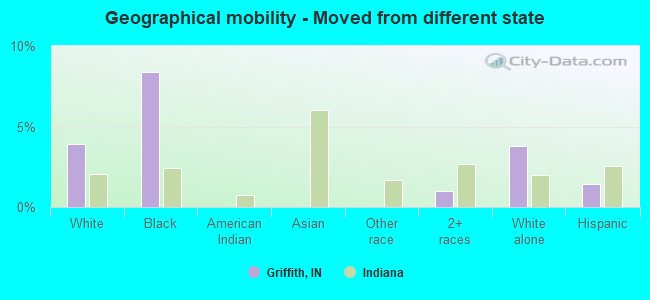
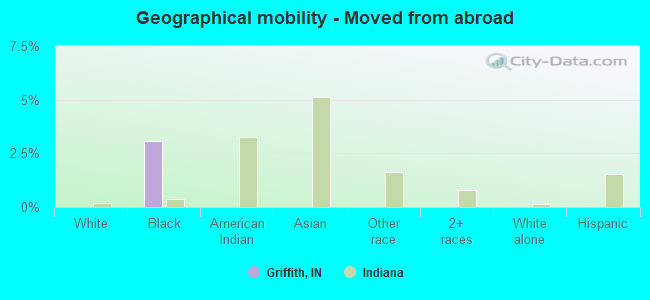
Geographical mobility in Griffith

- Same house 1 year ago
- 8,55489.2%White (Caucasian)
- 2,13082.5%Black or African American
- 294100.0%American Indian / Alaska Native
- 37099.5%Asian
- 990100.0%Other race
- 1,91882.1%Two or more races
- 8,25988.9%White alone, not Hispanic / Latino
- 2,62388.4%Hispanic or Latino
-
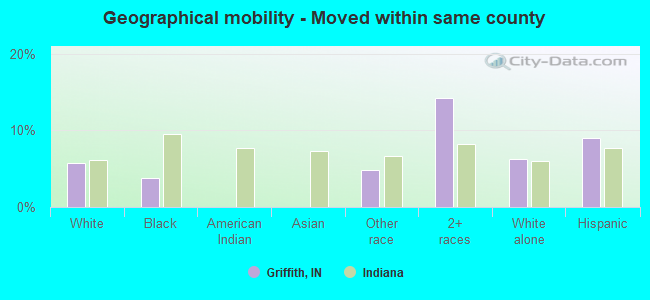
- Moved within same county
- 5565.8%White / Caucasian
- 983.8%Black or African American
- 484.9%Other race
- 33314.3%Two or more races
- 5826.3%White alone, not Hispanic / Latino
- 2679.0%Hispanic or Latino
-
- Moved within same state
- 470.5%White / Caucasian
- 90.3%Black or African American
- 632.7%Two or more races
- 480.5%White alone, not Hispanic / Latino
- 260.9%Hispanic or Latino
-
- Moved from different state
- 3783.9%White / Caucasian
- 2168.4%Black or African American
- 231.0%Two or more races
- 3523.8%White alone, not Hispanic / Latino
- 421.4%Hispanic or Latino
-
- Moved from abroad
- 803.1%Black or African American
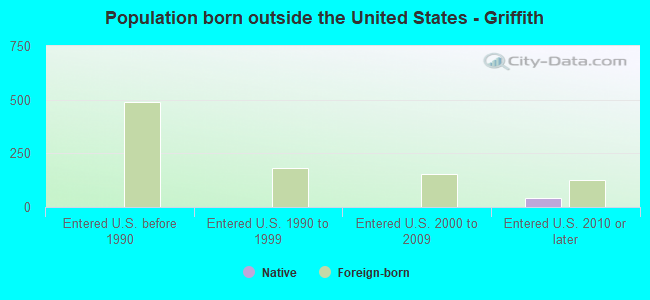
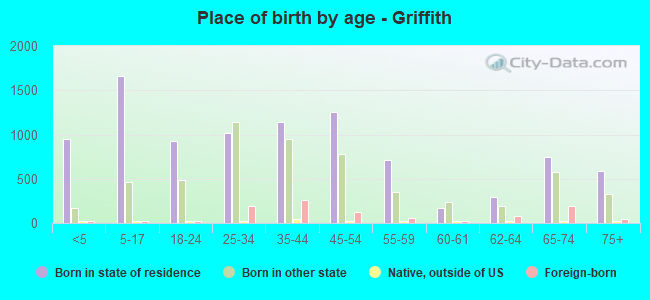
Children Nativity (place of birth) in Griffith
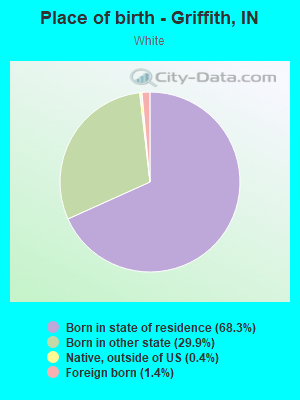
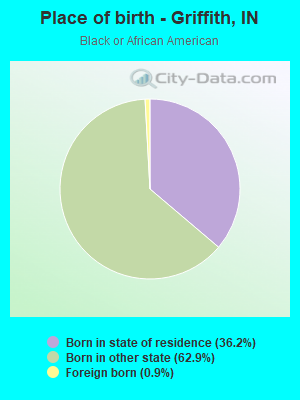
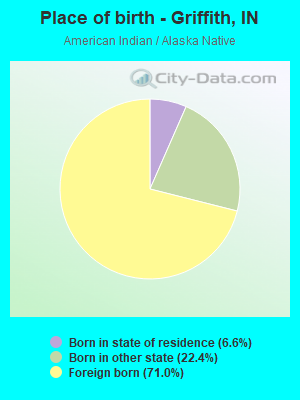
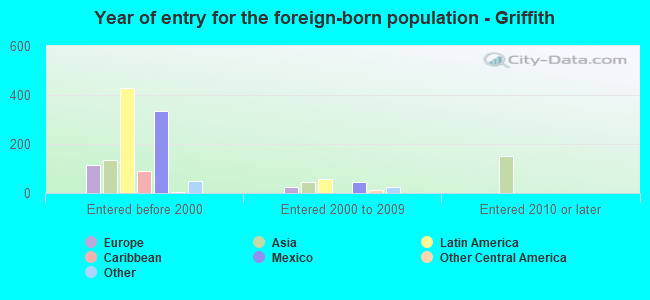
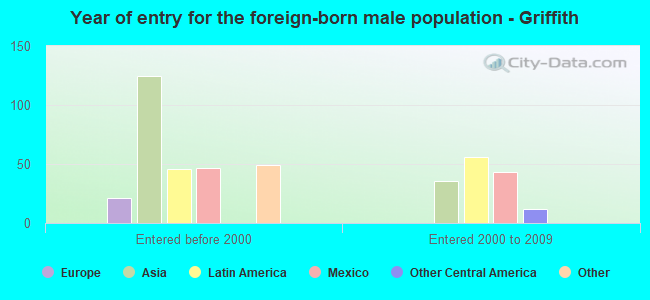
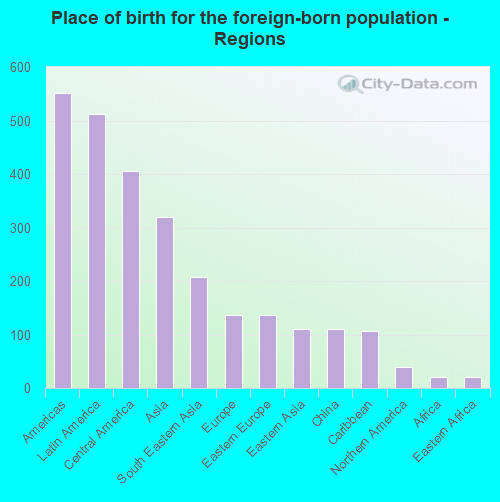
Place of birth for residents in Griffith
![Place of birth for the foreign-born population - Regions]()
- 552Americas
- 513Latin America
- 406Central America
- 319Asia
- 207South Eastern Asia
- 137Europe
- 137Eastern Europe
- 111Eastern Asia
- 111China
- 106Caribbean
- 39Northern America
- 20Africa
- 20Eastern Africa
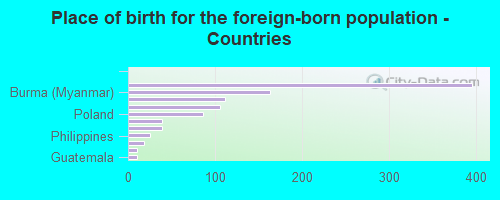
![Place of birth for the foreign-born population - Countries]()
- 395Mexico
- 163Burma (Myanmar)
- 111China
- 106Dominican Republic
- 86Poland
- 39North Macedonia (Macedonia)
- 39Canada
- 25Philippines
- 18Vietnam
- 10Croatia
- 10Guatemala
Grandparents responsible for own grandchildren in Griffith
Zip codes: 46319.