Races in Grapevine, Texas (TX) Detailed Stats
Data:
Races - White alone (%)
Races - White alone (% change since 2000)
Races - Black alone (%)
Races - Black alone (% change since 2000)
Races - American Indian alone (%)
Races - American Indian alone (% change since 2000)
Races - Asian alone (%)
Races - Asian alone (% change since 2000)
Races - Hispanic (%)
Races - Hispanic (% change since 2000)
Races - Native Hawaiian and Other Pacific Islander alone (%)
Races - Native Hawaiian and Other Pacific Islander alone (% change since 2000)
Races - Two or more races(%)
Races - Two or more races(% change since 2000)
Races - Other race alone (%)
Races - Other race alone (% change since 2000)
Racial diversity
Place of birth - Born in state of residence (%)
Place of birth - Born in state of residence (%) - White
Place of birth - Born in state of residence (%) - Black or African American
Place of birth - Born in state of residence (%) - Asian
Place of birth - Born in state of residence (%) - Hispanic or Latino
Place of birth - Born in state of residence (%) - American Indian and Alaska Native
Place of birth - Born in state of residence (%) - Multirace
Place of birth - Born in state of residence (%) - Other Race
Place of birth - Born in other state (%)
Place of birth - Born in other state (%) - White
Place of birth - Born in other state (%) - Black or African American
Place of birth - Born in other state (%) - Asian
Place of birth - Born in other state (%) - Hispanic or Latino
Place of birth - Born in other state (%) - American Indian and Alaska Native
Place of birth - Born in other state (%) - Multirace
Place of birth - Born in other state (%) - Other Race
Place of birth - Native, outside of US (%)
Place of birth - Native, outside of US (%) - White
Place of birth - Native, outside of US (%) - Black or African American
Place of birth - Native, outside of US (%) - Asian
Place of birth - Native, outside of US (%) - Hispanic or Latino
Place of birth - Native, outside of US (%) - American Indian and Alaska Native
Place of birth - Native, outside of US (%) - Multirace
Place of birth - Native, outside of US (%) - Other Race
Place of birth - Foreign born (%)
Place of birth - Foreign born (%) - White
Place of birth - Foreign born (%) - Black or African American
Place of birth - Foreign born (%) - Asian
Place of birth - Foreign born (%) - Hispanic or Latino
Place of birth - Foreign born (%) - American Indian and Alaska Native
Place of birth - Foreign born (%) - Multirace
Place of birth - Foreign born (%) - Other Race
Residents speaking English at home (%)
Residents speaking English at home - Born in the United States (%)
Residents speaking English at home - Native, born elsewhere (%)
Residents speaking English at home - Foreign born (%)
Residents speaking Spanish at home (%)
Residents speaking Spanish at home - Born in the United States (%)
Residents speaking Spanish at home - Native, born elsewhere (%)
Residents speaking Spanish at home - Foreign born (%)
Residents speaking other language at home (%)
Residents speaking other language at home - Born in the United States (%)
Residents speaking other language at home - Native, born elsewhere (%)
Residents speaking other language at home - Foreign born (%)
Marital status - Never married (%)
Marital status - Now married (%)
Marital status - Separated (%)
Marital status - Widowed (%)
Marital status - Divorced (%)
Ancestries Reported - Arab (%)
Ancestries Reported - Czech (%)
Ancestries Reported - Danish (%)
Ancestries Reported - Dutch (%)
Ancestries Reported - English (%)
Ancestries Reported - French (%)
Ancestries Reported - French Canadian (%)
Ancestries Reported - German (%)
Ancestries Reported - Greek (%)
Ancestries Reported - Hungarian (%)
Ancestries Reported - Irish (%)
Ancestries Reported - Italian (%)
Ancestries Reported - Lithuanian (%)
Ancestries Reported - Norwegian (%)
Ancestries Reported - Polish (%)
Ancestries Reported - Portuguese (%)
Ancestries Reported - Russian (%)
Ancestries Reported - Scotch-Irish (%)
Ancestries Reported - Scottish (%)
Ancestries Reported - Slovak (%)
Ancestries Reported - Subsaharan African (%)
Ancestries Reported - Swedish (%)
Ancestries Reported - Swiss (%)
Ancestries Reported - Ukrainian (%)
Ancestries Reported - United States (%)
Ancestries Reported - Welsh (%)
Ancestries Reported - West Indian (%)
Ancestries Reported - Other (%)
Geographical mobility - Same house 1 year ago (%)
Geographical mobility - Same house 1 year ago (%) - White
Geographical mobility - Same house 1 year ago (%) - Black or African American
Geographical mobility - Same house 1 year ago (%) - Asian
Geographical mobility - Same house 1 year ago (%) - Hispanic or Latino
Geographical mobility - Same house 1 year ago (%) - American Indian and Alaska Native
Geographical mobility - Same house 1 year ago (%) - Multirace
Geographical mobility - Same house 1 year ago (%) - Other Race
Geographical mobility - Moved within same county (%)
Geographical mobility - Moved within same county (%) - White
Geographical mobility - Moved within same county (%) - Black or African American
Geographical mobility - Moved within same county (%) - Asian
Geographical mobility - Moved within same county (%) - Hispanic or Latino
Geographical mobility - Moved within same county (%) - American Indian and Alaska Native
Geographical mobility - Moved within same county (%) - Multirace
Geographical mobility - Moved within same county (%) - Other Race
Geographical mobility - Moved from different county within same state (%)
Geographical mobility - Moved from different county within same state (%) - White
Geographical mobility - Moved from different county within same state (%) - Black or African American
Geographical mobility - Moved from different county within same state (%) - Asian
Geographical mobility - Moved from different county within same state (%) - Hispanic or Latino
Geographical mobility - Moved from different county within same state (%) - American Indian and Alaska Native
Geographical mobility - Moved from different county within same state (%) - Multirace
Geographical mobility - Moved from different county within same state (%) - Other Race
Geographical mobility - Moved from different state (%)
Geographical mobility - Moved from different state (%) - White
Geographical mobility - Moved from different state (%) - Black or African American
Geographical mobility - Moved from different state (%) - Asian
Geographical mobility - Moved from different state (%) - Hispanic or Latino
Geographical mobility - Moved from different state (%) - American Indian and Alaska Native
Geographical mobility - Moved from different state (%) - Multirace
Geographical mobility - Moved from different state (%) - Other Race
Geographical mobility - Moved from abroad (%)
Geographical mobility - Moved from abroad (%) - White
Geographical mobility - Moved from abroad (%) - Black or African American
Geographical mobility - Moved from abroad (%) - Asian
Geographical mobility - Moved from abroad (%) - Hispanic or Latino
Geographical mobility - Moved from abroad (%) - American Indian and Alaska Native
Geographical mobility - Moved from abroad (%) - Multirace
Geographical mobility - Moved from abroad (%) - Other Race
Place of birth for the foreign-born population - Ireland (%)
Place of birth for the foreign-born population - Denmark (%)
Place of birth for the foreign-born population - Norway (%)
Place of birth for the foreign-born population - Sweden (%)
Place of birth for the foreign-born population - United Kingdom (%)
Place of birth for the foreign-born population - England (%)
Place of birth for the foreign-born population - Scotland (%)
Place of birth for the foreign-born population - Other Northern Europe (%)
Place of birth for the foreign-born population - Austria (%)
Place of birth for the foreign-born population - Belgium (%)
Place of birth for the foreign-born population - France (%)
Place of birth for the foreign-born population - Germany (%)
Place of birth for the foreign-born population - Netherlands (%)
Place of birth for the foreign-born population - Switzerland (%)
Place of birth for the foreign-born population - Other Western Europe (%)
Place of birth for the foreign-born population - Greece (%)
Place of birth for the foreign-born population - Italy (%)
Place of birth for the foreign-born population - Portugal (%)
Place of birth for the foreign-born population - Spain (%)
Place of birth for the foreign-born population - Other Southern Europe (%)
Place of birth for the foreign-born population - Albania (%)
Place of birth for the foreign-born population - Belarus (%)
Place of birth for the foreign-born population - Bosnia and Herzegovina (%)
Place of birth for the foreign-born population - Bulgaria (%)
Place of birth for the foreign-born population - Croatia (%)
Place of birth for the foreign-born population - Czechoslovakia (%)
Place of birth for the foreign-born population - Hungary (%)
Place of birth for the foreign-born population - Latvia (%)
Place of birth for the foreign-born population - Lithuania (%)
Place of birth for the foreign-born population - North Macedonia (Macedonia) (%)
Place of birth for the foreign-born population - Moldova (%)
Place of birth for the foreign-born population - Poland (%)
Place of birth for the foreign-born population - Romania (%)
Place of birth for the foreign-born population - Russia (%)
Place of birth for the foreign-born population - Serbia (%)
Place of birth for the foreign-born population - Ukraine (%)
Place of birth for the foreign-born population - Other Eastern Europe (%)
Place of birth for the foreign-born population - China (%)
Place of birth for the foreign-born population - Hong Kong (%)
Place of birth for the foreign-born population - Taiwan (%)
Place of birth for the foreign-born population - Japan (%)
Place of birth for the foreign-born population - Korea (%)
Place of birth for the foreign-born population - Other Eastern Asia (%)
Place of birth for the foreign-born population - Afghanistan (%)
Place of birth for the foreign-born population - Bangladesh (%)
Place of birth for the foreign-born population - India (%)
Place of birth for the foreign-born population - Iran (%)
Place of birth for the foreign-born population - Kazakhstan (%)
Place of birth for the foreign-born population - Nepal (%)
Place of birth for the foreign-born population - Pakistan (%)
Place of birth for the foreign-born population - Sri Lanka (%)
Place of birth for the foreign-born population - Uzbekistan (%)
Place of birth for the foreign-born population - Other South Central Asia (%)
Place of birth for the foreign-born population - Burma (%)
Place of birth for the foreign-born population - Cambodia (%)
Place of birth for the foreign-born population - Indonesia (%)
Place of birth for the foreign-born population - Laos (%)
Place of birth for the foreign-born population - Malaysia (%)
Place of birth for the foreign-born population - Philippines (%)
Place of birth for the foreign-born population - Singapore (%)
Place of birth for the foreign-born population - Thailand (%)
Place of birth for the foreign-born population - Vietnam (%)
Place of birth for the foreign-born population - Other South Eastern Asia (%)
Place of birth for the foreign-born population - Armenia (%)
Place of birth for the foreign-born population - Iraq (%)
Place of birth for the foreign-born population - Israel (%)
Place of birth for the foreign-born population - Jordan (%)
Place of birth for the foreign-born population - Kuwait (%)
Place of birth for the foreign-born population - Lebanon (%)
Place of birth for the foreign-born population - Saudi Arabia (%)
Place of birth for the foreign-born population - Syria (%)
Place of birth for the foreign-born population - Turkey (%)
Place of birth for the foreign-born population - Yemen (%)
Place of birth for the foreign-born population - Other Western Asia (%)
Place of birth for the foreign-born population - Eritrea (%)
Place of birth for the foreign-born population - Ethiopia (%)
Place of birth for the foreign-born population - Kenya (%)
Place of birth for the foreign-born population - Somalia (%)
Place of birth for the foreign-born population - Uganda (%)
Place of birth for the foreign-born population - Zimbabwe (%)
Place of birth for the foreign-born population - Other Eastern Africa (%)
Place of birth for the foreign-born population - Cameroon (%)
Place of birth for the foreign-born population - Congo (%)
Place of birth for the foreign-born population - Democratic Republic of Congo (Zaire) (%)
Place of birth for the foreign-born population - Other Middle Africa (%)
Place of birth for the foreign-born population - Egypt (%)
Place of birth for the foreign-born population - Morocco (%)
Place of birth for the foreign-born population - Sudan (%)
Place of birth for the foreign-born population - Other Northern Africa (%)
Place of birth for the foreign-born population - South Africa (%)
Place of birth for the foreign-born population - Other Southern Africa (%)
Place of birth for the foreign-born population - Cabo Verde (%)
Place of birth for the foreign-born population - Ghana (%)
Place of birth for the foreign-born population - Liberia (%)
Place of birth for the foreign-born population - Nigeria (%)
Place of birth for the foreign-born population - Senegal (%)
Place of birth for the foreign-born population - Sierra Leone (%)
Place of birth for the foreign-born population - Other Western Africa (%)
Place of birth for the foreign-born population - Australia (%)
Place of birth for the foreign-born population - New Zealand (%)
Place of birth for the foreign-born population - Fiji (%)
Place of birth for the foreign-born population - Micronesia (%)
Place of birth for the foreign-born population - Bahamas (%)
Place of birth for the foreign-born population - Barbados (%)
Place of birth for the foreign-born population - Cuba (%)
Place of birth for the foreign-born population - Dominica (%)
Place of birth for the foreign-born population - Dominican Republic (%)
Place of birth for the foreign-born population - Grenada (%)
Place of birth for the foreign-born population - Haiti (%)
Place of birth for the foreign-born population - Jamaica (%)
Place of birth for the foreign-born population - St. Vincent and the Grenadines (%)
Place of birth for the foreign-born population - Trinidad and Tobago (%)
Place of birth for the foreign-born population - West Indies (%)
Place of birth for the foreign-born population - Other Caribbean (%)
Place of birth for the foreign-born population - Belize (%)
Place of birth for the foreign-born population - Costa Rica (%)
Place of birth for the foreign-born population - El Salvador (%)
Place of birth for the foreign-born population - Guatemala (%)
Place of birth for the foreign-born population - Honduras (%)
Place of birth for the foreign-born population - Mexico (%)
Place of birth for the foreign-born population - Nicaragua (%)
Place of birth for the foreign-born population - Panama (%)
Place of birth for the foreign-born population - Other Central America (%)
Place of birth for the foreign-born population - Argentina (%)
Place of birth for the foreign-born population - Bolivia (%)
Place of birth for the foreign-born population - Brazil (%)
Place of birth for the foreign-born population - Chile (%)
Place of birth for the foreign-born population - Colombia (%)
Place of birth for the foreign-born population - Ecuador (%)
Place of birth for the foreign-born population - Guyana (%)
Place of birth for the foreign-born population - Peru (%)
Place of birth for the foreign-born population - Uruguay (%)
Place of birth for the foreign-born population - Venezuela (%)
Place of birth for the foreign-born population - Other South America (%)
Place of birth for the foreign-born population - Canada (%)
Place of birth for the foreign-born population - Other Northern America (%)
Place of birth for the foreign-born population - Other (%)
Latest news about races in Grapevine, TX collected exclusively by city-data.com from local newspapers, TV, and radio stations
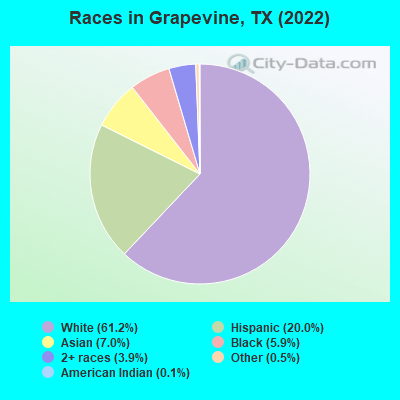
According to 2022 data, the most numerous races in Grapevine, TX are Hispanic (10,350 residents), White alone (31,649 residents), and Black alone (3,077 residents). 76.7% of Grapevine residents speak English at home. 16.6% of Grapevine, TX residents are foreign-born (8.0% born in Latin America, 5.0% born in Asia), which is 2.6% less than the foreign-born rate of 17.0% across the entire state of Texas.
Race distribution in Grapevine
2000 2022
10,933,313 52.4% White alone 6,669,666 32.0% Hispanic 2,364,255 11.3% Black alone 554,445 2.7% Asian alone 230,567 1.1% Two or more races 68,859 0.3% American Indian alone 19,958 0.10% Other race alone 10,757 0.05% Native Hawaiian and Other
12,070,642 40.2% Hispanic 11,683,430 38.9% White alone 3,508,706 11.7% Black alone 1,608,173 5.4% Asian alone 956,560 3.2% Two or more races 125,763 0.4% Other race alone 47,023 0.2% American Indian alone 29,275 0.10% Native Hawaiian and Other
Income and house value in Grapevine Median household income in 2022 $119,095 White non-Hispanic householders$66,047 Black householders$121,261 Asian householders$47,131 Some other race householders$85,637 Two or more races householders$68,167 Hispanic or Latino race householdersMedian 2022 house value $510,978 White Non-Hispanic householders$550,659 Black or African American householders$731,828 American Indian or Alaska Native householders $485,933 Asian householders$399,090 Some other race householders$662,548 Two or more races householders$496,992 Hispanic or Latino householders
Median age by race in Grapevine
43.2 Median age for White residents40.8 45.9 33.6 Median age for Black or African American residents36.7 33.5 37.7 Median age for American Indian / Alaska Native residents-867,996,200.5 14.7 38.6 Median age for Asian residents38.9 38.5 -565,040,649.8 Median age for Native Hawaiian / Pacific Islander residents-550,102,248.9 -551,928,782.8 35.6 Median age for Other race residents35.2 35.1 33.8 Median age for Two or more races residents30.2 48.8 44.0 Median age for White alone residents41.3 46.4 32.2 Median age for Hispanic or Latino residents31.3 33.8
Owner/renter occupied households by race in Grapevine
House owners and renters - White residents 8,983 61.0% Owner occupied5,749 39.0% Renter occupiedHouse owners and renters - Black or African American residents 98 7.5% Owner occupied1,194 92.5% Renter occupiedHouse owners and renters - American Indian / Alaska Native residents 24 100.0% Owner occupiedHouse owners and renters - Asian residents 714 53.6% Owner occupied618 46.4% Renter occupiedHouse owners and renters - Other race residents 146 23.6% Owner occupied472 76.4% Renter occupiedHouse owners and renters - Two or more races residents 1,734 44.0% Owner occupied2,204 56.0% Renter occupiedHouse owners and renters - White alone residents 9,143 62.0% Owner occupied5,601 38.0% Renter occupiedHouse owners and renters - Hispanic or Latino residents 1,322 36.2% Owner occupied2,335 63.8% Renter occupied
Language usage in Grapevine
English speakers - Total 76.7% of residents of Grapevine speak English at home.
13.7% of residents speak Spanish at home 3,724 55.5% Speak English very well2,991 44.5% Speak English less than very well9.3% of residents speak other language at home 3,389 74.0% Speak English very well1,188 26.0% Speak English less than very well
English speakers - Born in the United States 93.5% of residents of Grapevine speak English at home.
3.6% of residents speak Spanish at home 550 76.1% Speak English very well173 23.9% Speak English less than very well2.1% of residents speak other language at home 420 99.1% Speak English very well4 0.9% Speak English less than very well
English speakers - Native, born elsewhere 46.6% of residents of Grapevine speak English at home.
51.8% of residents speak Spanish at home 527 98.9% Speak English very well6 1.1% Speak English less than very well3.8% of residents speak other language at home 39 100.0% Speak English very well
English speakers - Foreign-born 13.4% of residents of Grapevine speak English at home.
44.1% of residents speak Spanish at home 1,004 27.4% Speak English very well2,658 72.6% Speak English less than very well42.7% of residents speak other language at home 2,440 68.8% Speak English very well1,107 31.2% Speak English less than very well
White (Caucasian) - Speak only English Native:
97.7% (28,774)Foreign-born:
27.9% (384)
White (Caucasian) - Speak another language Native:
4.1% (1,212)Foreign-born:
73.2% (1,010)
Black or African American - Speak only English Native:
90.9% (2,605)Foreign-born:
12.6% (53)
Black or African American - Speak another language Native:
10.9% (311)Foreign-born:
88.5% (374)
Asian - Speak only English Native:
66.4% (601)Foreign-born:
13.3% (344)
Asian - Speak another language Native:
36.4% (329)Foreign-born:
87.0% (2,254)
Other race - Speak only English Native:
76.0% (636)Foreign-born:
2.9% (28)
Other race - Speak another language Native:
30.4% (254)Foreign-born:
95.5% (915)
Two or more races - Speak only English Native:
61.8% (3,133)Foreign-born:
12.3% (349)
Two or more races - Speak another language Native:
33.0% (1,672)Foreign-born:
82.2% (2,326)
White alone - Speak only English Native:
98.4% (28,435)Foreign-born:
29.6% (369)
White alone - Speak another language Native:
1.7% (499)Foreign-born:
68.3% (852)
Hispanic or Latino - Speak only English Native:
49.3% (2,866)Foreign-born:
7.5% (290)
Hispanic or Latino - Speak another language Native:
50.1% (2,912)Foreign-born:
92.4% (3,582)
Foreign-born residents in Grapevine 8,571 residents are foreign born (8.0% Latin America , 5.0% Asia ).
This city:
16.6%Texas:
17.1%
Marital status for residents in Grapevine Marital status - White (Caucasian) population 15 years and over
Males 30.9% Never married55.7% Now married0.4% Separated2.1% Widowed10.9% DivorcedFemales 21.9% Never married56.1% Now married1.0% Separated7.4% Widowed13.6% DivorcedWomen who gave birth in the past 12 months Now married:
85.3% (281)Unmarried:
14.7% (48)
Women who did not give birth in the past 12 months Now married:
51.7% (3,119)Unmarried:
48.3% (2,911)
Marital status - Black or African American population 15 years and over
Males 44.8% Never married47.0% Now married0.0% Separated0.9% Widowed7.2% DivorcedFemales 35.0% Never married36.5% Now married15.0% Separated2.8% Widowed10.7% DivorcedWomen who gave birth in the past 12 months Now married:
100.0% (31)Unmarried:
0.0% (0)
Women who did not give birth in the past 12 months Now married:
53.5% (672)Unmarried:
46.5% (585)
Marital status - American Indian / Alaska Native population 15 years and over
Males 64.3% Never married35.7% Now married0.0% Separated0.0% Widowed0.0% DivorcedFemales 0.0% Never married100.0% Now married0.0% Separated0.0% Widowed0.0% DivorcedWomen who did not give birth in the past 12 months Now married:
100.0% (34)Unmarried:
0.0% (0)
Marital status - Asian population 15 years and over
Males 30.4% Never married61.0% Now married0.0% Separated4.3% Widowed4.3% DivorcedFemales 34.0% Never married54.1% Now married1.3% Separated2.9% Widowed7.6% DivorcedWomen who gave birth in the past 12 months Now married:
100.0% (42)Unmarried:
0.0% (0)
Women who did not give birth in the past 12 months Now married:
46.9% (572)Unmarried:
53.1% (647)
Marital status - Other race population 15 years and over
Males 54.9% Never married27.9% Now married12.4% Separated0.0% Widowed4.9% DivorcedFemales 43.1% Never married40.6% Now married0.0% Separated11.9% Widowed4.3% DivorcedWomen who gave birth in the past 12 months Now married:
100.0% (9)Unmarried:
0.0% (0)
Women who did not give birth in the past 12 months Now married:
36.6% (175)Unmarried:
63.4% (304)
Marital status - Two or more races population 15 years and over
Males 47.1% Never married45.3% Now married0.0% Separated0.0% Widowed7.6% DivorcedFemales 22.1% Never married47.6% Now married0.0% Separated5.2% Widowed25.1% DivorcedWomen who gave birth in the past 12 months Now married:
0.0% (0)Unmarried:
100.0% (90)
Women who did not give birth in the past 12 months Now married:
49.0% (771)Unmarried:
51.0% (804)
Marital status - White alone, not Hispanic / Latino population 15 years and over
Males 29.2% Never married56.9% Now married0.4% Separated2.3% Widowed11.2% DivorcedFemales 21.1% Never married56.2% Now married1.2% Separated7.6% Widowed13.9% DivorcedWomen who gave birth in the past 12 months Now married:
83.8% (285)Unmarried:
16.2% (55)
Women who did not give birth in the past 12 months Now married:
51.8% (3,098)Unmarried:
48.2% (2,883)
Marital status - Hispanic or Latino population 15 years and over
Males 52.7% Never married37.0% Now married3.8% Separated0.0% Widowed6.6% DivorcedFemales 26.4% Never married53.8% Now married0.0% Separated4.8% Widowed15.0% DivorcedWomen who gave birth in the past 12 months Now married:
52.3% (48)Unmarried:
47.7% (44)
Women who did not give birth in the past 12 months Now married:
53.1% (1,137)Unmarried:
46.9% (1,002)
Ancestries in Grapevine
3,432 12.4% English1,824 6.6% German1,677 6.0% American1,288 4.6% Irish1,093 3.9% Scottish626 2.3% Italian547 2.0% European439 1.6% Polish257 0.9% Scotch-Irish227 0.8% Egyptian222 0.8% Jamaican194 0.7% French177 0.6% British160 0.6% African158 0.6% Austrian144 0.5% Brazilian142 0.5% Swedish136 0.5% Slovak135 0.5% Dutch118 0.4% Iranian111 0.4% Portuguese89 0.3% Haitian82 0.3% Ukrainian75 0.3% Welsh73 0.3% Danish73 0.3% Norwegian71 0.3% Canadian63 0.2% Scandinavian62 0.2% Nigerian56 0.2% Northern European52 0.2% Eastern European51 0.2% Celtic42 0.2% Czech39 0.1% Russian36 0.1% French Canadian34 0.1% Greek21 0.08% Lithuanian20 0.07% Romanian16 0.06% Guyanese16 0.06% Slovene16 0.06% Belizean15 0.05% Lebanese15 0.05% Estonian14 0.05% Trinidadian and Tobagonian10 0.04% Armenian8 0.03% Finnish7 0.03% Hungarian7 0.03% Australian5 0.02% Swiss
Geographical mobility in Grapevine Same house 1 year ago 27,332 85.2% White (Caucasian)1,887 55.1% Black or African American177 95.4% American Indian / Alaska Native2,749 77.7% Asian1,650 88.5% Other race6,381 79.1% Two or more races26,661 84.8% White alone, not Hispanic / Latino8,685 85.5% Hispanic or LatinoMoved within same county 2,302 7.2% White / Caucasian191 5.6% Black or African American250 7.1% Asian22 1.2% Other race398 4.9% Two or more races2,338 7.4% White alone, not Hispanic / Latino409 4.0% Hispanic or LatinoMoved within same state 1,414 4.4% White / Caucasian279 8.1% Black or African American11 6.1% American Indian / Alaska Native232 6.6% Asian19 1.0% Other race712 8.8% Two or more races1,376 4.4% White alone, not Hispanic / Latino434 4.3% Hispanic or LatinoMoved from different state 957 3.0% White / Caucasian1,383 40.4% Black or African American314 8.9% Asian53 2.9% Other race443 5.5% Two or more races933 3.0% White alone, not Hispanic / Latino376 3.7% Hispanic or LatinoMoved from abroad 21 0.1% White37 1.1% Black or African American78 4.2% Other race138 1.7% Two or more races28 0.1% White alone, not Hispanic / Latino264 2.6% Hispanic or Latino
Children Nativity (place of birth) in Grapevine
Children under 6 years - Living with two parents Both parents native 2,231 100.0% NativeBoth parents foreign-born 288 66.7% Native143 33.3% Foreign-bornOne native, one foreign-born parent 188 100.0% NativeChildren under 6 years - Living with one parent Native parent 318 100.0% NativeForeign-born parent 69 100.0% NativeChildren 6 to 17 years - Living with two parents Both parents native 3,864 99.6% Native15 0.4% Foreign-bornBoth parents foreign-born 1,092 91.5% Native101 8.5% Foreign-bornOne native, one foreign-born parent 392 87.9% Native54 12.1% Foreign-bornChildren 6 to 17 years - Living with one parent Native parent 1,361 100.0% NativeForeign-born parent 204 58.8% Native143 41.2% Foreign-born
Grandparents responsible for own grandchildren in Grapevine
Grandparents (30 to 59 years) White / Caucasian 15 12.3% Responsible for grandchildren108 87.7% Not responsible for grandchildrenAsian 11 100.0% Responsible for grandchildrenWhite alone, not Hispanic / Latino 18 42.6% Responsible for grandchildren25 57.4% Not responsible for grandchildrenHispanic or Latino 112 100.0% Not responsible for grandchildrenGrandparents (60 years and over) White / Caucasian 62 26.0% Responsible for grandchildren175 74.0% Not responsible for grandchildrenAsian 50 100.0% Not responsible for grandchildrenWhite alone, not Hispanic / Latino 66 28.8% Responsible for grandchildren164 71.2% Not responsible for grandchildrenHispanic or Latino 27 100.0% Not responsible for grandchildren