Races in Galax, Virginia (VA) Detailed Stats
Data:
Races - White alone (%)
Races - White alone (% change since 2000)
Races - Black alone (%)
Races - Black alone (% change since 2000)
Races - American Indian alone (%)
Races - American Indian alone (% change since 2000)
Races - Asian alone (%)
Races - Asian alone (% change since 2000)
Races - Hispanic (%)
Races - Hispanic (% change since 2000)
Races - Native Hawaiian and Other Pacific Islander alone (%)
Races - Native Hawaiian and Other Pacific Islander alone (% change since 2000)
Races - Two or more races(%)
Races - Two or more races(% change since 2000)
Races - Other race alone (%)
Races - Other race alone (% change since 2000)
Racial diversity
Place of birth - Born in state of residence (%)
Place of birth - Born in state of residence (%) - White
Place of birth - Born in state of residence (%) - Black or African American
Place of birth - Born in state of residence (%) - Asian
Place of birth - Born in state of residence (%) - Hispanic or Latino
Place of birth - Born in state of residence (%) - American Indian and Alaska Native
Place of birth - Born in state of residence (%) - Multirace
Place of birth - Born in state of residence (%) - Other Race
Place of birth - Born in other state (%)
Place of birth - Born in other state (%) - White
Place of birth - Born in other state (%) - Black or African American
Place of birth - Born in other state (%) - Asian
Place of birth - Born in other state (%) - Hispanic or Latino
Place of birth - Born in other state (%) - American Indian and Alaska Native
Place of birth - Born in other state (%) - Multirace
Place of birth - Born in other state (%) - Other Race
Place of birth - Native, outside of US (%)
Place of birth - Native, outside of US (%) - White
Place of birth - Native, outside of US (%) - Black or African American
Place of birth - Native, outside of US (%) - Asian
Place of birth - Native, outside of US (%) - Hispanic or Latino
Place of birth - Native, outside of US (%) - American Indian and Alaska Native
Place of birth - Native, outside of US (%) - Multirace
Place of birth - Native, outside of US (%) - Other Race
Place of birth - Foreign born (%)
Place of birth - Foreign born (%) - White
Place of birth - Foreign born (%) - Black or African American
Place of birth - Foreign born (%) - Asian
Place of birth - Foreign born (%) - Hispanic or Latino
Place of birth - Foreign born (%) - American Indian and Alaska Native
Place of birth - Foreign born (%) - Multirace
Place of birth - Foreign born (%) - Other Race
Residents speaking English at home (%)
Residents speaking English at home - Born in the United States (%)
Residents speaking English at home - Native, born elsewhere (%)
Residents speaking English at home - Foreign born (%)
Residents speaking Spanish at home (%)
Residents speaking Spanish at home - Born in the United States (%)
Residents speaking Spanish at home - Native, born elsewhere (%)
Residents speaking Spanish at home - Foreign born (%)
Residents speaking other language at home (%)
Residents speaking other language at home - Born in the United States (%)
Residents speaking other language at home - Native, born elsewhere (%)
Residents speaking other language at home - Foreign born (%)
Marital status - Never married (%)
Marital status - Now married (%)
Marital status - Separated (%)
Marital status - Widowed (%)
Marital status - Divorced (%)
Ancestries Reported - Arab (%)
Ancestries Reported - Czech (%)
Ancestries Reported - Danish (%)
Ancestries Reported - Dutch (%)
Ancestries Reported - English (%)
Ancestries Reported - French (%)
Ancestries Reported - French Canadian (%)
Ancestries Reported - German (%)
Ancestries Reported - Greek (%)
Ancestries Reported - Hungarian (%)
Ancestries Reported - Irish (%)
Ancestries Reported - Italian (%)
Ancestries Reported - Lithuanian (%)
Ancestries Reported - Norwegian (%)
Ancestries Reported - Polish (%)
Ancestries Reported - Portuguese (%)
Ancestries Reported - Russian (%)
Ancestries Reported - Scotch-Irish (%)
Ancestries Reported - Scottish (%)
Ancestries Reported - Slovak (%)
Ancestries Reported - Subsaharan African (%)
Ancestries Reported - Swedish (%)
Ancestries Reported - Swiss (%)
Ancestries Reported - Ukrainian (%)
Ancestries Reported - United States (%)
Ancestries Reported - Welsh (%)
Ancestries Reported - West Indian (%)
Ancestries Reported - Other (%)
Geographical mobility - Same house 1 year ago (%)
Geographical mobility - Same house 1 year ago (%) - White
Geographical mobility - Same house 1 year ago (%) - Black or African American
Geographical mobility - Same house 1 year ago (%) - Asian
Geographical mobility - Same house 1 year ago (%) - Hispanic or Latino
Geographical mobility - Same house 1 year ago (%) - American Indian and Alaska Native
Geographical mobility - Same house 1 year ago (%) - Multirace
Geographical mobility - Same house 1 year ago (%) - Other Race
Geographical mobility - Moved within same county (%)
Geographical mobility - Moved within same county (%) - White
Geographical mobility - Moved within same county (%) - Black or African American
Geographical mobility - Moved within same county (%) - Asian
Geographical mobility - Moved within same county (%) - Hispanic or Latino
Geographical mobility - Moved within same county (%) - American Indian and Alaska Native
Geographical mobility - Moved within same county (%) - Multirace
Geographical mobility - Moved within same county (%) - Other Race
Geographical mobility - Moved from different county within same state (%)
Geographical mobility - Moved from different county within same state (%) - White
Geographical mobility - Moved from different county within same state (%) - Black or African American
Geographical mobility - Moved from different county within same state (%) - Asian
Geographical mobility - Moved from different county within same state (%) - Hispanic or Latino
Geographical mobility - Moved from different county within same state (%) - American Indian and Alaska Native
Geographical mobility - Moved from different county within same state (%) - Multirace
Geographical mobility - Moved from different county within same state (%) - Other Race
Geographical mobility - Moved from different state (%)
Geographical mobility - Moved from different state (%) - White
Geographical mobility - Moved from different state (%) - Black or African American
Geographical mobility - Moved from different state (%) - Asian
Geographical mobility - Moved from different state (%) - Hispanic or Latino
Geographical mobility - Moved from different state (%) - American Indian and Alaska Native
Geographical mobility - Moved from different state (%) - Multirace
Geographical mobility - Moved from different state (%) - Other Race
Geographical mobility - Moved from abroad (%)
Geographical mobility - Moved from abroad (%) - White
Geographical mobility - Moved from abroad (%) - Black or African American
Geographical mobility - Moved from abroad (%) - Asian
Geographical mobility - Moved from abroad (%) - Hispanic or Latino
Geographical mobility - Moved from abroad (%) - American Indian and Alaska Native
Geographical mobility - Moved from abroad (%) - Multirace
Geographical mobility - Moved from abroad (%) - Other Race
Place of birth for the foreign-born population - Ireland (%)
Place of birth for the foreign-born population - Denmark (%)
Place of birth for the foreign-born population - Norway (%)
Place of birth for the foreign-born population - Sweden (%)
Place of birth for the foreign-born population - United Kingdom (%)
Place of birth for the foreign-born population - England (%)
Place of birth for the foreign-born population - Scotland (%)
Place of birth for the foreign-born population - Other Northern Europe (%)
Place of birth for the foreign-born population - Austria (%)
Place of birth for the foreign-born population - Belgium (%)
Place of birth for the foreign-born population - France (%)
Place of birth for the foreign-born population - Germany (%)
Place of birth for the foreign-born population - Netherlands (%)
Place of birth for the foreign-born population - Switzerland (%)
Place of birth for the foreign-born population - Other Western Europe (%)
Place of birth for the foreign-born population - Greece (%)
Place of birth for the foreign-born population - Italy (%)
Place of birth for the foreign-born population - Portugal (%)
Place of birth for the foreign-born population - Spain (%)
Place of birth for the foreign-born population - Other Southern Europe (%)
Place of birth for the foreign-born population - Albania (%)
Place of birth for the foreign-born population - Belarus (%)
Place of birth for the foreign-born population - Bosnia and Herzegovina (%)
Place of birth for the foreign-born population - Bulgaria (%)
Place of birth for the foreign-born population - Croatia (%)
Place of birth for the foreign-born population - Czechoslovakia (%)
Place of birth for the foreign-born population - Hungary (%)
Place of birth for the foreign-born population - Latvia (%)
Place of birth for the foreign-born population - Lithuania (%)
Place of birth for the foreign-born population - North Macedonia (Macedonia) (%)
Place of birth for the foreign-born population - Moldova (%)
Place of birth for the foreign-born population - Poland (%)
Place of birth for the foreign-born population - Romania (%)
Place of birth for the foreign-born population - Russia (%)
Place of birth for the foreign-born population - Serbia (%)
Place of birth for the foreign-born population - Ukraine (%)
Place of birth for the foreign-born population - Other Eastern Europe (%)
Place of birth for the foreign-born population - China (%)
Place of birth for the foreign-born population - Hong Kong (%)
Place of birth for the foreign-born population - Taiwan (%)
Place of birth for the foreign-born population - Japan (%)
Place of birth for the foreign-born population - Korea (%)
Place of birth for the foreign-born population - Other Eastern Asia (%)
Place of birth for the foreign-born population - Afghanistan (%)
Place of birth for the foreign-born population - Bangladesh (%)
Place of birth for the foreign-born population - India (%)
Place of birth for the foreign-born population - Iran (%)
Place of birth for the foreign-born population - Kazakhstan (%)
Place of birth for the foreign-born population - Nepal (%)
Place of birth for the foreign-born population - Pakistan (%)
Place of birth for the foreign-born population - Sri Lanka (%)
Place of birth for the foreign-born population - Uzbekistan (%)
Place of birth for the foreign-born population - Other South Central Asia (%)
Place of birth for the foreign-born population - Burma (%)
Place of birth for the foreign-born population - Cambodia (%)
Place of birth for the foreign-born population - Indonesia (%)
Place of birth for the foreign-born population - Laos (%)
Place of birth for the foreign-born population - Malaysia (%)
Place of birth for the foreign-born population - Philippines (%)
Place of birth for the foreign-born population - Singapore (%)
Place of birth for the foreign-born population - Thailand (%)
Place of birth for the foreign-born population - Vietnam (%)
Place of birth for the foreign-born population - Other South Eastern Asia (%)
Place of birth for the foreign-born population - Armenia (%)
Place of birth for the foreign-born population - Iraq (%)
Place of birth for the foreign-born population - Israel (%)
Place of birth for the foreign-born population - Jordan (%)
Place of birth for the foreign-born population - Kuwait (%)
Place of birth for the foreign-born population - Lebanon (%)
Place of birth for the foreign-born population - Saudi Arabia (%)
Place of birth for the foreign-born population - Syria (%)
Place of birth for the foreign-born population - Turkey (%)
Place of birth for the foreign-born population - Yemen (%)
Place of birth for the foreign-born population - Other Western Asia (%)
Place of birth for the foreign-born population - Eritrea (%)
Place of birth for the foreign-born population - Ethiopia (%)
Place of birth for the foreign-born population - Kenya (%)
Place of birth for the foreign-born population - Somalia (%)
Place of birth for the foreign-born population - Uganda (%)
Place of birth for the foreign-born population - Zimbabwe (%)
Place of birth for the foreign-born population - Other Eastern Africa (%)
Place of birth for the foreign-born population - Cameroon (%)
Place of birth for the foreign-born population - Congo (%)
Place of birth for the foreign-born population - Democratic Republic of Congo (Zaire) (%)
Place of birth for the foreign-born population - Other Middle Africa (%)
Place of birth for the foreign-born population - Egypt (%)
Place of birth for the foreign-born population - Morocco (%)
Place of birth for the foreign-born population - Sudan (%)
Place of birth for the foreign-born population - Other Northern Africa (%)
Place of birth for the foreign-born population - South Africa (%)
Place of birth for the foreign-born population - Other Southern Africa (%)
Place of birth for the foreign-born population - Cabo Verde (%)
Place of birth for the foreign-born population - Ghana (%)
Place of birth for the foreign-born population - Liberia (%)
Place of birth for the foreign-born population - Nigeria (%)
Place of birth for the foreign-born population - Senegal (%)
Place of birth for the foreign-born population - Sierra Leone (%)
Place of birth for the foreign-born population - Other Western Africa (%)
Place of birth for the foreign-born population - Australia (%)
Place of birth for the foreign-born population - New Zealand (%)
Place of birth for the foreign-born population - Fiji (%)
Place of birth for the foreign-born population - Micronesia (%)
Place of birth for the foreign-born population - Bahamas (%)
Place of birth for the foreign-born population - Barbados (%)
Place of birth for the foreign-born population - Cuba (%)
Place of birth for the foreign-born population - Dominica (%)
Place of birth for the foreign-born population - Dominican Republic (%)
Place of birth for the foreign-born population - Grenada (%)
Place of birth for the foreign-born population - Haiti (%)
Place of birth for the foreign-born population - Jamaica (%)
Place of birth for the foreign-born population - St. Vincent and the Grenadines (%)
Place of birth for the foreign-born population - Trinidad and Tobago (%)
Place of birth for the foreign-born population - West Indies (%)
Place of birth for the foreign-born population - Other Caribbean (%)
Place of birth for the foreign-born population - Belize (%)
Place of birth for the foreign-born population - Costa Rica (%)
Place of birth for the foreign-born population - El Salvador (%)
Place of birth for the foreign-born population - Guatemala (%)
Place of birth for the foreign-born population - Honduras (%)
Place of birth for the foreign-born population - Mexico (%)
Place of birth for the foreign-born population - Nicaragua (%)
Place of birth for the foreign-born population - Panama (%)
Place of birth for the foreign-born population - Other Central America (%)
Place of birth for the foreign-born population - Argentina (%)
Place of birth for the foreign-born population - Bolivia (%)
Place of birth for the foreign-born population - Brazil (%)
Place of birth for the foreign-born population - Chile (%)
Place of birth for the foreign-born population - Colombia (%)
Place of birth for the foreign-born population - Ecuador (%)
Place of birth for the foreign-born population - Guyana (%)
Place of birth for the foreign-born population - Peru (%)
Place of birth for the foreign-born population - Uruguay (%)
Place of birth for the foreign-born population - Venezuela (%)
Place of birth for the foreign-born population - Other South America (%)
Place of birth for the foreign-born population - Canada (%)
Place of birth for the foreign-born population - Other Northern America (%)
Place of birth for the foreign-born population - Other (%)
Latest news about races in Galax, VA collected exclusively by city-data.com from local newspapers, TV, and radio stations
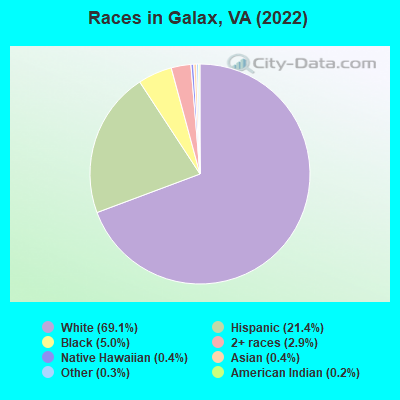
According to 2022 data, the most numerous races in Galax, VA are White alone (4,654 residents), Black alone (337 residents), and Hispanic (1,443 residents). 82.7% of Galax residents speak English at home. 7.8% of Galax, VA residents are foreign-born (6.6% born in Latin America), which is 53.3% less than the foreign-born rate of 12.0% across the entire state of Virginia.
Race distribution in Galax
2000 2022
4,965,637 70.2% White alone 1,376,378 19.4% Black alone 329,540 4.7% Hispanic 259,277 3.7% Asian alone 114,022 1.6% Two or more races 18,596 0.3% American Indian alone 11,685 0.2% Other race alone 3,380 0.05% Native Hawaiian and Other
5,095,130 58.7% White alone 1,594,785 18.4% Black alone 905,750 10.4% Hispanic 602,881 6.9% Asian alone 406,047 4.7% Two or more races 60,419 0.7% Other race alone 11,738 0.1% American Indian alone 6,869 0.08% Native Hawaiian and Other
Income and house value in Galax Median household income in 2022 $45,212 White non-Hispanic householders$39,845 Black householders$89,280 Some other race householders$53,173 Two or more races householders$53,661 Hispanic or Latino race householdersMedian 2022 house value $134,836 White Non-Hispanic householders$89,018 Black or African American householders$56,664 Some other race householders$79,480 Hispanic or Latino householders
Median age by race in Galax
47.2 Median age for White residents48.2 44.3 51.8 Median age for Black or African American residents52.0 51.7 -682,215,742.8 Median age for American Indian / Alaska Native residents-682,352,940.5 -687,861,271.0 -677,192,981.8 Median age for Asian residents-681,198,909.4 -676,870,747.6 -611,955,419.9 Median age for Native Hawaiian / Pacific Islander residents-541,531,822.5 -714,150,046.8 25.3 Median age for Other race residents24.7 43.0 21.5 Median age for Two or more races residents20.1 21.9 47.9 Median age for White alone residents47.8 48.4 19.8 Median age for Hispanic or Latino residents19.0 20.1
Owner/renter occupied households by race in Galax
House owners and renters - White residents 1,664 76.9% Owner occupied501 23.1% Renter occupiedHouse owners and renters - Black or African American residents 114 47.0% Owner occupied129 53.0% Renter occupiedHouse owners and renters - American Indian / Alaska Native residents 18 100.0% Owner occupiedHouse owners and renters - Other race residents 49 58.5% Owner occupied35 41.5% Renter occupiedHouse owners and renters - Two or more races residents 33 20.9% Owner occupied126 79.1% Renter occupiedHouse owners and renters - White alone residents 1,619 77.3% Owner occupied475 22.7% Renter occupiedHouse owners and renters - Hispanic or Latino residents 167 50.0% Owner occupied167 50.0% Renter occupied
Language usage in Galax
English speakers - Total 82.7% of residents of Galax speak English at home.
16.1% of residents speak Spanish at home 694 68.4% Speak English very well320 31.6% Speak English less than very well0.9% of residents speak other language at home 8 14.3% Speak English very well48 85.7% Speak English less than very well
English speakers - Born in the United States 98.0% of residents of Galax speak English at home.
1.6% of residents speak Spanish at home 29 100.0% Speak English very well
English speakers - Native, born elsewhere 96.3% of residents of Galax speak English at home.
English speakers - Foreign-born 16.9% of residents of Galax speak English at home.
69.7% of residents speak Spanish at home 55 14.9% Speak English very well313 85.1% Speak English less than very well10.4% of residents speak other language at home 8 14.5% Speak English very well47 85.5% Speak English less than very well
White (Caucasian) - Speak only English Native:
96.7% (4,392)Foreign-born:
22.7% (27)
White (Caucasian) - Speak another language Native:
3.3% (148)Foreign-born:
75.8% (91)
Black or African American - Speak another language Native:
30.5% (143)Foreign-born:
100.0% (67)
Other race - Speak another language Native:
61.1% (133)Foreign-born:
98.4% (87)
Two or more races - Speak only English Native:
48.7% (239)Foreign-born:
22.0% (61)
Two or more races - Speak another language Native:
56.4% (277)Foreign-born:
77.3% (214)
White alone - Speak only English Native:
99.0% (4,334)Foreign-born:
24.9% (13)
White alone - Speak another language Native:
1.0% (44)Foreign-born:
75.9% (39)
Hispanic or Latino - Speak only English Native:
28.4% (247)Foreign-born:
14.8% (65)
Hispanic or Latino - Speak another language Native:
70.5% (613)Foreign-born:
85.6% (376)
Foreign-born residents in Galax 527 residents are foreign born (6.6% Latin America ).
This city:
7.8%Virginia:
12.6%
Marital status for residents in Galax Marital status - White (Caucasian) population 15 years and over
Males 19.8% Never married63.5% Now married0.0% Separated7.7% Widowed9.0% DivorcedFemales 20.3% Never married44.0% Now married2.4% Separated15.8% Widowed17.5% DivorcedWomen who gave birth in the past 12 months Now married:
55.7% (69)Unmarried:
44.3% (54)
Women who did not give birth in the past 12 months Now married:
47.8% (496)Unmarried:
52.2% (542)
Marital status - Black or African American population 15 years and over
Males 61.0% Never married20.8% Now married0.0% Separated8.2% Widowed10.0% DivorcedFemales 62.2% Never married16.3% Now married0.0% Separated16.7% Widowed4.7% DivorcedWomen who did not give birth in the past 12 months Now married:
28.1% (38)Unmarried:
71.9% (96)
Marital status - Other race population 15 years and over
Males 55.8% Never married44.2% Now married0.0% Separated0.0% Widowed0.0% DivorcedFemales 0.0% Never married100.0% Now married0.0% Separated0.0% Widowed0.0% DivorcedWomen who did not give birth in the past 12 months Now married:
100.0% (26)Unmarried:
0.0% (0)
Marital status - Two or more races population 15 years and over
Males 77.1% Never married12.9% Now married10.0% Separated0.0% Widowed0.0% DivorcedFemales 58.3% Never married14.4% Now married18.2% Separated3.7% Widowed5.3% DivorcedWomen who did not give birth in the past 12 months Now married:
33.5% (75)Unmarried:
66.5% (149)
Marital status - White alone, not Hispanic / Latino population 15 years and over
Males 18.2% Never married64.3% Now married0.0% Separated8.0% Widowed9.4% DivorcedFemales 19.6% Never married44.6% Now married2.5% Separated15.1% Widowed18.2% DivorcedWomen who gave birth in the past 12 months Now married:
55.7% (71)Unmarried:
44.3% (57)
Women who did not give birth in the past 12 months Now married:
49.8% (493)Unmarried:
50.2% (497)
Marital status - Hispanic or Latino population 15 years and over
Males 62.4% Never married31.9% Now married5.8% Separated0.0% Widowed0.0% DivorcedFemales 46.5% Never married36.4% Now married7.8% Separated8.0% Widowed1.4% DivorcedWomen who did not give birth in the past 12 months Now married:
36.5% (141)Unmarried:
63.5% (245)
Ancestries in Galax
1,408 35.7% American388 9.8% English160 4.1% German104 2.6% Lithuanian66 1.7% Scotch-Irish37 0.9% Irish35 0.9% Italian29 0.7% Polish25 0.6% European15 0.4% Swedish12 0.3% British8 0.2% Portuguese7 0.2% Hungarian6 0.2% Norwegian
Children Nativity (place of birth) in Galax
Children under 6 years - Living with two parents Both parents native 206 100.0% NativeOne native, one foreign-born parent 80 100.0% NativeChildren under 6 years - Living with one parent Native parent 125 100.0% NativeForeign-born parent 48 100.0% NativeChildren 6 to 17 years - Living with two parents Both parents native 471 100.0% NativeBoth parents foreign-born 203 100.0% NativeOne native, one foreign-born parent 108 100.0% NativeChildren 6 to 17 years - Living with one parent Native parent 123 100.0% NativeForeign-born parent 135 49.9% Native136 50.1% Foreign-born
Grandparents responsible for own grandchildren in Galax
Grandparents (30 to 59 years) White / Caucasian 71 89.4% Responsible for grandchildren8 10.6% Not responsible for grandchildrenWhite alone, not Hispanic / Latino 72 88.5% Responsible for grandchildren9 11.5% Not responsible for grandchildrenGrandparents (60 years and over) White / Caucasian 23 43.7% Responsible for grandchildren29 56.3% Not responsible for grandchildrenWhite alone, not Hispanic / Latino 17 35.8% Responsible for grandchildren31 64.2% Not responsible for grandchildren