Races in Fairacres, New Mexico (NM) Detailed Stats
Ancestries, Foreign-born residents, place of birth

Data:
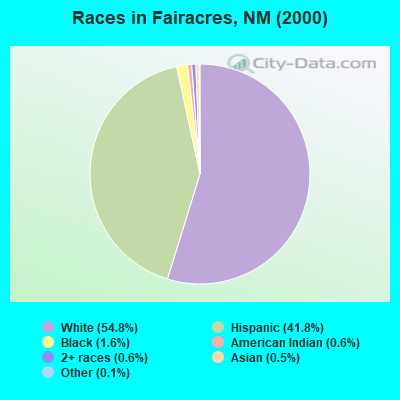
Race distribution in Fairacres

- 2,93354.8%White alone
- 2,23841.8%Hispanic
- 831.6%Black alone
- 330.6%American Indian alone
- 310.6%Two or more races
- 250.5%Asian alone
- 60.1%Other race alone
- 20.04%Native Hawaiian and Other
Pacific Islander alone
2000
2022
-
- 813,49544.7%White alone
- 765,38642.1%Hispanic
- 161,4608.9%American Indian alone
- 30,6541.7%Black alone
- 25,7931.4%Two or more races
- 18,2571.0%Asian alone
- 3,0090.2%Other race alone
- 9920.05%Native Hawaiian and Other
Pacific Islander alone
-
- 1,059,86750.2%Hispanic
- 735,47834.8%White alone
- 171,8088.1%American Indian alone
- 65,0843.1%Two or more races
- 36,8701.7%Black alone
- 35,8701.7%Asian alone
- 7,5820.4%Other race alone
- 7850.04%Native Hawaiian and Other
Pacific Islander alone
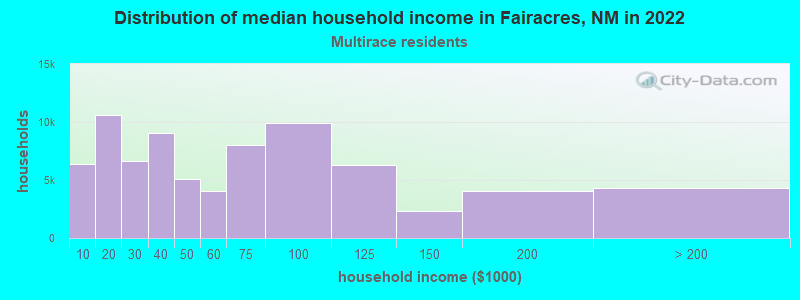
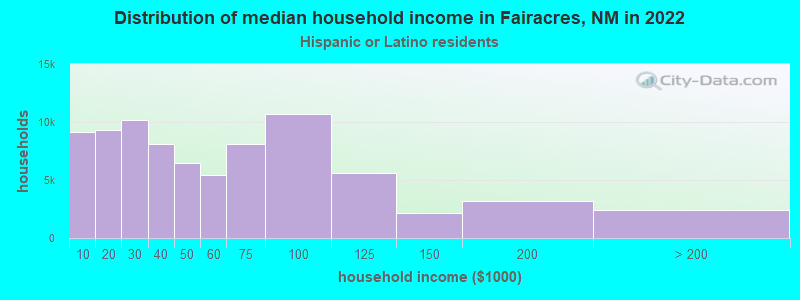
Income and house value in Fairacres
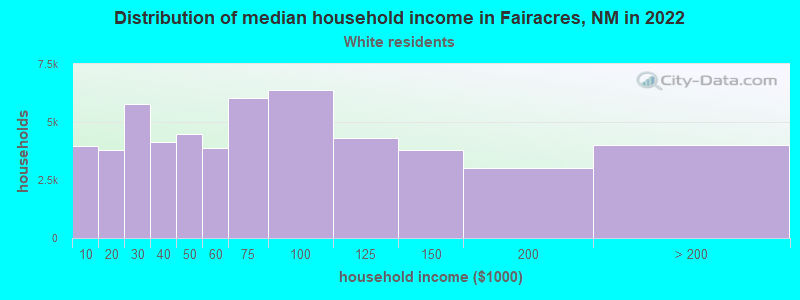
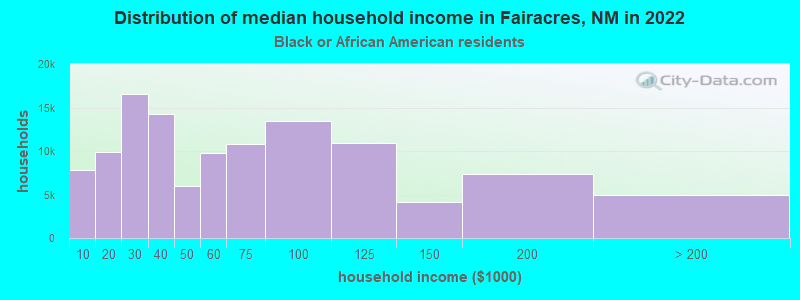
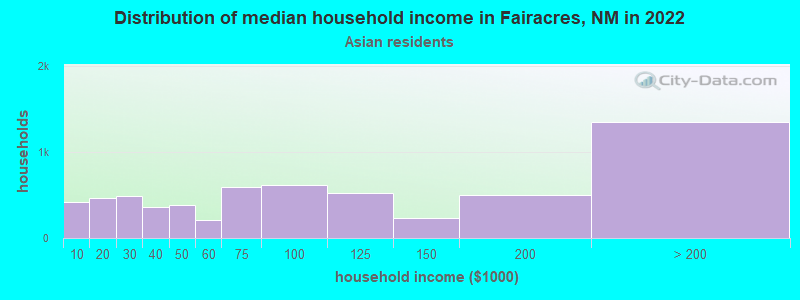
- Median household income in 2022
- $74,971White non-Hispanic householders
- over $200,000Black householders
- $32,264Asian householders
- $43,296Some other race householders
- $178,298Two or more races householders
- $68,276Hispanic or Latino race householders
- Median 2022 house value
- $495,206White Non-Hispanic householders
- over $1,000,000Black or African American householders
- $607,922Asian householders
- $203,975Some other race householders
- $592,473Two or more races householders
- $350,449Hispanic or Latino householders