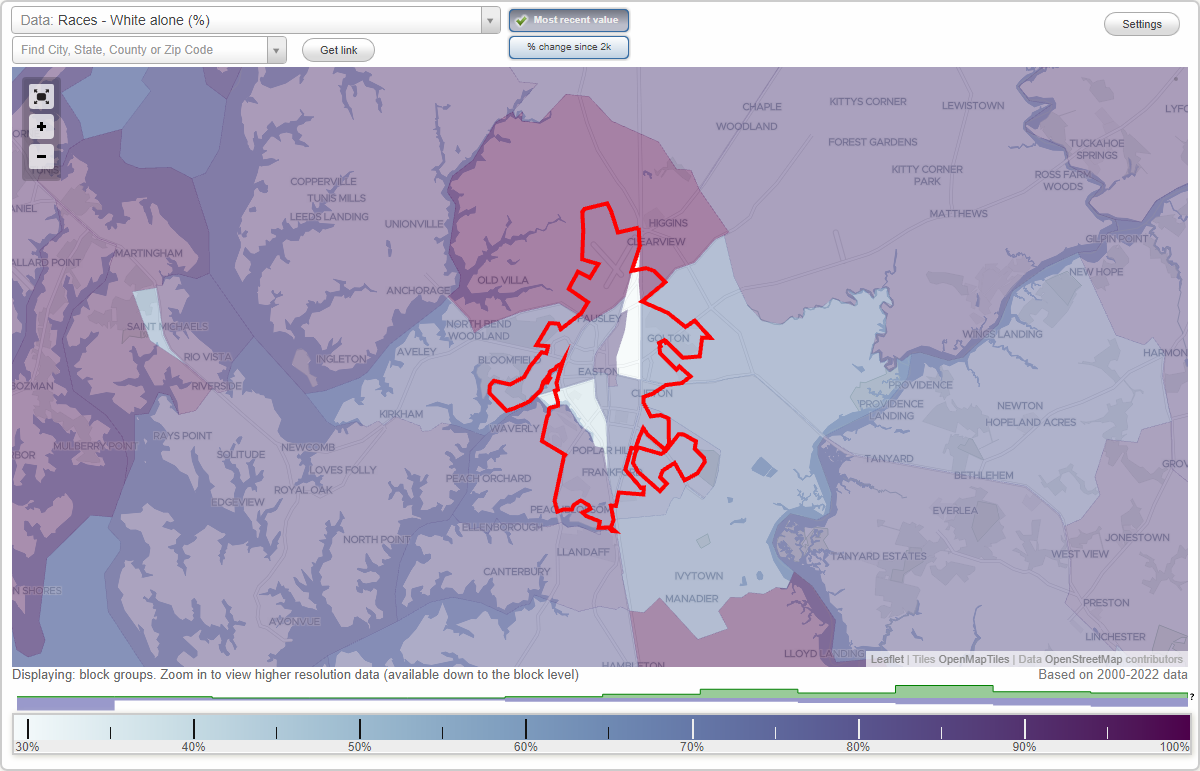
Races in Easton, Maryland (MD) Detailed Stats
Data:
Races - White alone (%)
Races - White alone (% change since 2000)
Races - Black alone (%)
Races - Black alone (% change since 2000)
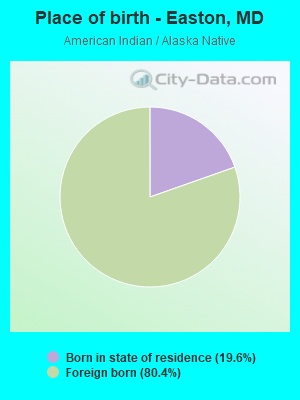
Races - American Indian alone (%)
Races - American Indian alone (% change since 2000)
Races - Asian alone (%)
Races - Asian alone (% change since 2000)
Races - Hispanic (%)
Races - Hispanic (% change since 2000)
Races - Native Hawaiian and Other Pacific Islander alone (%)
Races - Native Hawaiian and Other Pacific Islander alone (% change since 2000)
Races - Two or more races(%)
Races - Two or more races(% change since 2000)
Races - Other race alone (%)
Races - Other race alone (% change since 2000)
Racial diversity
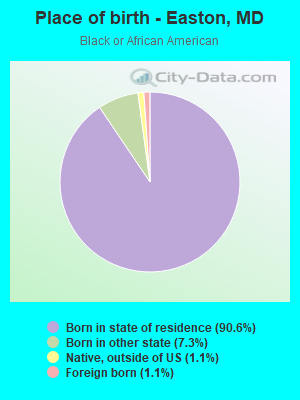
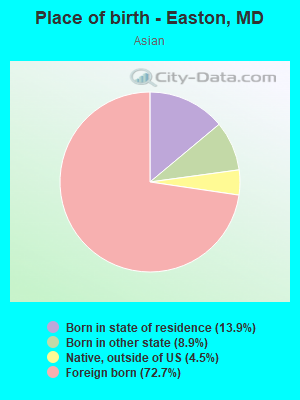
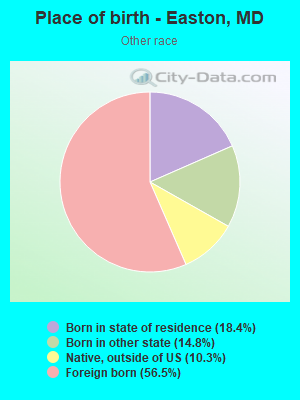
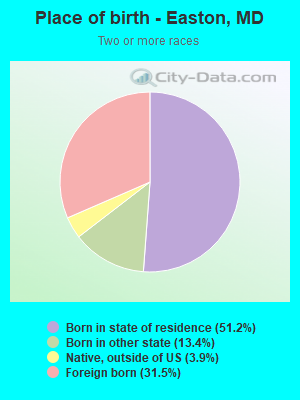
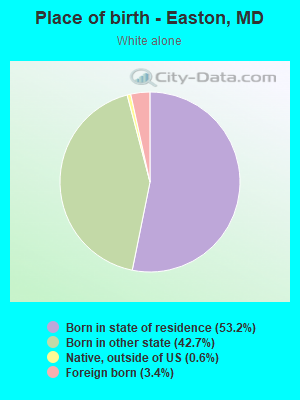
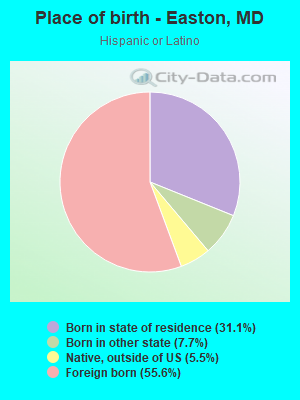
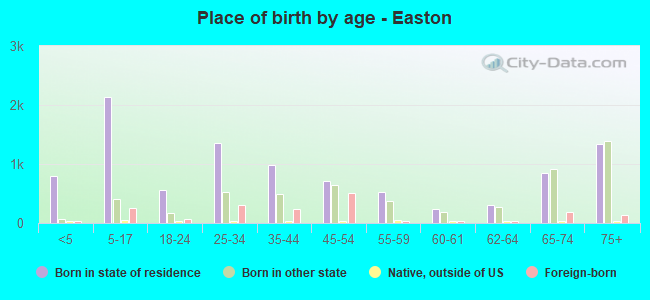
Place of birth - Born in state of residence (%)
Place of birth - Born in state of residence (%) - White
Place of birth - Born in state of residence (%) - Black or African American
Place of birth - Born in state of residence (%) - Asian
Place of birth - Born in state of residence (%) - Hispanic or Latino
Place of birth - Born in state of residence (%) - American Indian and Alaska Native
Place of birth - Born in state of residence (%) - Multirace
Place of birth - Born in state of residence (%) - Other Race
Place of birth - Born in other state (%)
Place of birth - Born in other state (%) - White
Place of birth - Born in other state (%) - Black or African American
Place of birth - Born in other state (%) - Asian
Place of birth - Born in other state (%) - Hispanic or Latino
Place of birth - Born in other state (%) - American Indian and Alaska Native
Place of birth - Born in other state (%) - Multirace
Place of birth - Born in other state (%) - Other Race
Place of birth - Native, outside of US (%)
Place of birth - Native, outside of US (%) - White
Place of birth - Native, outside of US (%) - Black or African American
Place of birth - Native, outside of US (%) - Asian
Place of birth - Native, outside of US (%) - Hispanic or Latino
Place of birth - Native, outside of US (%) - American Indian and Alaska Native
Place of birth - Native, outside of US (%) - Multirace
Place of birth - Native, outside of US (%) - Other Race
Place of birth - Foreign born (%)
Place of birth - Foreign born (%) - White
Place of birth - Foreign born (%) - Black or African American
Place of birth - Foreign born (%) - Asian
Place of birth - Foreign born (%) - Hispanic or Latino
Place of birth - Foreign born (%) - American Indian and Alaska Native
Place of birth - Foreign born (%) - Multirace
Place of birth - Foreign born (%) - Other Race
Residents speaking English at home (%)
Residents speaking English at home - Born in the United States (%)
Residents speaking English at home - Native, born elsewhere (%)
Residents speaking English at home - Foreign born (%)
Residents speaking Spanish at home (%)
Residents speaking Spanish at home - Born in the United States (%)
Residents speaking Spanish at home - Native, born elsewhere (%)
Residents speaking Spanish at home - Foreign born (%)
Residents speaking other language at home (%)
Residents speaking other language at home - Born in the United States (%)
Residents speaking other language at home - Native, born elsewhere (%)
Residents speaking other language at home - Foreign born (%)
Marital status - Never married (%)
Marital status - Now married (%)
Marital status - Separated (%)
Marital status - Widowed (%)
Marital status - Divorced (%)
Ancestries Reported - Arab (%)
Ancestries Reported - Czech (%)
Ancestries Reported - Danish (%)
Ancestries Reported - Dutch (%)
Ancestries Reported - English (%)
Ancestries Reported - French (%)
Ancestries Reported - French Canadian (%)
Ancestries Reported - German (%)
Ancestries Reported - Greek (%)
Ancestries Reported - Hungarian (%)
Ancestries Reported - Irish (%)
Ancestries Reported - Italian (%)
Ancestries Reported - Lithuanian (%)
Ancestries Reported - Norwegian (%)
Ancestries Reported - Polish (%)
Ancestries Reported - Portuguese (%)
Ancestries Reported - Russian (%)
Ancestries Reported - Scotch-Irish (%)
Ancestries Reported - Scottish (%)
Ancestries Reported - Slovak (%)
Ancestries Reported - Subsaharan African (%)
Ancestries Reported - Swedish (%)
Ancestries Reported - Swiss (%)
Ancestries Reported - Ukrainian (%)
Ancestries Reported - United States (%)
Ancestries Reported - Welsh (%)
Ancestries Reported - West Indian (%)
Ancestries Reported - Other (%)
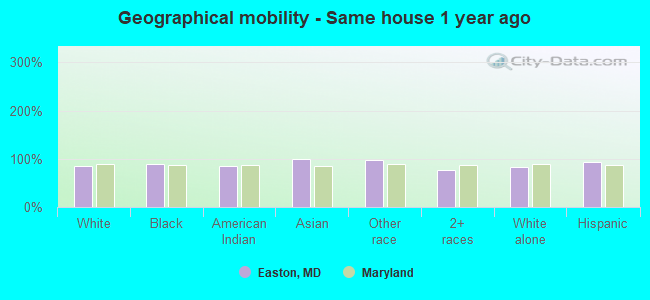
Geographical mobility - Same house 1 year ago (%)
Geographical mobility - Same house 1 year ago (%) - White
Geographical mobility - Same house 1 year ago (%) - Black or African American
Geographical mobility - Same house 1 year ago (%) - Asian
Geographical mobility - Same house 1 year ago (%) - Hispanic or Latino
Geographical mobility - Same house 1 year ago (%) - American Indian and Alaska Native
Geographical mobility - Same house 1 year ago (%) - Multirace
Geographical mobility - Same house 1 year ago (%) - Other Race
Geographical mobility - Moved within same county (%)
Geographical mobility - Moved within same county (%) - White
Geographical mobility - Moved within same county (%) - Black or African American
Geographical mobility - Moved within same county (%) - Asian
Geographical mobility - Moved within same county (%) - Hispanic or Latino
Geographical mobility - Moved within same county (%) - American Indian and Alaska Native
Geographical mobility - Moved within same county (%) - Multirace
Geographical mobility - Moved within same county (%) - Other Race
Geographical mobility - Moved from different county within same state (%)
Geographical mobility - Moved from different county within same state (%) - White
Geographical mobility - Moved from different county within same state (%) - Black or African American
Geographical mobility - Moved from different county within same state (%) - Asian
Geographical mobility - Moved from different county within same state (%) - Hispanic or Latino
Geographical mobility - Moved from different county within same state (%) - American Indian and Alaska Native
Geographical mobility - Moved from different county within same state (%) - Multirace
Geographical mobility - Moved from different county within same state (%) - Other Race
Geographical mobility - Moved from different state (%)
Geographical mobility - Moved from different state (%) - White
Geographical mobility - Moved from different state (%) - Black or African American
Geographical mobility - Moved from different state (%) - Asian
Geographical mobility - Moved from different state (%) - Hispanic or Latino
Geographical mobility - Moved from different state (%) - American Indian and Alaska Native
Geographical mobility - Moved from different state (%) - Multirace
Geographical mobility - Moved from different state (%) - Other Race
Geographical mobility - Moved from abroad (%)
Geographical mobility - Moved from abroad (%) - White
Geographical mobility - Moved from abroad (%) - Black or African American
Geographical mobility - Moved from abroad (%) - Asian
Geographical mobility - Moved from abroad (%) - Hispanic or Latino
Geographical mobility - Moved from abroad (%) - American Indian and Alaska Native
Geographical mobility - Moved from abroad (%) - Multirace
Geographical mobility - Moved from abroad (%) - Other Race
Place of birth for the foreign-born population - Ireland (%)
Place of birth for the foreign-born population - Denmark (%)
Place of birth for the foreign-born population - Norway (%)
Place of birth for the foreign-born population - Sweden (%)
Place of birth for the foreign-born population - United Kingdom (%)
Place of birth for the foreign-born population - England (%)
Place of birth for the foreign-born population - Scotland (%)
Place of birth for the foreign-born population - Other Northern Europe (%)
Place of birth for the foreign-born population - Austria (%)
Place of birth for the foreign-born population - Belgium (%)
Place of birth for the foreign-born population - France (%)
Place of birth for the foreign-born population - Germany (%)
Place of birth for the foreign-born population - Netherlands (%)
Place of birth for the foreign-born population - Switzerland (%)
Place of birth for the foreign-born population - Other Western Europe (%)
Place of birth for the foreign-born population - Greece (%)
Place of birth for the foreign-born population - Italy (%)
Place of birth for the foreign-born population - Portugal (%)
Place of birth for the foreign-born population - Spain (%)
Place of birth for the foreign-born population - Other Southern Europe (%)
Place of birth for the foreign-born population - Albania (%)
Place of birth for the foreign-born population - Belarus (%)
Place of birth for the foreign-born population - Bosnia and Herzegovina (%)
Place of birth for the foreign-born population - Bulgaria (%)
Place of birth for the foreign-born population - Croatia (%)
Place of birth for the foreign-born population - Czechoslovakia (%)
Place of birth for the foreign-born population - Hungary (%)
Place of birth for the foreign-born population - Latvia (%)
Place of birth for the foreign-born population - Lithuania (%)
Place of birth for the foreign-born population - North Macedonia (Macedonia) (%)
Place of birth for the foreign-born population - Moldova (%)
Place of birth for the foreign-born population - Poland (%)
Place of birth for the foreign-born population - Romania (%)
Place of birth for the foreign-born population - Russia (%)
Place of birth for the foreign-born population - Serbia (%)
Place of birth for the foreign-born population - Ukraine (%)
Place of birth for the foreign-born population - Other Eastern Europe (%)
Place of birth for the foreign-born population - China (%)
Place of birth for the foreign-born population - Hong Kong (%)
Place of birth for the foreign-born population - Taiwan (%)
Place of birth for the foreign-born population - Japan (%)
Place of birth for the foreign-born population - Korea (%)
Place of birth for the foreign-born population - Other Eastern Asia (%)
Place of birth for the foreign-born population - Afghanistan (%)
Place of birth for the foreign-born population - Bangladesh (%)
Place of birth for the foreign-born population - India (%)
Place of birth for the foreign-born population - Iran (%)
Place of birth for the foreign-born population - Kazakhstan (%)
Place of birth for the foreign-born population - Nepal (%)
Place of birth for the foreign-born population - Pakistan (%)
Place of birth for the foreign-born population - Sri Lanka (%)
Place of birth for the foreign-born population - Uzbekistan (%)
Place of birth for the foreign-born population - Other South Central Asia (%)
Place of birth for the foreign-born population - Burma (%)
Place of birth for the foreign-born population - Cambodia (%)
Place of birth for the foreign-born population - Indonesia (%)
Place of birth for the foreign-born population - Laos (%)
Place of birth for the foreign-born population - Malaysia (%)
Place of birth for the foreign-born population - Philippines (%)
Place of birth for the foreign-born population - Singapore (%)
Place of birth for the foreign-born population - Thailand (%)
Place of birth for the foreign-born population - Vietnam (%)
Place of birth for the foreign-born population - Other South Eastern Asia (%)
Place of birth for the foreign-born population - Armenia (%)
Place of birth for the foreign-born population - Iraq (%)
Place of birth for the foreign-born population - Israel (%)
Place of birth for the foreign-born population - Jordan (%)
Place of birth for the foreign-born population - Kuwait (%)
Place of birth for the foreign-born population - Lebanon (%)
Place of birth for the foreign-born population - Saudi Arabia (%)
Place of birth for the foreign-born population - Syria (%)
Place of birth for the foreign-born population - Turkey (%)
Place of birth for the foreign-born population - Yemen (%)
Place of birth for the foreign-born population - Other Western Asia (%)
Place of birth for the foreign-born population - Eritrea (%)
Place of birth for the foreign-born population - Ethiopia (%)
Place of birth for the foreign-born population - Kenya (%)
Place of birth for the foreign-born population - Somalia (%)
Place of birth for the foreign-born population - Uganda (%)
Place of birth for the foreign-born population - Zimbabwe (%)
Place of birth for the foreign-born population - Other Eastern Africa (%)
Place of birth for the foreign-born population - Cameroon (%)
Place of birth for the foreign-born population - Congo (%)
Place of birth for the foreign-born population - Democratic Republic of Congo (Zaire) (%)
Place of birth for the foreign-born population - Other Middle Africa (%)
Place of birth for the foreign-born population - Egypt (%)
Place of birth for the foreign-born population - Morocco (%)
Place of birth for the foreign-born population - Sudan (%)
Place of birth for the foreign-born population - Other Northern Africa (%)
Place of birth for the foreign-born population - South Africa (%)
Place of birth for the foreign-born population - Other Southern Africa (%)
Place of birth for the foreign-born population - Cabo Verde (%)
Place of birth for the foreign-born population - Ghana (%)
Place of birth for the foreign-born population - Liberia (%)
Place of birth for the foreign-born population - Nigeria (%)
Place of birth for the foreign-born population - Senegal (%)
Place of birth for the foreign-born population - Sierra Leone (%)
Place of birth for the foreign-born population - Other Western Africa (%)
Place of birth for the foreign-born population - Australia (%)
Place of birth for the foreign-born population - New Zealand (%)
Place of birth for the foreign-born population - Fiji (%)
Place of birth for the foreign-born population - Micronesia (%)
Place of birth for the foreign-born population - Bahamas (%)
Place of birth for the foreign-born population - Barbados (%)
Place of birth for the foreign-born population - Cuba (%)
Place of birth for the foreign-born population - Dominica (%)
Place of birth for the foreign-born population - Dominican Republic (%)
Place of birth for the foreign-born population - Grenada (%)
Place of birth for the foreign-born population - Haiti (%)
Place of birth for the foreign-born population - Jamaica (%)
Place of birth for the foreign-born population - St. Vincent and the Grenadines (%)
Place of birth for the foreign-born population - Trinidad and Tobago (%)
Place of birth for the foreign-born population - West Indies (%)
Place of birth for the foreign-born population - Other Caribbean (%)
Place of birth for the foreign-born population - Belize (%)
Place of birth for the foreign-born population - Costa Rica (%)
Place of birth for the foreign-born population - El Salvador (%)
Place of birth for the foreign-born population - Guatemala (%)
Place of birth for the foreign-born population - Honduras (%)
Place of birth for the foreign-born population - Mexico (%)
Place of birth for the foreign-born population - Nicaragua (%)
Place of birth for the foreign-born population - Panama (%)
Place of birth for the foreign-born population - Other Central America (%)
Place of birth for the foreign-born population - Argentina (%)
Place of birth for the foreign-born population - Bolivia (%)
Place of birth for the foreign-born population - Brazil (%)
Place of birth for the foreign-born population - Chile (%)
Place of birth for the foreign-born population - Colombia (%)
Place of birth for the foreign-born population - Ecuador (%)
Place of birth for the foreign-born population - Guyana (%)
Place of birth for the foreign-born population - Peru (%)
Place of birth for the foreign-born population - Uruguay (%)
Place of birth for the foreign-born population - Venezuela (%)
Place of birth for the foreign-born population - Other South America (%)
Place of birth for the foreign-born population - Canada (%)
Place of birth for the foreign-born population - Other Northern America (%)
Place of birth for the foreign-born population - Other (%)
Latest news about races in Easton, MD collected exclusively by city-data.com from local newspapers, TV, and radio stations
According to 2022 data, the most numerous races in Easton, MD are White alone (11,154 residents), Black alone (2,700 residents), and Hispanic (1,900 residents). 86.4% of Easton residents speak English at home. 10.4% of Easton, MD residents are foreign-born (6.5% born in Latin America, 1.5% born in Asia, 1.4% born in Europe), which is 54.2% less than the foreign-born rate of 16.0% across the entire state of Maryland.
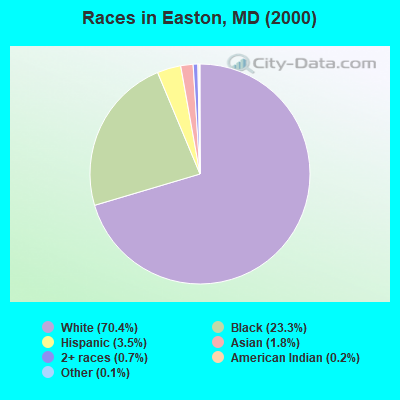
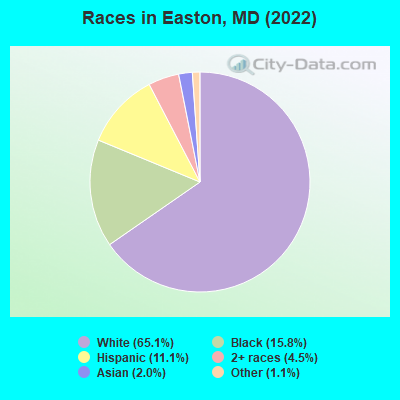
Race distribution in Easton
2000 2022
3,286,547 62.1% White alone 1,464,735 27.7% Black alone 227,916 4.3% Hispanic 209,738 4.0% Asian alone 82,946 1.6% Two or more races 13,312 0.3% American Indian alone 9,379 0.2% Other race alone 1,913 0.04% Native Hawaiian and Other
2,906,492 47.1% White alone 1,800,914 29.2% Black alone 705,842 11.4% Hispanic 401,818 6.5% Asian alone 291,317 4.7% Two or more races 46,930 0.8% Other race alone 8,930 0.1% American Indian alone 2,417 0.04% Native Hawaiian and Other
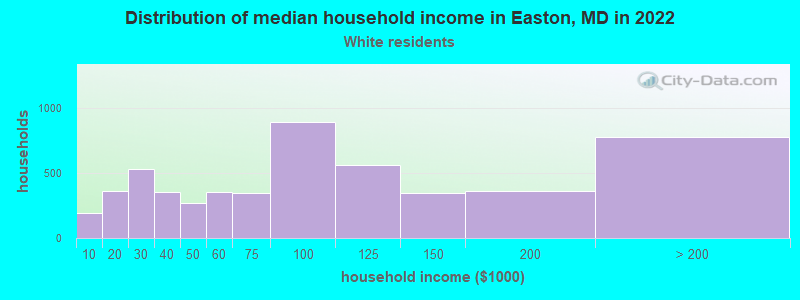
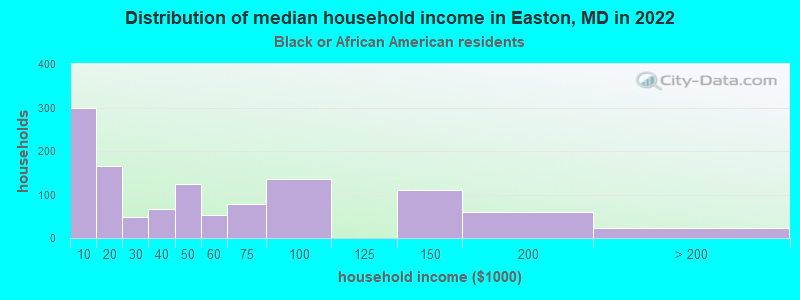
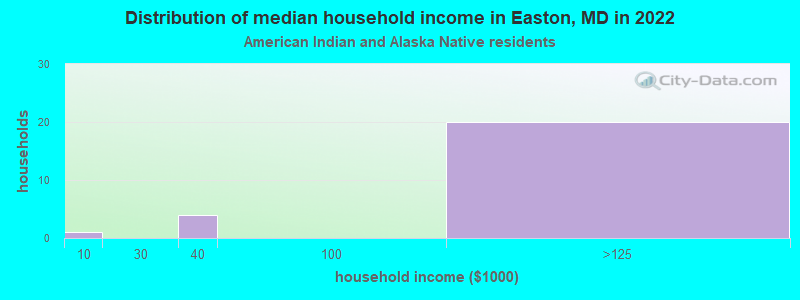
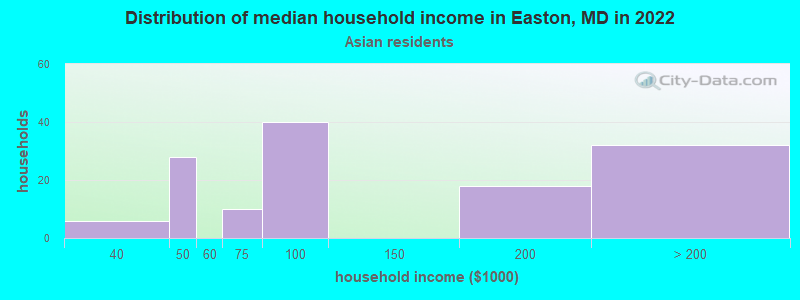
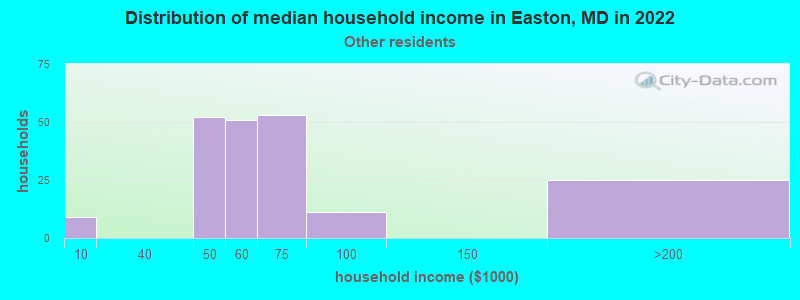
Income and house value in Easton Median household income in 2022 $82,891 White non-Hispanic householders$42,390 Black householders$103,417 American Indian and Alaska Native householders$53,216 Some other race householders$60,896 Two or more races householders$44,385 Hispanic or Latino race householdersMedian 2022 house value $352,353 White Non-Hispanic householders$238,154 Black or African American householders $367,273 Asian householders$215,199 Some other race householders$259,961 Hispanic or Latino householders
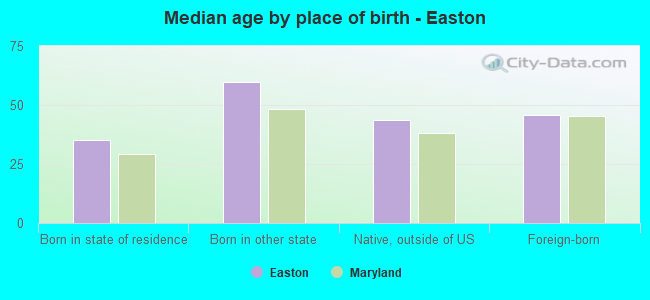
Median age by race in Easton
51.2 Median age for White residents47.2 54.6 37.5 Median age for Black or African American residents35.0 39.9 39.9 Median age for American Indian / Alaska Native residents23.0 43.1 41.2 Median age for Asian residents50.3 37.2 -763,333,332.6 Median age for Native Hawaiian / Pacific Islander residents-720,061,021.4 -760,942,760.2 28.8 Median age for Other race residents16.4 31.6 20.3 Median age for Two or more races residents16.0 28.4 52.1 Median age for White alone residents47.4 56.2 27.3 Median age for Hispanic or Latino residents16.5 30.3
Owner/renter occupied households by race in Easton
House owners and renters - White residents 3,652 68.7% Owner occupied1,663 31.3% Renter occupiedHouse owners and renters - Black or African American residents 253 23.0% Owner occupied848 77.0% Renter occupiedHouse owners and renters - American Indian / Alaska Native residents 25 86.4% Owner occupied4 13.6% Renter occupiedHouse owners and renters - Asian residents 103 80.1% Owner occupied25 19.9% Renter occupiedHouse owners and renters - Other race residents 74 37.2% Owner occupied125 62.8% Renter occupiedHouse owners and renters - Two or more races residents 166 34.7% Owner occupied312 65.3% Renter occupiedHouse owners and renters - White alone residents 3,666 69.0% Owner occupied1,645 31.0% Renter occupiedHouse owners and renters - Hispanic or Latino residents 134 27.6% Owner occupied351 72.4% Renter occupied
Language usage in Easton
English speakers - Total 86.4% of residents of Easton speak English at home.
9.2% of residents speak Spanish at home 558 37.4% Speak English very well934 62.6% Speak English less than very well4.0% of residents speak other language at home 473 73.2% Speak English very well173 26.8% Speak English less than very well
English speakers - Born in the United States 96.7% of residents of Easton speak English at home.
1.8% of residents speak Spanish at home 86 90.5% Speak English very well9 9.5% Speak English less than very well1.2% of residents speak other language at home 54 83.1% Speak English very well11 16.9% Speak English less than very well
English speakers - Native, born elsewhere 61.0% of residents of Easton speak English at home.
36.2% of residents speak Spanish at home 28 31.5% Speak English very well61 68.5% Speak English less than very well3.7% of residents speak other language at home 9 100.0% Speak English very well
English speakers - Foreign-born 18.8% of residents of Easton speak English at home.
55.6% of residents speak Spanish at home 183 18.5% Speak English very well805 81.5% Speak English less than very well26.3% of residents speak other language at home 310 66.4% Speak English very well157 33.6% Speak English less than very well
White (Caucasian) - Speak only English Native:
98.4% (10,219)Foreign-born:
42.1% (185)
White (Caucasian) - Speak another language Native:
1.9% (202)Foreign-born:
61.0% (268)
Black or African American - Speak another language Native:
1.3% (31)Foreign-born:
100.0% (30)
American Indian / Alaska Native - Speak another language Native:
100.0% (42)Foreign-born:
100.0% (189)
Asian - Speak only English Native:
31.9% (22)Foreign-born:
15.7% (39)
Asian - Speak another language Native:
69.3% (49)Foreign-born:
84.4% (208)
Other race - Speak another language Native:
57.1% (185)Foreign-born:
100.0% (416)
Two or more races - Speak only English Native:
81.9% (926)Foreign-born:
20.7% (111)
Two or more races - Speak another language Native:
17.9% (202)Foreign-born:
79.3% (426)
White alone - Speak only English Native:
98.6% (10,197)Foreign-born:
47.6% (182)
White alone - Speak another language Native:
1.4% (149)Foreign-born:
51.6% (197)
Hispanic or Latino - Speak only English Native:
38.0% (269)Foreign-born:
7.5% (80)
Hispanic or Latino - Speak another language Native:
61.8% (436)Foreign-born:
92.3% (980)
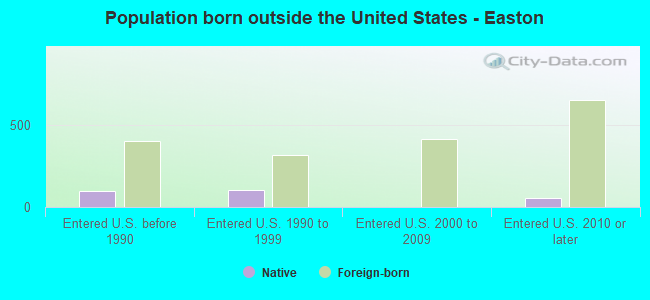
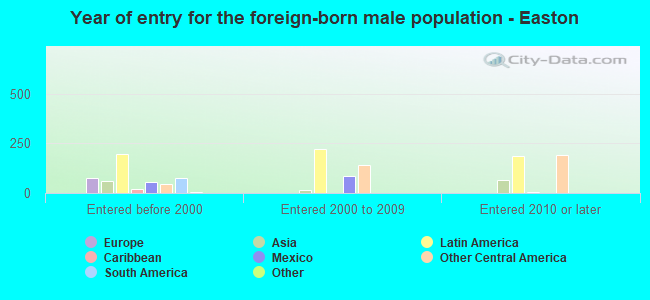
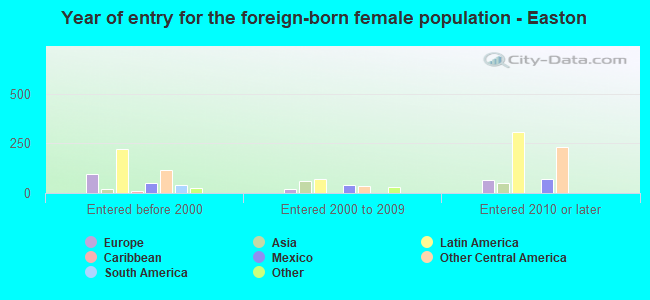
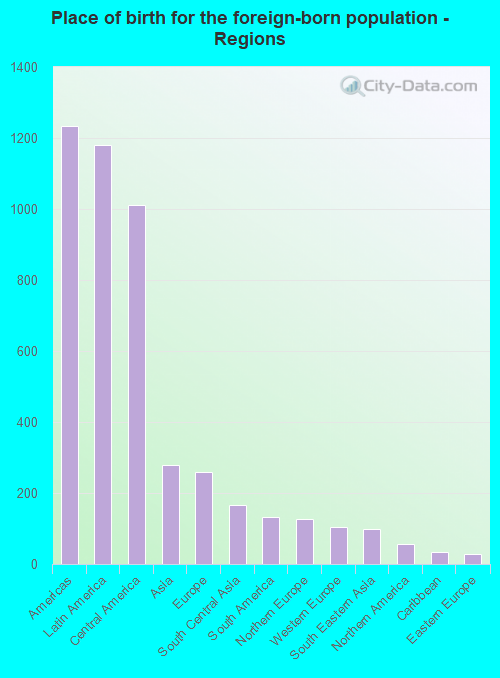
Foreign-born residents in Easton 1,777 residents are foreign born (6.5% Latin America , 1.5% Asia , 1.4% Europe ).
This city:
10.4%Maryland:
15.7%
Marital status for residents in Easton Marital status - White (Caucasian) population 15 years and over
Males 28.4% Never married56.1% Now married2.4% Separated6.9% Widowed6.2% DivorcedFemales 22.3% Never married43.3% Now married1.9% Separated19.4% Widowed13.1% DivorcedWomen who gave birth in the past 12 months Now married:
100.0% (175)Unmarried:
0.0% (0)
Women who did not give birth in the past 12 months Now married:
43.1% (842)Unmarried:
56.9% (1,110)
Marital status - Black or African American population 15 years and over
Males 62.2% Never married21.3% Now married0.3% Separated7.5% Widowed8.8% DivorcedFemales 35.3% Never married17.2% Now married12.2% Separated10.9% Widowed24.4% DivorcedWomen who gave birth in the past 12 months Now married:
77.1% (128)Unmarried:
22.9% (38)
Women who did not give birth in the past 12 months Now married:
23.8% (106)Unmarried:
76.2% (339)
Marital status - American Indian / Alaska Native population 15 years and over
Males 36.9% Never married63.1% Now married0.0% Separated0.0% Widowed0.0% DivorcedFemales 35.3% Never married64.7% Now married0.0% Separated0.0% Widowed0.0% DivorcedWomen who did not give birth in the past 12 months Now married:
33.3% (13)Unmarried:
66.7% (27)
Marital status - Asian population 15 years and over
Males 20.0% Never married56.2% Now married0.0% Separated15.4% Widowed8.5% DivorcedFemales 34.2% Never married65.8% Now married0.0% Separated0.0% Widowed0.0% DivorcedWomen who gave birth in the past 12 months Now married:
100.0% (6)Unmarried:
0.0% (0)
Women who did not give birth in the past 12 months Now married:
65.9% (85)Unmarried:
34.1% (44)
Marital status - Other race population 15 years and over
Males 49.6% Never married50.4% Now married0.0% Separated0.0% Widowed0.0% DivorcedFemales 29.9% Never married31.1% Now married0.0% Separated0.0% Widowed38.9% DivorcedWomen who did not give birth in the past 12 months Now married:
44.4% (95)Unmarried:
55.6% (119)
Marital status - Two or more races population 15 years and over
Males 31.6% Never married61.5% Now married0.0% Separated0.0% Widowed6.9% DivorcedFemales 50.3% Never married29.9% Now married0.0% Separated10.1% Widowed9.8% DivorcedWomen who gave birth in the past 12 months Now married:
0.0% (0)Unmarried:
100.0% (96)
Women who did not give birth in the past 12 months Now married:
29.9% (80)Unmarried:
70.1% (188)
Marital status - White alone, not Hispanic / Latino population 15 years and over
Males 28.9% Never married55.3% Now married2.5% Separated7.1% Widowed6.3% DivorcedFemales 21.2% Never married43.1% Now married2.0% Separated20.1% Widowed13.6% DivorcedWomen who gave birth in the past 12 months Now married:
100.0% (181)Unmarried:
0.0% (0)
Women who did not give birth in the past 12 months Now married:
43.8% (814)Unmarried:
56.2% (1,045)
Marital status - Hispanic or Latino population 15 years and over
Males 27.5% Never married70.2% Now married0.0% Separated0.0% Widowed2.3% DivorcedFemales 43.9% Never married44.7% Now married0.0% Separated0.0% Widowed11.4% DivorcedWomen who gave birth in the past 12 months Now married:
0.0% (0)Unmarried:
100.0% (84)
Women who did not give birth in the past 12 months Now married:
48.4% (223)Unmarried:
51.6% (238)
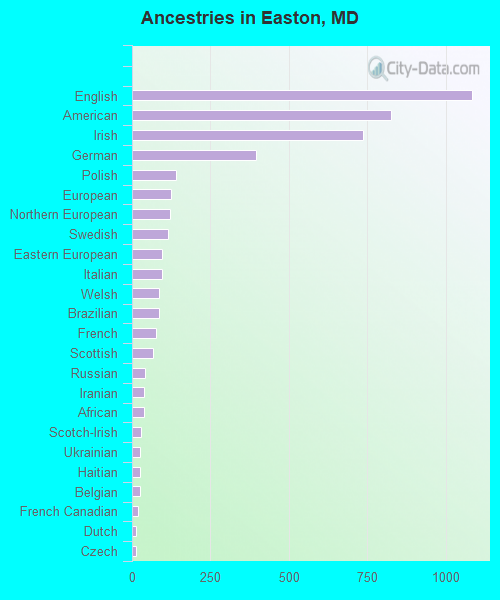
Ancestries in Easton
1,084 13.0% English825 9.9% American735 8.8% Irish396 4.8% German141 1.7% Polish125 1.5% European121 1.5% Northern European115 1.4% Swedish97 1.2% Eastern European96 1.2% Italian87 1.0% Welsh85 1.0% Brazilian78 0.9% French67 0.8% Scottish41 0.5% Russian39 0.5% Iranian39 0.5% African29 0.3% Scotch-Irish27 0.3% Ukrainian26 0.3% Haitian24 0.3% Belgian18 0.2% French Canadian14 0.2% Dutch12 0.1% Czech9 0.1% Afghan6 0.07% British5 0.06% Austrian1 0.01% Greek1 0.01% Romanian
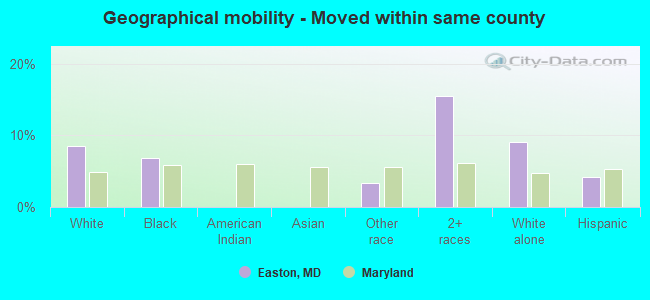
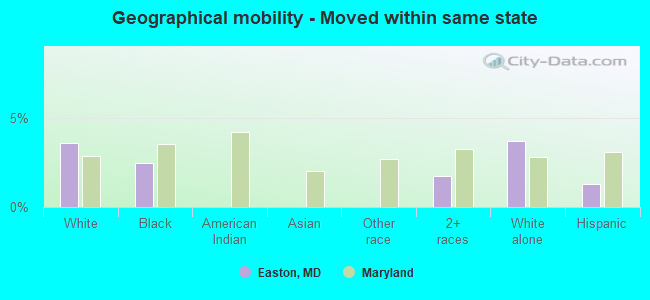
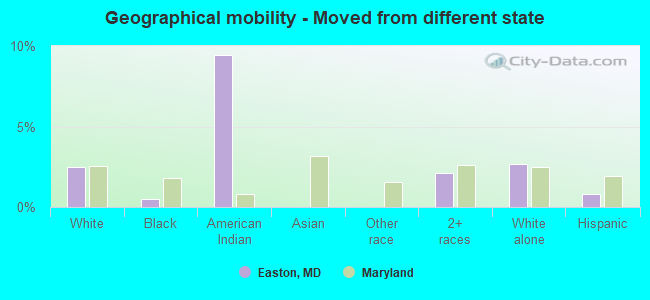
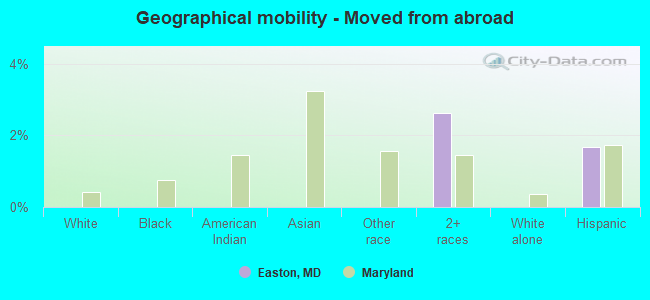
Geographical mobility in Easton Same house 1 year ago 9,543 85.1% White (Caucasian)2,347 90.0% Black or African American175 85.6% American Indian / Alaska Native336 99.7% Asian721 97.8% Other race1,281 77.0% Two or more races9,317 84.3% White alone, not Hispanic / Latino1,765 93.1% Hispanic or LatinoMoved within same county 961 8.6% White / Caucasian179 6.9% Black or African American25 3.3% Other race257 15.5% Two or more races1,002 9.1% White alone, not Hispanic / Latino80 4.2% Hispanic or LatinoMoved within same state 403 3.6% White / Caucasian64 2.5% Black or African American29 1.8% Two or more races409 3.7% White alone, not Hispanic / Latino25 1.3% Hispanic or LatinoMoved from different state 282 2.5% White / Caucasian13 0.5% Black or African American19 9.5% American Indian / Alaska Native35 2.1% Two or more races293 2.7% White alone, not Hispanic / Latino15 0.8% Hispanic or LatinoMoved from abroad 44 2.6% Two or more races32 1.7% Hispanic or Latino
Children Nativity (place of birth) in Easton
Children under 6 years - Living with two parents Both parents native 521 100.0% NativeBoth parents foreign-born 151 62.1% Native92 37.9% Foreign-bornOne native, one foreign-born parent 55 100.0% NativeChildren under 6 years - Living with one parent Native parent 285 100.0% NativeForeign-born parent 64 100.0% NativeChildren 6 to 17 years - Living with two parents Both parents native 1,051 100.0% NativeBoth parents foreign-born 236 67.4% Native114 32.6% Foreign-bornOne native, one foreign-born parent 119 88.3% Native16 11.7% Foreign-bornChildren 6 to 17 years - Living with one parent Native parent 604 100.0% NativeForeign-born parent 167 56.1% Native130 43.9% Foreign-born
Grandparents responsible for own grandchildren in Easton
Grandparents (30 to 59 years) White / Caucasian 50 100.0% Not responsible for grandchildrenBlack or African American 8 11.0% Responsible for grandchildren65 89.0% Not responsible for grandchildrenWhite alone, not Hispanic / Latino 20 100.0% Not responsible for grandchildrenHispanic or Latino 40 100.0% Not responsible for grandchildrenGrandparents (60 years and over) White / Caucasian 9 17.5% Responsible for grandchildren42 82.5% Not responsible for grandchildrenBlack or African American 6 26.7% Responsible for grandchildren16 73.3% Not responsible for grandchildrenWhite alone, not Hispanic / Latino 9 16.6% Responsible for grandchildren45 83.4% Not responsible for grandchildren