Races in Easthampton Town, Massachusetts (MA) Detailed Stats
Data:
Races - White alone (%)
Races - White alone (% change since 2000)
Races - Black alone (%)
Races - Black alone (% change since 2000)
Races - American Indian alone (%)
Races - American Indian alone (% change since 2000)
Races - Asian alone (%)
Races - Asian alone (% change since 2000)
Races - Hispanic (%)
Races - Hispanic (% change since 2000)
Races - Native Hawaiian and Other Pacific Islander alone (%)
Races - Native Hawaiian and Other Pacific Islander alone (% change since 2000)
Races - Two or more races(%)
Races - Two or more races(% change since 2000)
Races - Other race alone (%)
Races - Other race alone (% change since 2000)
Racial diversity
Place of birth - Born in state of residence (%)
Place of birth - Born in state of residence (%) - White
Place of birth - Born in state of residence (%) - Black or African American
Place of birth - Born in state of residence (%) - Asian
Place of birth - Born in state of residence (%) - Hispanic or Latino
Place of birth - Born in state of residence (%) - American Indian and Alaska Native
Place of birth - Born in state of residence (%) - Multirace
Place of birth - Born in state of residence (%) - Other Race
Place of birth - Born in other state (%)
Place of birth - Born in other state (%) - White
Place of birth - Born in other state (%) - Black or African American
Place of birth - Born in other state (%) - Asian
Place of birth - Born in other state (%) - Hispanic or Latino
Place of birth - Born in other state (%) - American Indian and Alaska Native
Place of birth - Born in other state (%) - Multirace
Place of birth - Born in other state (%) - Other Race
Place of birth - Native, outside of US (%)
Place of birth - Native, outside of US (%) - White
Place of birth - Native, outside of US (%) - Black or African American
Place of birth - Native, outside of US (%) - Asian
Place of birth - Native, outside of US (%) - Hispanic or Latino
Place of birth - Native, outside of US (%) - American Indian and Alaska Native
Place of birth - Native, outside of US (%) - Multirace
Place of birth - Native, outside of US (%) - Other Race
Place of birth - Foreign born (%)
Place of birth - Foreign born (%) - White
Place of birth - Foreign born (%) - Black or African American
Place of birth - Foreign born (%) - Asian
Place of birth - Foreign born (%) - Hispanic or Latino
Place of birth - Foreign born (%) - American Indian and Alaska Native
Place of birth - Foreign born (%) - Multirace
Place of birth - Foreign born (%) - Other Race
Residents speaking English at home (%)
Residents speaking English at home - Born in the United States (%)
Residents speaking English at home - Native, born elsewhere (%)
Residents speaking English at home - Foreign born (%)
Residents speaking Spanish at home (%)
Residents speaking Spanish at home - Born in the United States (%)
Residents speaking Spanish at home - Native, born elsewhere (%)
Residents speaking Spanish at home - Foreign born (%)
Residents speaking other language at home (%)
Residents speaking other language at home - Born in the United States (%)
Residents speaking other language at home - Native, born elsewhere (%)
Residents speaking other language at home - Foreign born (%)
Marital status - Never married (%)
Marital status - Now married (%)
Marital status - Separated (%)
Marital status - Widowed (%)
Marital status - Divorced (%)
Ancestries Reported - Arab (%)
Ancestries Reported - Czech (%)
Ancestries Reported - Danish (%)
Ancestries Reported - Dutch (%)
Ancestries Reported - English (%)
Ancestries Reported - French (%)
Ancestries Reported - French Canadian (%)
Ancestries Reported - German (%)
Ancestries Reported - Greek (%)
Ancestries Reported - Hungarian (%)
Ancestries Reported - Irish (%)
Ancestries Reported - Italian (%)
Ancestries Reported - Lithuanian (%)
Ancestries Reported - Norwegian (%)
Ancestries Reported - Polish (%)
Ancestries Reported - Portuguese (%)
Ancestries Reported - Russian (%)
Ancestries Reported - Scotch-Irish (%)
Ancestries Reported - Scottish (%)
Ancestries Reported - Slovak (%)
Ancestries Reported - Subsaharan African (%)
Ancestries Reported - Swedish (%)
Ancestries Reported - Swiss (%)
Ancestries Reported - Ukrainian (%)
Ancestries Reported - United States (%)
Ancestries Reported - Welsh (%)
Ancestries Reported - West Indian (%)
Ancestries Reported - Other (%)
Geographical mobility - Same house 1 year ago (%)
Geographical mobility - Same house 1 year ago (%) - White
Geographical mobility - Same house 1 year ago (%) - Black or African American
Geographical mobility - Same house 1 year ago (%) - Asian
Geographical mobility - Same house 1 year ago (%) - Hispanic or Latino
Geographical mobility - Same house 1 year ago (%) - American Indian and Alaska Native
Geographical mobility - Same house 1 year ago (%) - Multirace
Geographical mobility - Same house 1 year ago (%) - Other Race
Geographical mobility - Moved within same county (%)
Geographical mobility - Moved within same county (%) - White
Geographical mobility - Moved within same county (%) - Black or African American
Geographical mobility - Moved within same county (%) - Asian
Geographical mobility - Moved within same county (%) - Hispanic or Latino
Geographical mobility - Moved within same county (%) - American Indian and Alaska Native
Geographical mobility - Moved within same county (%) - Multirace
Geographical mobility - Moved within same county (%) - Other Race
Geographical mobility - Moved from different county within same state (%)
Geographical mobility - Moved from different county within same state (%) - White
Geographical mobility - Moved from different county within same state (%) - Black or African American
Geographical mobility - Moved from different county within same state (%) - Asian
Geographical mobility - Moved from different county within same state (%) - Hispanic or Latino
Geographical mobility - Moved from different county within same state (%) - American Indian and Alaska Native
Geographical mobility - Moved from different county within same state (%) - Multirace
Geographical mobility - Moved from different county within same state (%) - Other Race
Geographical mobility - Moved from different state (%)
Geographical mobility - Moved from different state (%) - White
Geographical mobility - Moved from different state (%) - Black or African American
Geographical mobility - Moved from different state (%) - Asian
Geographical mobility - Moved from different state (%) - Hispanic or Latino
Geographical mobility - Moved from different state (%) - American Indian and Alaska Native
Geographical mobility - Moved from different state (%) - Multirace
Geographical mobility - Moved from different state (%) - Other Race
Geographical mobility - Moved from abroad (%)
Geographical mobility - Moved from abroad (%) - White
Geographical mobility - Moved from abroad (%) - Black or African American
Geographical mobility - Moved from abroad (%) - Asian
Geographical mobility - Moved from abroad (%) - Hispanic or Latino
Geographical mobility - Moved from abroad (%) - American Indian and Alaska Native
Geographical mobility - Moved from abroad (%) - Multirace
Geographical mobility - Moved from abroad (%) - Other Race
Place of birth for the foreign-born population - Ireland (%)
Place of birth for the foreign-born population - Denmark (%)
Place of birth for the foreign-born population - Norway (%)
Place of birth for the foreign-born population - Sweden (%)
Place of birth for the foreign-born population - United Kingdom (%)
Place of birth for the foreign-born population - England (%)
Place of birth for the foreign-born population - Scotland (%)
Place of birth for the foreign-born population - Other Northern Europe (%)
Place of birth for the foreign-born population - Austria (%)
Place of birth for the foreign-born population - Belgium (%)
Place of birth for the foreign-born population - France (%)
Place of birth for the foreign-born population - Germany (%)
Place of birth for the foreign-born population - Netherlands (%)
Place of birth for the foreign-born population - Switzerland (%)
Place of birth for the foreign-born population - Other Western Europe (%)
Place of birth for the foreign-born population - Greece (%)
Place of birth for the foreign-born population - Italy (%)
Place of birth for the foreign-born population - Portugal (%)
Place of birth for the foreign-born population - Spain (%)
Place of birth for the foreign-born population - Other Southern Europe (%)
Place of birth for the foreign-born population - Albania (%)
Place of birth for the foreign-born population - Belarus (%)
Place of birth for the foreign-born population - Bosnia and Herzegovina (%)
Place of birth for the foreign-born population - Bulgaria (%)
Place of birth for the foreign-born population - Croatia (%)
Place of birth for the foreign-born population - Czechoslovakia (%)
Place of birth for the foreign-born population - Hungary (%)
Place of birth for the foreign-born population - Latvia (%)
Place of birth for the foreign-born population - Lithuania (%)
Place of birth for the foreign-born population - North Macedonia (Macedonia) (%)
Place of birth for the foreign-born population - Moldova (%)
Place of birth for the foreign-born population - Poland (%)
Place of birth for the foreign-born population - Romania (%)
Place of birth for the foreign-born population - Russia (%)
Place of birth for the foreign-born population - Serbia (%)
Place of birth for the foreign-born population - Ukraine (%)
Place of birth for the foreign-born population - Other Eastern Europe (%)
Place of birth for the foreign-born population - China (%)
Place of birth for the foreign-born population - Hong Kong (%)
Place of birth for the foreign-born population - Taiwan (%)
Place of birth for the foreign-born population - Japan (%)
Place of birth for the foreign-born population - Korea (%)
Place of birth for the foreign-born population - Other Eastern Asia (%)
Place of birth for the foreign-born population - Afghanistan (%)
Place of birth for the foreign-born population - Bangladesh (%)
Place of birth for the foreign-born population - India (%)
Place of birth for the foreign-born population - Iran (%)
Place of birth for the foreign-born population - Kazakhstan (%)
Place of birth for the foreign-born population - Nepal (%)
Place of birth for the foreign-born population - Pakistan (%)
Place of birth for the foreign-born population - Sri Lanka (%)
Place of birth for the foreign-born population - Uzbekistan (%)
Place of birth for the foreign-born population - Other South Central Asia (%)
Place of birth for the foreign-born population - Burma (%)
Place of birth for the foreign-born population - Cambodia (%)
Place of birth for the foreign-born population - Indonesia (%)
Place of birth for the foreign-born population - Laos (%)
Place of birth for the foreign-born population - Malaysia (%)
Place of birth for the foreign-born population - Philippines (%)
Place of birth for the foreign-born population - Singapore (%)
Place of birth for the foreign-born population - Thailand (%)
Place of birth for the foreign-born population - Vietnam (%)
Place of birth for the foreign-born population - Other South Eastern Asia (%)
Place of birth for the foreign-born population - Armenia (%)
Place of birth for the foreign-born population - Iraq (%)
Place of birth for the foreign-born population - Israel (%)
Place of birth for the foreign-born population - Jordan (%)
Place of birth for the foreign-born population - Kuwait (%)
Place of birth for the foreign-born population - Lebanon (%)
Place of birth for the foreign-born population - Saudi Arabia (%)
Place of birth for the foreign-born population - Syria (%)
Place of birth for the foreign-born population - Turkey (%)
Place of birth for the foreign-born population - Yemen (%)
Place of birth for the foreign-born population - Other Western Asia (%)
Place of birth for the foreign-born population - Eritrea (%)
Place of birth for the foreign-born population - Ethiopia (%)
Place of birth for the foreign-born population - Kenya (%)
Place of birth for the foreign-born population - Somalia (%)
Place of birth for the foreign-born population - Uganda (%)
Place of birth for the foreign-born population - Zimbabwe (%)
Place of birth for the foreign-born population - Other Eastern Africa (%)
Place of birth for the foreign-born population - Cameroon (%)
Place of birth for the foreign-born population - Congo (%)
Place of birth for the foreign-born population - Democratic Republic of Congo (Zaire) (%)
Place of birth for the foreign-born population - Other Middle Africa (%)
Place of birth for the foreign-born population - Egypt (%)
Place of birth for the foreign-born population - Morocco (%)
Place of birth for the foreign-born population - Sudan (%)
Place of birth for the foreign-born population - Other Northern Africa (%)
Place of birth for the foreign-born population - South Africa (%)
Place of birth for the foreign-born population - Other Southern Africa (%)
Place of birth for the foreign-born population - Cabo Verde (%)
Place of birth for the foreign-born population - Ghana (%)
Place of birth for the foreign-born population - Liberia (%)
Place of birth for the foreign-born population - Nigeria (%)
Place of birth for the foreign-born population - Senegal (%)
Place of birth for the foreign-born population - Sierra Leone (%)
Place of birth for the foreign-born population - Other Western Africa (%)
Place of birth for the foreign-born population - Australia (%)
Place of birth for the foreign-born population - New Zealand (%)
Place of birth for the foreign-born population - Fiji (%)
Place of birth for the foreign-born population - Micronesia (%)
Place of birth for the foreign-born population - Bahamas (%)
Place of birth for the foreign-born population - Barbados (%)
Place of birth for the foreign-born population - Cuba (%)
Place of birth for the foreign-born population - Dominica (%)
Place of birth for the foreign-born population - Dominican Republic (%)
Place of birth for the foreign-born population - Grenada (%)
Place of birth for the foreign-born population - Haiti (%)
Place of birth for the foreign-born population - Jamaica (%)
Place of birth for the foreign-born population - St. Vincent and the Grenadines (%)
Place of birth for the foreign-born population - Trinidad and Tobago (%)
Place of birth for the foreign-born population - West Indies (%)
Place of birth for the foreign-born population - Other Caribbean (%)
Place of birth for the foreign-born population - Belize (%)
Place of birth for the foreign-born population - Costa Rica (%)
Place of birth for the foreign-born population - El Salvador (%)
Place of birth for the foreign-born population - Guatemala (%)
Place of birth for the foreign-born population - Honduras (%)
Place of birth for the foreign-born population - Mexico (%)
Place of birth for the foreign-born population - Nicaragua (%)
Place of birth for the foreign-born population - Panama (%)
Place of birth for the foreign-born population - Other Central America (%)
Place of birth for the foreign-born population - Argentina (%)
Place of birth for the foreign-born population - Bolivia (%)
Place of birth for the foreign-born population - Brazil (%)
Place of birth for the foreign-born population - Chile (%)
Place of birth for the foreign-born population - Colombia (%)
Place of birth for the foreign-born population - Ecuador (%)
Place of birth for the foreign-born population - Guyana (%)
Place of birth for the foreign-born population - Peru (%)
Place of birth for the foreign-born population - Uruguay (%)
Place of birth for the foreign-born population - Venezuela (%)
Place of birth for the foreign-born population - Other South America (%)
Place of birth for the foreign-born population - Canada (%)
Place of birth for the foreign-born population - Other Northern America (%)
Place of birth for the foreign-born population - Other (%)
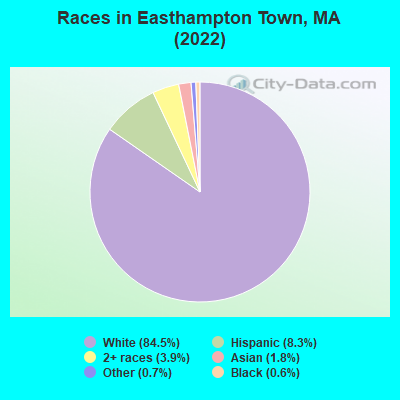
According to 2022 data, the most numerous races in Easthampton Town, MA are White alone (14,397 residents), Hispanic (1,415 residents), and Asian alone (313 residents). 88.9% of Easthampton Town residents speak English at home.
Race distribution in Easthampton Town 14,397 84.5% White alone 1,415 8.3% Hispanic 668 3.9% Two or more races 313 1.8% Asian alone 115 0.7% Other race alone 97 0.6% Black alone
2000 2022
5,198,359 81.9% White alone 428,729 6.8% Hispanic 318,329 5.0% Black alone 236,786 3.7% Asian alone 110,338 1.7% Two or more races 43,586 0.7% Other race alone 11,264 0.2% American Indian alone 1,706 0.03% Native Hawaiian and Other
4,676,627 67.0% White alone 911,038 13.0% Hispanic 501,463 7.2% Asian alone 459,740 6.6% Black alone 341,889 4.9% Two or more races 84,403 1.2% Other race alone 5,838 0.08% American Indian alone 976 0.01% Native Hawaiian and Other
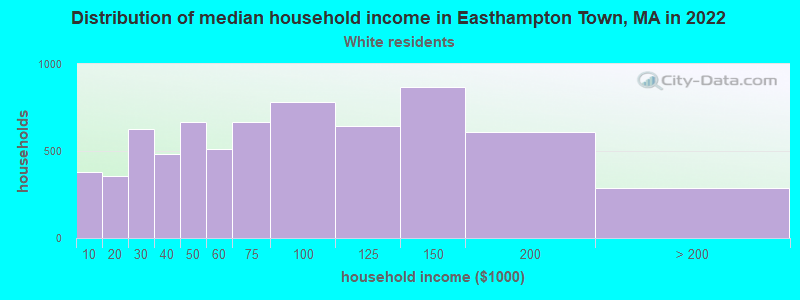
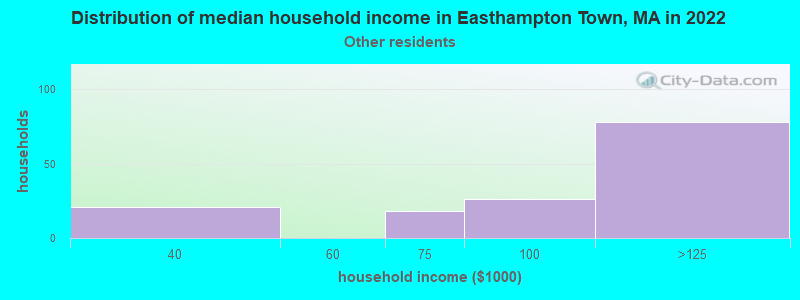
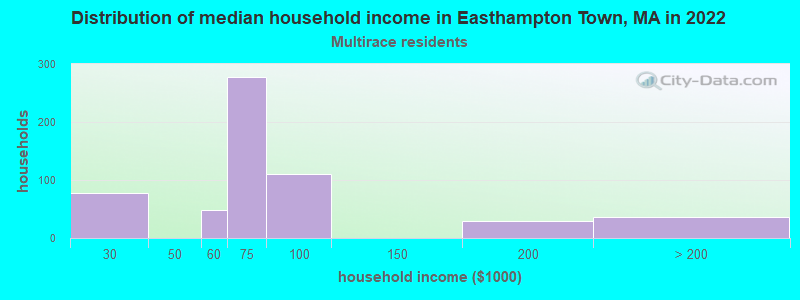
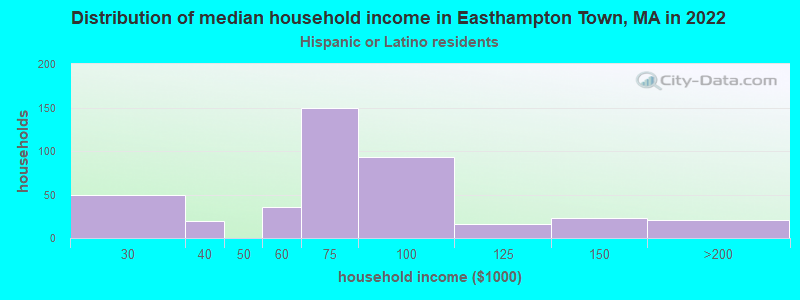
Income and house value in Easthampton Town Median household income in 2022 $65,162 White non-Hispanic householders$114,194 Asian householders$121,529 Some other race householders$49,256 Two or more races householders$57,919 Hispanic or Latino race householders
Median age by race in Easthampton Town
47.0 Median age for White residents47.4 46.7 53.5 Median age for Black or African American residents37.2 -666,666,666.0 -871,892,924.6 Median age for American Indian / Alaska Native residents-606,870,228.4 -657,223,795.4 63.7 Median age for Asian residents33.9 61.7 -514,227,641.8 Median age for Native Hawaiian / Pacific Islander residents-666,666,666.0 -508,717,948.2 51.0 Median age for Other race residents13.3 69.8 32.0 Median age for Two or more races residents31.4 24.8 47.4 Median age for White alone residents47.2 47.4 30.5 Median age for Hispanic or Latino residents29.6 38.3
Owner/renter occupied households by race in Easthampton Town
House owners and renters - White residents 4,213 60.5% Owner occupied2,749 39.5% Renter occupiedHouse owners and renters - Black or African American residents 23 23.5% Owner occupied76 76.5% Renter occupiedHouse owners and renters - Asian residents 107 100.0% Owner occupiedHouse owners and renters - Other race residents 61 52.2% Owner occupied56 47.8% Renter occupiedHouse owners and renters - Two or more races residents 481 60.5% Owner occupied314 39.5% Renter occupiedHouse owners and renters - White alone residents 4,187 60.3% Owner occupied2,754 39.7% Renter occupiedHouse owners and renters - Hispanic or Latino residents 343 61.4% Owner occupied216 38.6% Renter occupied
Language usage in Easthampton Town
English speakers - Total 88.9% of residents of Easthampton Town speak English at home.
4.9% of residents speak Spanish at home 599 74.2% Speak English very well208 25.8% Speak English less than very well6.4% of residents speak other language at home 598 56.0% Speak English very well469 44.0% Speak English less than very well
English speakers - Born in the United States 95.1% of residents of Easthampton Town speak English at home.
4.9% of residents speak Spanish at home 193 100.0% Speak English very well1.0% of residents speak other language at home 18 47.4% Speak English very well20 52.6% Speak English less than very well
English speakers - Native, born elsewhere 59.7% of residents of Easthampton Town speak English at home.
43.8% of residents speak Spanish at home 57 90.5% Speak English very well6 9.5% Speak English less than very well10.4% of residents speak other language at home 15 100.0% Speak English very well
English speakers - Foreign-born 22.3% of residents of Easthampton Town speak English at home.
28.6% of residents speak Spanish at home 133 35.1% Speak English very well246 64.9% Speak English less than very well50.4% of residents speak other language at home 328 49.0% Speak English very well341 51.0% Speak English less than very well
White (Caucasian) - Speak only English Native:
98.0% (13,290)Foreign-born:
35.2% (179)
White (Caucasian) - Speak another language Native:
2.2% (297)Foreign-born:
64.3% (326)
Asian - Speak another language Native:
84.0% (46)Foreign-born:
87.0% (231)
Other race - Speak another language Native:
30.3% (67)Foreign-born:
100.0% (76)
Two or more races - Speak only English Native:
67.0% (909)Foreign-born:
14.5% (64)
Two or more races - Speak another language Native:
26.2% (356)Foreign-born:
80.4% (352)
White alone - Speak only English Native:
97.6% (13,193)Foreign-born:
36.1% (189)
White alone - Speak another language Native:
2.4% (330)Foreign-born:
63.8% (335)
Hispanic or Latino - Speak another language Native:
30.1% (298)Foreign-born:
100.0% (341)
Foreign-born residents in Easthampton Town
Marital status for residents in Easthampton Town Marital status - White (Caucasian) population 15 years and over
Males 30.0% Never married51.3% Now married1.5% Separated3.2% Widowed13.9% DivorcedFemales 30.6% Never married45.0% Now married2.7% Separated8.4% Widowed13.2% DivorcedWomen who gave birth in the past 12 months Now married:
68.8% (36)Unmarried:
31.3% (16)
Women who did not give birth in the past 12 months Now married:
37.6% (1,247)Unmarried:
62.4% (2,073)
Marital status - Black or African American population 15 years and over
Males 43.7% Never married31.0% Now married25.4% Separated0.0% Widowed0.0% DivorcedFemales 31.6% Never married0.0% Now married0.0% Separated68.4% Widowed0.0% DivorcedWomen who did not give birth in the past 12 months Now married:
0.0% (0)Unmarried:
100.0% (19)
Marital status - Asian population 15 years and over
Males 19.6% Never married80.4% Now married0.0% Separated0.0% Widowed0.0% DivorcedFemales 0.0% Never married100.0% Now married0.0% Separated0.0% Widowed0.0% DivorcedWomen who did not give birth in the past 12 months Now married:
100.0% (27)Unmarried:
0.0% (0)
Marital status - Other race population 15 years and over
Males 0.0% Never married32.9% Now married0.0% Separated15.2% Widowed51.9% DivorcedFemales 24.4% Never married29.8% Now married0.0% Separated0.0% Widowed45.8% DivorcedWomen who did not give birth in the past 12 months Now married:
44.6% (40)Unmarried:
55.4% (50)
Marital status - Two or more races population 15 years and over
Males 45.0% Never married36.4% Now married0.2% Separated0.0% Widowed18.4% DivorcedFemales 61.8% Never married26.6% Now married0.0% Separated0.0% Widowed11.7% DivorcedWomen who did not give birth in the past 12 months Now married:
15.1% (42)Unmarried:
84.9% (238)
Marital status - White alone, not Hispanic / Latino population 15 years and over
Males 29.5% Never married51.6% Now married1.5% Separated3.2% Widowed14.1% DivorcedFemales 30.6% Never married45.0% Now married2.8% Separated8.5% Widowed13.2% DivorcedWomen who gave birth in the past 12 months Now married:
68.8% (36)Unmarried:
31.2% (16)
Women who did not give birth in the past 12 months Now married:
37.3% (1,224)Unmarried:
62.7% (2,057)
Marital status - Hispanic or Latino population 15 years and over
Males 42.1% Never married31.6% Now married0.2% Separated2.1% Widowed24.0% DivorcedFemales 42.8% Never married35.0% Now married0.0% Separated0.0% Widowed22.2% DivorcedWomen who did not give birth in the past 12 months Now married:
31.2% (71)Unmarried:
68.8% (156)
Ancestries in Easthampton Town
708 12.9% Irish552 10.0% Polish492 8.9% American473 8.6% English473 8.6% French447 8.1% French Canadian184 3.3% Italian152 2.8% German147 2.7% Moroccan125 2.3% Portuguese116 2.1% Yugoslavian103 1.9% European99 1.8% Eastern European66 1.2% British58 1.1% Scottish56 1.0% Turkish45 0.8% Ukrainian44 0.8% Canadian34 0.6% Swedish31 0.6% Norwegian28 0.5% Syrian20 0.4% Brazilian16 0.3% Armenian16 0.3% Northern European14 0.3% Russian13 0.2% Iranian12 0.2% Scotch-Irish10 0.2% Scandinavian4 0.07% Romanian
Children Nativity (place of birth) in Easthampton Town
Children under 6 years - Living with two parents Both parents native 317 100.0% NativeBoth parents foreign-born 21 100.0% NativeOne native, one foreign-born parent 48 100.0% NativeChildren under 6 years - Living with one parent Native parent 124 100.0% NativeChildren 6 to 17 years - Living with two parents Both parents native 684 95.1% Native36 4.9% Foreign-bornBoth parents foreign-born 95 100.0% NativeOne native, one foreign-born parent 53 100.0% NativeChildren 6 to 17 years - Living with one parent Native parent 973 100.0% NativeForeign-born parent 36 50.5% Native35 49.5% Foreign-born
Grandparents responsible for own grandchildren in Easthampton Town
Grandparents (30 to 59 years) White / Caucasian 22 100.0% Not responsible for grandchildrenOther race 15 100.0% Responsible for grandchildrenWhite alone, not Hispanic / Latino 24 100.0% Not responsible for grandchildrenHispanic or Latino 16 100.0% Responsible for grandchildrenGrandparents (60 years and over) White / Caucasian 91 45.0% Responsible for grandchildren111 55.0% Not responsible for grandchildrenWhite alone, not Hispanic / Latino 105 46.9% Responsible for grandchildren119 53.1% Not responsible for grandchildren