Races in Eastchester, New York (NY) Detailed Stats
Data:
Races - White alone (%)
Races - White alone (% change since 2000)
Races - Black alone (%)
Races - Black alone (% change since 2000)
Races - American Indian alone (%)
Races - American Indian alone (% change since 2000)
Races - Asian alone (%)
Races - Asian alone (% change since 2000)
Races - Hispanic (%)
Races - Hispanic (% change since 2000)
Races - Native Hawaiian and Other Pacific Islander alone (%)
Races - Native Hawaiian and Other Pacific Islander alone (% change since 2000)
Races - Two or more races(%)
Races - Two or more races(% change since 2000)
Races - Other race alone (%)
Races - Other race alone (% change since 2000)
Racial diversity
Place of birth - Born in state of residence (%)
Place of birth - Born in state of residence (%) - White
Place of birth - Born in state of residence (%) - Black or African American
Place of birth - Born in state of residence (%) - Asian
Place of birth - Born in state of residence (%) - Hispanic or Latino
Place of birth - Born in state of residence (%) - American Indian and Alaska Native
Place of birth - Born in state of residence (%) - Multirace
Place of birth - Born in state of residence (%) - Other Race
Place of birth - Born in other state (%)
Place of birth - Born in other state (%) - White
Place of birth - Born in other state (%) - Black or African American
Place of birth - Born in other state (%) - Asian
Place of birth - Born in other state (%) - Hispanic or Latino
Place of birth - Born in other state (%) - American Indian and Alaska Native
Place of birth - Born in other state (%) - Multirace
Place of birth - Born in other state (%) - Other Race
Place of birth - Native, outside of US (%)
Place of birth - Native, outside of US (%) - White
Place of birth - Native, outside of US (%) - Black or African American
Place of birth - Native, outside of US (%) - Asian
Place of birth - Native, outside of US (%) - Hispanic or Latino
Place of birth - Native, outside of US (%) - American Indian and Alaska Native
Place of birth - Native, outside of US (%) - Multirace
Place of birth - Native, outside of US (%) - Other Race
Place of birth - Foreign born (%)
Place of birth - Foreign born (%) - White
Place of birth - Foreign born (%) - Black or African American
Place of birth - Foreign born (%) - Asian
Place of birth - Foreign born (%) - Hispanic or Latino
Place of birth - Foreign born (%) - American Indian and Alaska Native
Place of birth - Foreign born (%) - Multirace
Place of birth - Foreign born (%) - Other Race
Residents speaking English at home (%)
Residents speaking English at home - Born in the United States (%)
Residents speaking English at home - Native, born elsewhere (%)
Residents speaking English at home - Foreign born (%)
Residents speaking Spanish at home (%)
Residents speaking Spanish at home - Born in the United States (%)
Residents speaking Spanish at home - Native, born elsewhere (%)
Residents speaking Spanish at home - Foreign born (%)
Residents speaking other language at home (%)
Residents speaking other language at home - Born in the United States (%)
Residents speaking other language at home - Native, born elsewhere (%)
Residents speaking other language at home - Foreign born (%)
Marital status - Never married (%)
Marital status - Now married (%)
Marital status - Separated (%)
Marital status - Widowed (%)
Marital status - Divorced (%)
Ancestries Reported - Arab (%)
Ancestries Reported - Czech (%)
Ancestries Reported - Danish (%)
Ancestries Reported - Dutch (%)
Ancestries Reported - English (%)
Ancestries Reported - French (%)
Ancestries Reported - French Canadian (%)
Ancestries Reported - German (%)
Ancestries Reported - Greek (%)
Ancestries Reported - Hungarian (%)
Ancestries Reported - Irish (%)
Ancestries Reported - Italian (%)
Ancestries Reported - Lithuanian (%)
Ancestries Reported - Norwegian (%)
Ancestries Reported - Polish (%)
Ancestries Reported - Portuguese (%)
Ancestries Reported - Russian (%)
Ancestries Reported - Scotch-Irish (%)
Ancestries Reported - Scottish (%)
Ancestries Reported - Slovak (%)
Ancestries Reported - Subsaharan African (%)
Ancestries Reported - Swedish (%)
Ancestries Reported - Swiss (%)
Ancestries Reported - Ukrainian (%)
Ancestries Reported - United States (%)
Ancestries Reported - Welsh (%)
Ancestries Reported - West Indian (%)
Ancestries Reported - Other (%)
Geographical mobility - Same house 1 year ago (%)
Geographical mobility - Same house 1 year ago (%) - White
Geographical mobility - Same house 1 year ago (%) - Black or African American
Geographical mobility - Same house 1 year ago (%) - Asian
Geographical mobility - Same house 1 year ago (%) - Hispanic or Latino
Geographical mobility - Same house 1 year ago (%) - American Indian and Alaska Native
Geographical mobility - Same house 1 year ago (%) - Multirace
Geographical mobility - Same house 1 year ago (%) - Other Race
Geographical mobility - Moved within same county (%)
Geographical mobility - Moved within same county (%) - White
Geographical mobility - Moved within same county (%) - Black or African American
Geographical mobility - Moved within same county (%) - Asian
Geographical mobility - Moved within same county (%) - Hispanic or Latino
Geographical mobility - Moved within same county (%) - American Indian and Alaska Native
Geographical mobility - Moved within same county (%) - Multirace
Geographical mobility - Moved within same county (%) - Other Race
Geographical mobility - Moved from different county within same state (%)
Geographical mobility - Moved from different county within same state (%) - White
Geographical mobility - Moved from different county within same state (%) - Black or African American
Geographical mobility - Moved from different county within same state (%) - Asian
Geographical mobility - Moved from different county within same state (%) - Hispanic or Latino
Geographical mobility - Moved from different county within same state (%) - American Indian and Alaska Native
Geographical mobility - Moved from different county within same state (%) - Multirace
Geographical mobility - Moved from different county within same state (%) - Other Race
Geographical mobility - Moved from different state (%)
Geographical mobility - Moved from different state (%) - White
Geographical mobility - Moved from different state (%) - Black or African American
Geographical mobility - Moved from different state (%) - Asian
Geographical mobility - Moved from different state (%) - Hispanic or Latino
Geographical mobility - Moved from different state (%) - American Indian and Alaska Native
Geographical mobility - Moved from different state (%) - Multirace
Geographical mobility - Moved from different state (%) - Other Race
Geographical mobility - Moved from abroad (%)
Geographical mobility - Moved from abroad (%) - White
Geographical mobility - Moved from abroad (%) - Black or African American
Geographical mobility - Moved from abroad (%) - Asian
Geographical mobility - Moved from abroad (%) - Hispanic or Latino
Geographical mobility - Moved from abroad (%) - American Indian and Alaska Native
Geographical mobility - Moved from abroad (%) - Multirace
Geographical mobility - Moved from abroad (%) - Other Race
Place of birth for the foreign-born population - Ireland (%)
Place of birth for the foreign-born population - Denmark (%)
Place of birth for the foreign-born population - Norway (%)
Place of birth for the foreign-born population - Sweden (%)
Place of birth for the foreign-born population - United Kingdom (%)
Place of birth for the foreign-born population - England (%)
Place of birth for the foreign-born population - Scotland (%)
Place of birth for the foreign-born population - Other Northern Europe (%)
Place of birth for the foreign-born population - Austria (%)
Place of birth for the foreign-born population - Belgium (%)
Place of birth for the foreign-born population - France (%)
Place of birth for the foreign-born population - Germany (%)
Place of birth for the foreign-born population - Netherlands (%)
Place of birth for the foreign-born population - Switzerland (%)
Place of birth for the foreign-born population - Other Western Europe (%)
Place of birth for the foreign-born population - Greece (%)
Place of birth for the foreign-born population - Italy (%)
Place of birth for the foreign-born population - Portugal (%)
Place of birth for the foreign-born population - Spain (%)
Place of birth for the foreign-born population - Other Southern Europe (%)
Place of birth for the foreign-born population - Albania (%)
Place of birth for the foreign-born population - Belarus (%)
Place of birth for the foreign-born population - Bosnia and Herzegovina (%)
Place of birth for the foreign-born population - Bulgaria (%)
Place of birth for the foreign-born population - Croatia (%)
Place of birth for the foreign-born population - Czechoslovakia (%)
Place of birth for the foreign-born population - Hungary (%)
Place of birth for the foreign-born population - Latvia (%)
Place of birth for the foreign-born population - Lithuania (%)
Place of birth for the foreign-born population - North Macedonia (Macedonia) (%)
Place of birth for the foreign-born population - Moldova (%)
Place of birth for the foreign-born population - Poland (%)
Place of birth for the foreign-born population - Romania (%)
Place of birth for the foreign-born population - Russia (%)
Place of birth for the foreign-born population - Serbia (%)
Place of birth for the foreign-born population - Ukraine (%)
Place of birth for the foreign-born population - Other Eastern Europe (%)
Place of birth for the foreign-born population - China (%)
Place of birth for the foreign-born population - Hong Kong (%)
Place of birth for the foreign-born population - Taiwan (%)
Place of birth for the foreign-born population - Japan (%)
Place of birth for the foreign-born population - Korea (%)
Place of birth for the foreign-born population - Other Eastern Asia (%)
Place of birth for the foreign-born population - Afghanistan (%)
Place of birth for the foreign-born population - Bangladesh (%)
Place of birth for the foreign-born population - India (%)
Place of birth for the foreign-born population - Iran (%)
Place of birth for the foreign-born population - Kazakhstan (%)
Place of birth for the foreign-born population - Nepal (%)
Place of birth for the foreign-born population - Pakistan (%)
Place of birth for the foreign-born population - Sri Lanka (%)
Place of birth for the foreign-born population - Uzbekistan (%)
Place of birth for the foreign-born population - Other South Central Asia (%)
Place of birth for the foreign-born population - Burma (%)
Place of birth for the foreign-born population - Cambodia (%)
Place of birth for the foreign-born population - Indonesia (%)
Place of birth for the foreign-born population - Laos (%)
Place of birth for the foreign-born population - Malaysia (%)
Place of birth for the foreign-born population - Philippines (%)
Place of birth for the foreign-born population - Singapore (%)
Place of birth for the foreign-born population - Thailand (%)
Place of birth for the foreign-born population - Vietnam (%)
Place of birth for the foreign-born population - Other South Eastern Asia (%)
Place of birth for the foreign-born population - Armenia (%)
Place of birth for the foreign-born population - Iraq (%)
Place of birth for the foreign-born population - Israel (%)
Place of birth for the foreign-born population - Jordan (%)
Place of birth for the foreign-born population - Kuwait (%)
Place of birth for the foreign-born population - Lebanon (%)
Place of birth for the foreign-born population - Saudi Arabia (%)
Place of birth for the foreign-born population - Syria (%)
Place of birth for the foreign-born population - Turkey (%)
Place of birth for the foreign-born population - Yemen (%)
Place of birth for the foreign-born population - Other Western Asia (%)
Place of birth for the foreign-born population - Eritrea (%)
Place of birth for the foreign-born population - Ethiopia (%)
Place of birth for the foreign-born population - Kenya (%)
Place of birth for the foreign-born population - Somalia (%)
Place of birth for the foreign-born population - Uganda (%)
Place of birth for the foreign-born population - Zimbabwe (%)
Place of birth for the foreign-born population - Other Eastern Africa (%)
Place of birth for the foreign-born population - Cameroon (%)
Place of birth for the foreign-born population - Congo (%)
Place of birth for the foreign-born population - Democratic Republic of Congo (Zaire) (%)
Place of birth for the foreign-born population - Other Middle Africa (%)
Place of birth for the foreign-born population - Egypt (%)
Place of birth for the foreign-born population - Morocco (%)
Place of birth for the foreign-born population - Sudan (%)
Place of birth for the foreign-born population - Other Northern Africa (%)
Place of birth for the foreign-born population - South Africa (%)
Place of birth for the foreign-born population - Other Southern Africa (%)
Place of birth for the foreign-born population - Cabo Verde (%)
Place of birth for the foreign-born population - Ghana (%)
Place of birth for the foreign-born population - Liberia (%)
Place of birth for the foreign-born population - Nigeria (%)
Place of birth for the foreign-born population - Senegal (%)
Place of birth for the foreign-born population - Sierra Leone (%)
Place of birth for the foreign-born population - Other Western Africa (%)
Place of birth for the foreign-born population - Australia (%)
Place of birth for the foreign-born population - New Zealand (%)
Place of birth for the foreign-born population - Fiji (%)
Place of birth for the foreign-born population - Micronesia (%)
Place of birth for the foreign-born population - Bahamas (%)
Place of birth for the foreign-born population - Barbados (%)
Place of birth for the foreign-born population - Cuba (%)
Place of birth for the foreign-born population - Dominica (%)
Place of birth for the foreign-born population - Dominican Republic (%)
Place of birth for the foreign-born population - Grenada (%)
Place of birth for the foreign-born population - Haiti (%)
Place of birth for the foreign-born population - Jamaica (%)
Place of birth for the foreign-born population - St. Vincent and the Grenadines (%)
Place of birth for the foreign-born population - Trinidad and Tobago (%)
Place of birth for the foreign-born population - West Indies (%)
Place of birth for the foreign-born population - Other Caribbean (%)
Place of birth for the foreign-born population - Belize (%)
Place of birth for the foreign-born population - Costa Rica (%)
Place of birth for the foreign-born population - El Salvador (%)
Place of birth for the foreign-born population - Guatemala (%)
Place of birth for the foreign-born population - Honduras (%)
Place of birth for the foreign-born population - Mexico (%)
Place of birth for the foreign-born population - Nicaragua (%)
Place of birth for the foreign-born population - Panama (%)
Place of birth for the foreign-born population - Other Central America (%)
Place of birth for the foreign-born population - Argentina (%)
Place of birth for the foreign-born population - Bolivia (%)
Place of birth for the foreign-born population - Brazil (%)
Place of birth for the foreign-born population - Chile (%)
Place of birth for the foreign-born population - Colombia (%)
Place of birth for the foreign-born population - Ecuador (%)
Place of birth for the foreign-born population - Guyana (%)
Place of birth for the foreign-born population - Peru (%)
Place of birth for the foreign-born population - Uruguay (%)
Place of birth for the foreign-born population - Venezuela (%)
Place of birth for the foreign-born population - Other South America (%)
Place of birth for the foreign-born population - Canada (%)
Place of birth for the foreign-born population - Other Northern America (%)
Place of birth for the foreign-born population - Other (%)
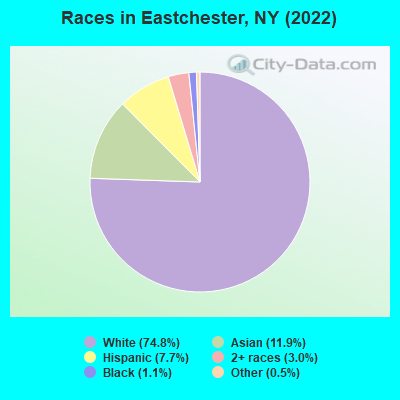
According to 2022 data, the most numerous races in Eastchester, NY are White alone (15,322 residents), Hispanic (1,585 residents), and Black alone (231 residents). 71.9% of Eastchester residents speak English at home. 20.3% of Eastchester, NY residents are foreign-born (9.3% born in Asia, 7.5% born in Europe, 3.1% born in Latin America), which is 8.2% less than the foreign-born rate of 22.0% across the entire state of New York.
Race distribution in Eastchester
2000 2022
11,760,981 62.0% White alone 2,867,583 15.1% Hispanic 2,812,623 14.8% Black alone 1,035,926 5.5% Asian alone 366,116 1.9% Two or more races 75,499 0.4% Other race alone 52,499 0.3% American Indian alone 5,230 0.03% Native Hawaiian and Other
10,408,933 52.9% White alone 3,867,299 19.7% Hispanic 2,633,840 13.4% Black alone 1,776,286 9.0% Asian alone 732,670 3.7% Two or more races 216,110 1.1% Other race alone 35,082 0.2% American Indian alone 6,931 0.04% Native Hawaiian and Other
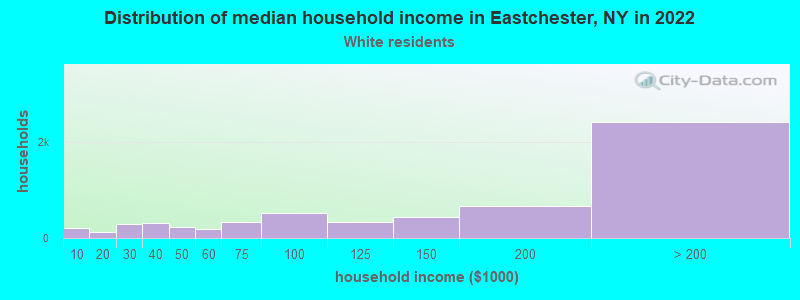
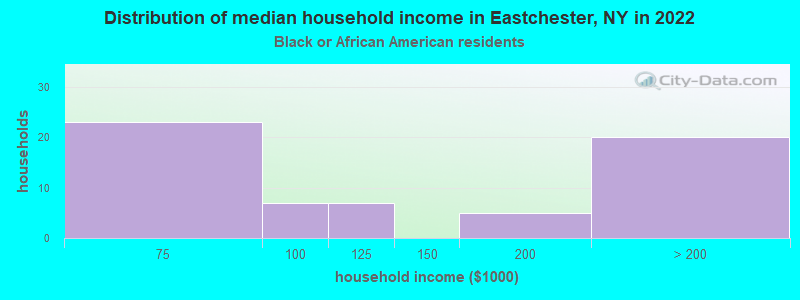
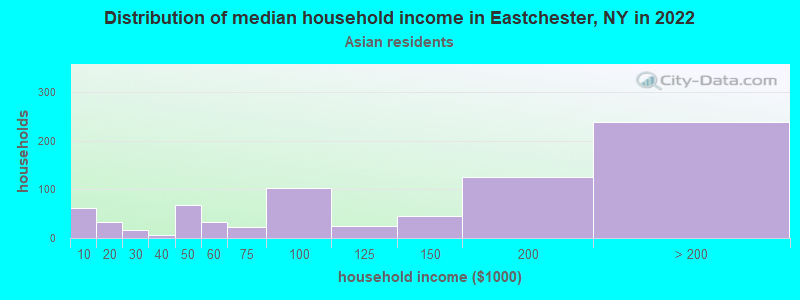
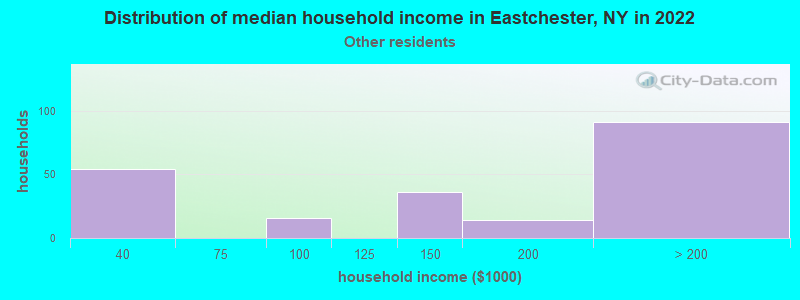
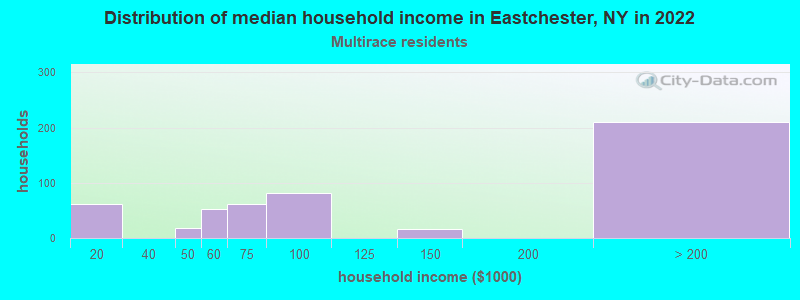
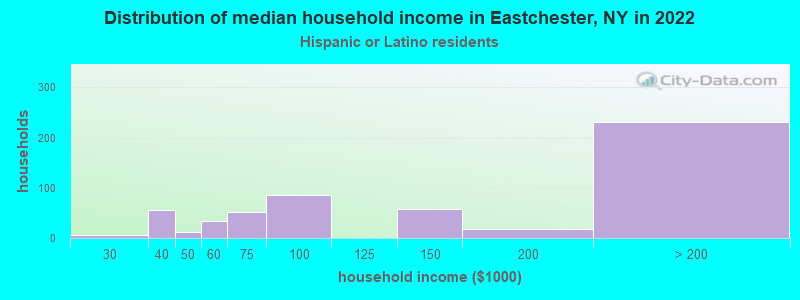
Income and house value in Eastchester Median household income in 2022 $147,122 White non-Hispanic householders$126,867 Asian householders$135,068 Some other race householders$129,477 Hispanic or Latino race householdersMedian 2022 house value $934,845 White Non-Hispanic householders$751,720 Black or African American householders$885,269 American Indian or Alaska Native householders $878,693 Asian householders$885,269 Some other race householdersover $1,000,000 Two or more races householders$779,796 Hispanic or Latino householders
Median age by race in Eastchester
47.5 Median age for White residents46.7 47.9 32.2 Median age for Black or African American residents41.2 7.1 -641,441,440.8 Median age for American Indian / Alaska Native residents-664,804,468.6 -554,999,999.4 44.8 Median age for Asian residents42.4 46.1 -487,992,314.6 Median age for Native Hawaiian / Pacific Islander residents-477,502,295.2 -666,666,666.0 41.6 Median age for Other race residents45.3 40.1 27.0 Median age for Two or more races residents26.0 29.4 47.1 Median age for White alone residents46.2 48.1 29.5 Median age for Hispanic or Latino residents25.4 35.6
Owner/renter occupied households by race in Eastchester
House owners and renters - White residents 5,188 84.5% Owner occupied954 15.5% Renter occupiedHouse owners and renters - Black or African American residents 6 8.6% Owner occupied64 91.4% Renter occupiedHouse owners and renters - Asian residents 499 65.6% Owner occupied262 34.4% Renter occupiedHouse owners and renters - Other race residents 162 74.8% Owner occupied55 25.2% Renter occupiedHouse owners and renters - Two or more races residents 289 57.1% Owner occupied217 42.9% Renter occupiedHouse owners and renters - White alone residents 5,279 83.8% Owner occupied1,024 16.2% Renter occupiedHouse owners and renters - Hispanic or Latino residents 400 71.3% Owner occupied161 28.7% Renter occupied
Language usage in Eastchester
English speakers - Total 71.9% of residents of Eastchester speak English at home.
6.3% of residents speak Spanish at home 947 77.4% Speak English very well277 22.6% Speak English less than very well21.1% of residents speak other language at home 2,413 59.4% Speak English very well1,652 40.6% Speak English less than very well
English speakers - Born in the United States 81.7% of residents of Eastchester speak English at home.
10.2% of residents speak Spanish at home 178 79.5% Speak English very well46 20.5% Speak English less than very well5.8% of residents speak other language at home 102 81.0% Speak English very well24 19.0% Speak English less than very well
English speakers - Native, born elsewhere 34.4% of residents of Eastchester speak English at home.
38.8% of residents speak Spanish at home 33 26.8% Speak English very well90 73.2% Speak English less than very well23.7% of residents speak other language at home 75 100.0% Speak English very well
English speakers - Foreign-born 19.4% of residents of Eastchester speak English at home.
8.5% of residents speak Spanish at home 271 76.3% Speak English very well84 23.7% Speak English less than very well70.7% of residents speak other language at home 1,408 47.8% Speak English very well1,539 52.2% Speak English less than very well
White (Caucasian) - Speak only English Native:
93.9% (11,881)Foreign-born:
37.0% (547)
White (Caucasian) - Speak another language Native:
6.7% (850)Foreign-born:
63.0% (932)
Asian - Speak only English Native:
54.6% (287)Foreign-born:
8.0% (147)
Asian - Speak another language Native:
45.4% (239)Foreign-born:
91.3% (1,672)
Other race - Speak only English Native:
23.3% (56)Foreign-born:
7.0% (9)
Other race - Speak another language Native:
77.2% (186)Foreign-born:
92.2% (121)
Two or more races - Speak only English Native:
40.2% (492)Foreign-born:
14.7% (42)
Two or more races - Speak another language Native:
59.0% (722)Foreign-born:
85.0% (242)
White alone - Speak only English Native:
92.6% (11,906)Foreign-born:
31.8% (528)
White alone - Speak another language Native:
7.4% (951)Foreign-born:
66.8% (1,108)
Hispanic or Latino - Speak only English Native:
29.4% (321)Foreign-born:
11.6% (41)
Hispanic or Latino - Speak another language Native:
71.4% (781)Foreign-born:
89.4% (314)
Foreign-born residents in Eastchester 4,164 residents are foreign born (9.3% Asia , 7.5% Europe , 3.1% Latin America ).
This city:
20.3%New York:
22.6%
Marital status for residents in Eastchester Marital status - White (Caucasian) population 15 years and over
Males 27.0% Never married64.1% Now married0.2% Separated3.0% Widowed5.7% DivorcedFemales 27.4% Never married51.5% Now married0.6% Separated11.9% Widowed8.6% DivorcedWomen who gave birth in the past 12 months Now married:
100.0% (149)Unmarried:
0.0% (0)
Women who did not give birth in the past 12 months Now married:
46.1% (1,286)Unmarried:
53.9% (1,505)
Marital status - Black or African American population 15 years and over
Males 51.1% Never married48.9% Now married0.0% Separated0.0% Widowed0.0% DivorcedFemales 36.4% Never married63.6% Now married0.0% Separated0.0% Widowed0.0% DivorcedWomen who did not give birth in the past 12 months Now married:
80.0% (8)Unmarried:
20.0% (2)
Marital status - Asian population 15 years and over
Males 19.2% Never married73.2% Now married0.0% Separated1.3% Widowed6.3% DivorcedFemales 15.7% Never married80.9% Now married0.3% Separated2.0% Widowed0.9% DivorcedWomen who gave birth in the past 12 months Now married:
100.0% (8)Unmarried:
0.0% (0)
Women who did not give birth in the past 12 months Now married:
73.1% (491)Unmarried:
26.9% (180)
Marital status - Other race population 15 years and over
Males 0.0% Never married64.7% Now married0.0% Separated0.0% Widowed35.3% DivorcedFemales 0.0% Never married68.4% Now married0.0% Separated0.0% Widowed31.6% DivorcedWomen who gave birth in the past 12 months Now married:
100.0% (29)Unmarried:
0.0% (0)
Women who did not give birth in the past 12 months Now married:
86.4% (58)Unmarried:
13.6% (9)
Marital status - Two or more races population 15 years and over
Males 49.0% Never married40.8% Now married0.0% Separated0.0% Widowed10.2% DivorcedFemales 38.4% Never married46.9% Now married0.0% Separated0.0% Widowed14.7% DivorcedWomen who did not give birth in the past 12 months Now married:
33.2% (84)Unmarried:
66.8% (168)
Marital status - White alone, not Hispanic / Latino population 15 years and over
Males 26.3% Never married65.3% Now married0.2% Separated3.0% Widowed5.1% DivorcedFemales 27.5% Never married51.5% Now married0.6% Separated11.9% Widowed8.5% DivorcedWomen who gave birth in the past 12 months Now married:
100.0% (159)Unmarried:
0.0% (0)
Women who did not give birth in the past 12 months Now married:
45.7% (1,327)Unmarried:
54.3% (1,578)
Marital status - Hispanic or Latino population 15 years and over
Males 43.2% Never married38.9% Now married0.0% Separated0.0% Widowed18.0% DivorcedFemales 26.5% Never married49.4% Now married0.0% Separated1.6% Widowed22.5% DivorcedWomen who gave birth in the past 12 months Now married:
100.0% (26)Unmarried:
0.0% (0)
Women who did not give birth in the past 12 months Now married:
43.2% (102)Unmarried:
56.8% (134)
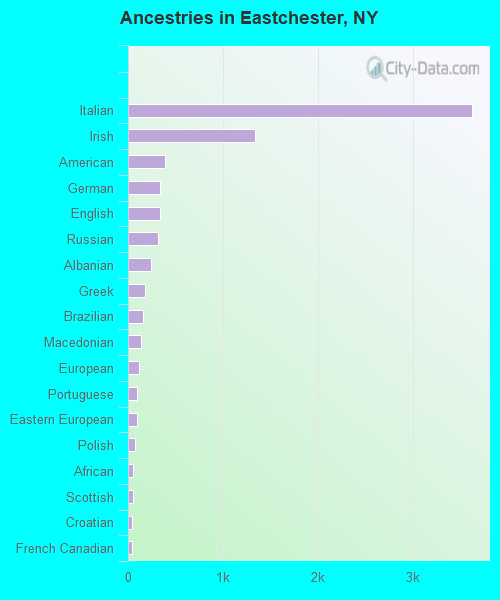
Ancestries in Eastchester
3,620 33.9% Italian1,337 12.5% Irish393 3.7% American339 3.2% German334 3.1% English312 2.9% Russian247 2.3% Albanian177 1.7% Greek159 1.5% Brazilian137 1.3% Macedonian112 1.0% European93 0.9% Portuguese90 0.8% Eastern European78 0.7% Polish48 0.4% African48 0.4% Scottish47 0.4% Croatian47 0.4% French Canadian31 0.3% Austrian25 0.2% Romanian25 0.2% Czech22 0.2% Nigerian18 0.2% Ukrainian17 0.2% British17 0.2% Israeli14 0.1% Cypriot14 0.1% Bulgarian14 0.1% Lebanese12 0.1% Swiss12 0.1% Celtic10 0.09% Icelander9 0.08% Syrian9 0.08% French9 0.08% Yugoslavian8 0.07% Moroccan8 0.07% Norwegian8 0.07% Scotch-Irish8 0.07% Danish8 0.07% Turkish8 0.07% Trinidadian and Tobagonian7 0.07% Maltese5 0.05% Lithuanian5 0.05% Jordanian5 0.05% Egyptian5 0.05% Hungarian3 0.03% Slavic
Geographical mobility in Eastchester Same house 1 year ago 13,715 93.5% White (Caucasian)218 95.7% Black or African American1,813 74.2% Asian348 88.6% Other race1,557 88.2% Two or more races14,162 93.2% White alone, not Hispanic / Latino1,404 92.4% Hispanic or LatinoMoved within same county 562 3.8% White / Caucasian418 17.1% Asian23 5.9% Other race13 0.8% Two or more races617 4.1% White alone, not Hispanic / Latino43 2.8% Hispanic or LatinoMoved within same state 99 0.7% White / Caucasian8 3.5% Black or African American17 0.7% Asian10 2.7% Other race60 3.4% Two or more races100 0.7% White alone, not Hispanic / Latino28 1.9% Hispanic or LatinoMoved from different state 241 1.6% White / Caucasian82 3.3% Asian88 5.0% Two or more races263 1.7% White alone, not Hispanic / Latino28 1.9% Hispanic or LatinoMoved from abroad 41 0.3% White1 0.3% Black or African American211 8.6% Asian52 0.3% White alone, not Hispanic / Latino
Children Nativity (place of birth) in Eastchester
Children under 6 years - Living with two parents Both parents native 916 99.9% Native1 0.1% Foreign-bornBoth parents foreign-born 149 75.0% Native50 25.0% Foreign-bornOne native, one foreign-born parent 215 100.0% NativeChildren under 6 years - Living with one parent Native parent 12 100.0% NativeForeign-born parent 34 100.0% NativeChildren 6 to 17 years - Living with two parents Both parents native 1,369 100.0% NativeBoth parents foreign-born 467 72.1% Native181 27.9% Foreign-bornOne native, one foreign-born parent 614 100.0% NativeChildren 6 to 17 years - Living with one parent Native parent 218 100.0% NativeForeign-born parent 49 55.7% Native39 44.3% Foreign-born