Races in Burton, South Carolina (SC) Detailed Stats
Data:
Races - White alone (%)
Races - White alone (% change since 2000)
Races - Black alone (%)
Races - Black alone (% change since 2000)
Races - American Indian alone (%)
Races - American Indian alone (% change since 2000)
Races - Asian alone (%)
Races - Asian alone (% change since 2000)
Races - Hispanic (%)
Races - Hispanic (% change since 2000)
Races - Native Hawaiian and Other Pacific Islander alone (%)
Races - Native Hawaiian and Other Pacific Islander alone (% change since 2000)
Races - Two or more races(%)
Races - Two or more races(% change since 2000)
Races - Other race alone (%)
Races - Other race alone (% change since 2000)
Racial diversity
Place of birth - Born in state of residence (%)
Place of birth - Born in state of residence (%) - White
Place of birth - Born in state of residence (%) - Black or African American
Place of birth - Born in state of residence (%) - Asian
Place of birth - Born in state of residence (%) - Hispanic or Latino
Place of birth - Born in state of residence (%) - American Indian and Alaska Native
Place of birth - Born in state of residence (%) - Multirace
Place of birth - Born in state of residence (%) - Other Race
Place of birth - Born in other state (%)
Place of birth - Born in other state (%) - White
Place of birth - Born in other state (%) - Black or African American
Place of birth - Born in other state (%) - Asian
Place of birth - Born in other state (%) - Hispanic or Latino
Place of birth - Born in other state (%) - American Indian and Alaska Native
Place of birth - Born in other state (%) - Multirace
Place of birth - Born in other state (%) - Other Race
Place of birth - Native, outside of US (%)
Place of birth - Native, outside of US (%) - White
Place of birth - Native, outside of US (%) - Black or African American
Place of birth - Native, outside of US (%) - Asian
Place of birth - Native, outside of US (%) - Hispanic or Latino
Place of birth - Native, outside of US (%) - American Indian and Alaska Native
Place of birth - Native, outside of US (%) - Multirace
Place of birth - Native, outside of US (%) - Other Race
Place of birth - Foreign born (%)
Place of birth - Foreign born (%) - White
Place of birth - Foreign born (%) - Black or African American
Place of birth - Foreign born (%) - Asian
Place of birth - Foreign born (%) - Hispanic or Latino
Place of birth - Foreign born (%) - American Indian and Alaska Native
Place of birth - Foreign born (%) - Multirace
Place of birth - Foreign born (%) - Other Race
Residents speaking English at home (%)
Residents speaking English at home - Born in the United States (%)
Residents speaking English at home - Native, born elsewhere (%)
Residents speaking English at home - Foreign born (%)
Residents speaking Spanish at home (%)
Residents speaking Spanish at home - Born in the United States (%)
Residents speaking Spanish at home - Native, born elsewhere (%)
Residents speaking Spanish at home - Foreign born (%)
Residents speaking other language at home (%)
Residents speaking other language at home - Born in the United States (%)
Residents speaking other language at home - Native, born elsewhere (%)
Residents speaking other language at home - Foreign born (%)
Marital status - Never married (%)
Marital status - Now married (%)
Marital status - Separated (%)
Marital status - Widowed (%)
Marital status - Divorced (%)
Ancestries Reported - Arab (%)
Ancestries Reported - Czech (%)
Ancestries Reported - Danish (%)
Ancestries Reported - Dutch (%)
Ancestries Reported - English (%)
Ancestries Reported - French (%)
Ancestries Reported - French Canadian (%)
Ancestries Reported - German (%)
Ancestries Reported - Greek (%)
Ancestries Reported - Hungarian (%)
Ancestries Reported - Irish (%)
Ancestries Reported - Italian (%)
Ancestries Reported - Lithuanian (%)
Ancestries Reported - Norwegian (%)
Ancestries Reported - Polish (%)
Ancestries Reported - Portuguese (%)
Ancestries Reported - Russian (%)
Ancestries Reported - Scotch-Irish (%)
Ancestries Reported - Scottish (%)
Ancestries Reported - Slovak (%)
Ancestries Reported - Subsaharan African (%)
Ancestries Reported - Swedish (%)
Ancestries Reported - Swiss (%)
Ancestries Reported - Ukrainian (%)
Ancestries Reported - United States (%)
Ancestries Reported - Welsh (%)
Ancestries Reported - West Indian (%)
Ancestries Reported - Other (%)
Geographical mobility - Same house 1 year ago (%)
Geographical mobility - Same house 1 year ago (%) - White
Geographical mobility - Same house 1 year ago (%) - Black or African American
Geographical mobility - Same house 1 year ago (%) - Asian
Geographical mobility - Same house 1 year ago (%) - Hispanic or Latino
Geographical mobility - Same house 1 year ago (%) - American Indian and Alaska Native
Geographical mobility - Same house 1 year ago (%) - Multirace
Geographical mobility - Same house 1 year ago (%) - Other Race
Geographical mobility - Moved within same county (%)
Geographical mobility - Moved within same county (%) - White
Geographical mobility - Moved within same county (%) - Black or African American
Geographical mobility - Moved within same county (%) - Asian
Geographical mobility - Moved within same county (%) - Hispanic or Latino
Geographical mobility - Moved within same county (%) - American Indian and Alaska Native
Geographical mobility - Moved within same county (%) - Multirace
Geographical mobility - Moved within same county (%) - Other Race
Geographical mobility - Moved from different county within same state (%)
Geographical mobility - Moved from different county within same state (%) - White
Geographical mobility - Moved from different county within same state (%) - Black or African American
Geographical mobility - Moved from different county within same state (%) - Asian
Geographical mobility - Moved from different county within same state (%) - Hispanic or Latino
Geographical mobility - Moved from different county within same state (%) - American Indian and Alaska Native
Geographical mobility - Moved from different county within same state (%) - Multirace
Geographical mobility - Moved from different county within same state (%) - Other Race
Geographical mobility - Moved from different state (%)
Geographical mobility - Moved from different state (%) - White
Geographical mobility - Moved from different state (%) - Black or African American
Geographical mobility - Moved from different state (%) - Asian
Geographical mobility - Moved from different state (%) - Hispanic or Latino
Geographical mobility - Moved from different state (%) - American Indian and Alaska Native
Geographical mobility - Moved from different state (%) - Multirace
Geographical mobility - Moved from different state (%) - Other Race
Geographical mobility - Moved from abroad (%)
Geographical mobility - Moved from abroad (%) - White
Geographical mobility - Moved from abroad (%) - Black or African American
Geographical mobility - Moved from abroad (%) - Asian
Geographical mobility - Moved from abroad (%) - Hispanic or Latino
Geographical mobility - Moved from abroad (%) - American Indian and Alaska Native
Geographical mobility - Moved from abroad (%) - Multirace
Geographical mobility - Moved from abroad (%) - Other Race
Place of birth for the foreign-born population - Ireland (%)
Place of birth for the foreign-born population - Denmark (%)
Place of birth for the foreign-born population - Norway (%)
Place of birth for the foreign-born population - Sweden (%)
Place of birth for the foreign-born population - United Kingdom (%)
Place of birth for the foreign-born population - England (%)
Place of birth for the foreign-born population - Scotland (%)
Place of birth for the foreign-born population - Other Northern Europe (%)
Place of birth for the foreign-born population - Austria (%)
Place of birth for the foreign-born population - Belgium (%)
Place of birth for the foreign-born population - France (%)
Place of birth for the foreign-born population - Germany (%)
Place of birth for the foreign-born population - Netherlands (%)
Place of birth for the foreign-born population - Switzerland (%)
Place of birth for the foreign-born population - Other Western Europe (%)
Place of birth for the foreign-born population - Greece (%)
Place of birth for the foreign-born population - Italy (%)
Place of birth for the foreign-born population - Portugal (%)
Place of birth for the foreign-born population - Spain (%)
Place of birth for the foreign-born population - Other Southern Europe (%)
Place of birth for the foreign-born population - Albania (%)
Place of birth for the foreign-born population - Belarus (%)
Place of birth for the foreign-born population - Bosnia and Herzegovina (%)
Place of birth for the foreign-born population - Bulgaria (%)
Place of birth for the foreign-born population - Croatia (%)
Place of birth for the foreign-born population - Czechoslovakia (%)
Place of birth for the foreign-born population - Hungary (%)
Place of birth for the foreign-born population - Latvia (%)
Place of birth for the foreign-born population - Lithuania (%)
Place of birth for the foreign-born population - North Macedonia (Macedonia) (%)
Place of birth for the foreign-born population - Moldova (%)
Place of birth for the foreign-born population - Poland (%)
Place of birth for the foreign-born population - Romania (%)
Place of birth for the foreign-born population - Russia (%)
Place of birth for the foreign-born population - Serbia (%)
Place of birth for the foreign-born population - Ukraine (%)
Place of birth for the foreign-born population - Other Eastern Europe (%)
Place of birth for the foreign-born population - China (%)
Place of birth for the foreign-born population - Hong Kong (%)
Place of birth for the foreign-born population - Taiwan (%)
Place of birth for the foreign-born population - Japan (%)
Place of birth for the foreign-born population - Korea (%)
Place of birth for the foreign-born population - Other Eastern Asia (%)
Place of birth for the foreign-born population - Afghanistan (%)
Place of birth for the foreign-born population - Bangladesh (%)
Place of birth for the foreign-born population - India (%)
Place of birth for the foreign-born population - Iran (%)
Place of birth for the foreign-born population - Kazakhstan (%)
Place of birth for the foreign-born population - Nepal (%)
Place of birth for the foreign-born population - Pakistan (%)
Place of birth for the foreign-born population - Sri Lanka (%)
Place of birth for the foreign-born population - Uzbekistan (%)
Place of birth for the foreign-born population - Other South Central Asia (%)
Place of birth for the foreign-born population - Burma (%)
Place of birth for the foreign-born population - Cambodia (%)
Place of birth for the foreign-born population - Indonesia (%)
Place of birth for the foreign-born population - Laos (%)
Place of birth for the foreign-born population - Malaysia (%)
Place of birth for the foreign-born population - Philippines (%)
Place of birth for the foreign-born population - Singapore (%)
Place of birth for the foreign-born population - Thailand (%)
Place of birth for the foreign-born population - Vietnam (%)
Place of birth for the foreign-born population - Other South Eastern Asia (%)
Place of birth for the foreign-born population - Armenia (%)
Place of birth for the foreign-born population - Iraq (%)
Place of birth for the foreign-born population - Israel (%)
Place of birth for the foreign-born population - Jordan (%)
Place of birth for the foreign-born population - Kuwait (%)
Place of birth for the foreign-born population - Lebanon (%)
Place of birth for the foreign-born population - Saudi Arabia (%)
Place of birth for the foreign-born population - Syria (%)
Place of birth for the foreign-born population - Turkey (%)
Place of birth for the foreign-born population - Yemen (%)
Place of birth for the foreign-born population - Other Western Asia (%)
Place of birth for the foreign-born population - Eritrea (%)
Place of birth for the foreign-born population - Ethiopia (%)
Place of birth for the foreign-born population - Kenya (%)
Place of birth for the foreign-born population - Somalia (%)
Place of birth for the foreign-born population - Uganda (%)
Place of birth for the foreign-born population - Zimbabwe (%)
Place of birth for the foreign-born population - Other Eastern Africa (%)
Place of birth for the foreign-born population - Cameroon (%)
Place of birth for the foreign-born population - Congo (%)
Place of birth for the foreign-born population - Democratic Republic of Congo (Zaire) (%)
Place of birth for the foreign-born population - Other Middle Africa (%)
Place of birth for the foreign-born population - Egypt (%)
Place of birth for the foreign-born population - Morocco (%)
Place of birth for the foreign-born population - Sudan (%)
Place of birth for the foreign-born population - Other Northern Africa (%)
Place of birth for the foreign-born population - South Africa (%)
Place of birth for the foreign-born population - Other Southern Africa (%)
Place of birth for the foreign-born population - Cabo Verde (%)
Place of birth for the foreign-born population - Ghana (%)
Place of birth for the foreign-born population - Liberia (%)
Place of birth for the foreign-born population - Nigeria (%)
Place of birth for the foreign-born population - Senegal (%)
Place of birth for the foreign-born population - Sierra Leone (%)
Place of birth for the foreign-born population - Other Western Africa (%)
Place of birth for the foreign-born population - Australia (%)
Place of birth for the foreign-born population - New Zealand (%)
Place of birth for the foreign-born population - Fiji (%)
Place of birth for the foreign-born population - Micronesia (%)
Place of birth for the foreign-born population - Bahamas (%)
Place of birth for the foreign-born population - Barbados (%)
Place of birth for the foreign-born population - Cuba (%)
Place of birth for the foreign-born population - Dominica (%)
Place of birth for the foreign-born population - Dominican Republic (%)
Place of birth for the foreign-born population - Grenada (%)
Place of birth for the foreign-born population - Haiti (%)
Place of birth for the foreign-born population - Jamaica (%)
Place of birth for the foreign-born population - St. Vincent and the Grenadines (%)
Place of birth for the foreign-born population - Trinidad and Tobago (%)
Place of birth for the foreign-born population - West Indies (%)
Place of birth for the foreign-born population - Other Caribbean (%)
Place of birth for the foreign-born population - Belize (%)
Place of birth for the foreign-born population - Costa Rica (%)
Place of birth for the foreign-born population - El Salvador (%)
Place of birth for the foreign-born population - Guatemala (%)
Place of birth for the foreign-born population - Honduras (%)
Place of birth for the foreign-born population - Mexico (%)
Place of birth for the foreign-born population - Nicaragua (%)
Place of birth for the foreign-born population - Panama (%)
Place of birth for the foreign-born population - Other Central America (%)
Place of birth for the foreign-born population - Argentina (%)
Place of birth for the foreign-born population - Bolivia (%)
Place of birth for the foreign-born population - Brazil (%)
Place of birth for the foreign-born population - Chile (%)
Place of birth for the foreign-born population - Colombia (%)
Place of birth for the foreign-born population - Ecuador (%)
Place of birth for the foreign-born population - Guyana (%)
Place of birth for the foreign-born population - Peru (%)
Place of birth for the foreign-born population - Uruguay (%)
Place of birth for the foreign-born population - Venezuela (%)
Place of birth for the foreign-born population - Other South America (%)
Place of birth for the foreign-born population - Canada (%)
Place of birth for the foreign-born population - Other Northern America (%)
Place of birth for the foreign-born population - Other (%)
Latest news about races in Burton, SC collected exclusively by city-data.com from local newspapers, TV, and radio stations
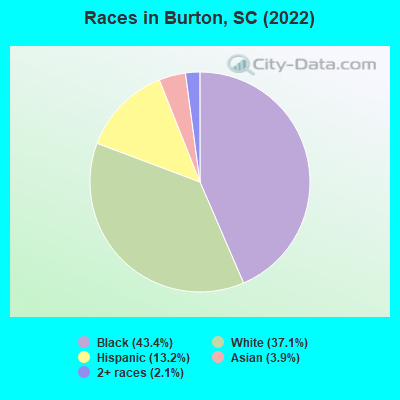
According to 2022 data, the most numerous races in Burton, SC are White alone (2,930 residents), Black alone (3,425 residents), and Hispanic (1,039 residents). 82.9% of Burton residents speak English at home. 7.7% of Burton, SC residents are foreign-born (3.7% born in Asia, 3.2% born in Latin America, 0.9% born in Europe), which is 35.1% greater than the foreign-born rate of 5.0% across the entire state of South Carolina.
Race distribution in Burton
2000 2022
2,652,291 66.1% White alone 1,178,486 29.4% Black alone 95,076 2.4% Hispanic 35,568 0.9% Asian alone 33,290 0.8% Two or more races 12,765 0.3% American Indian alone 3,266 0.08% Other race alone 1,270 0.03% Native Hawaiian and Other
3,301,739 62.5% White alone 1,313,290 24.9% Black alone 343,783 6.5% Hispanic 190,508 3.6% Two or more races 89,888 1.7% Asian alone 29,390 0.6% Other race alone 12,112 0.2% American Indian alone 1,924 0.04% Native Hawaiian and Other
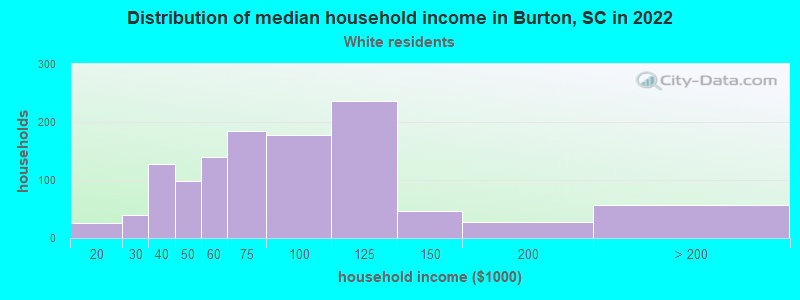
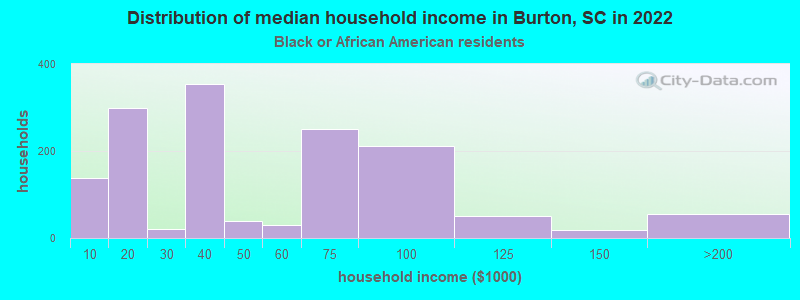
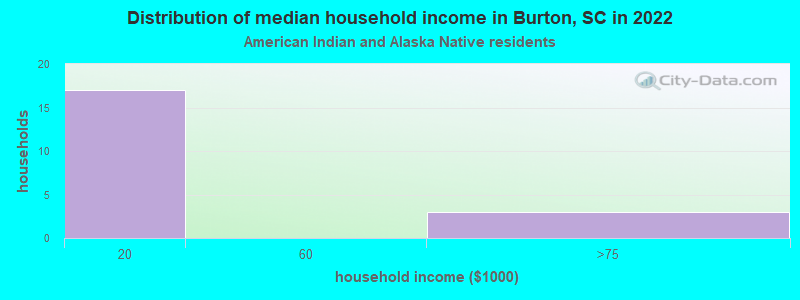
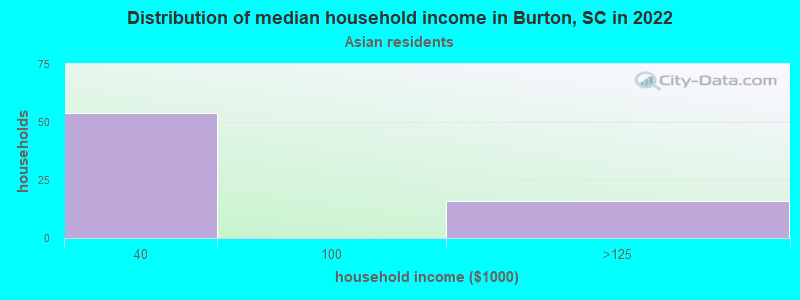
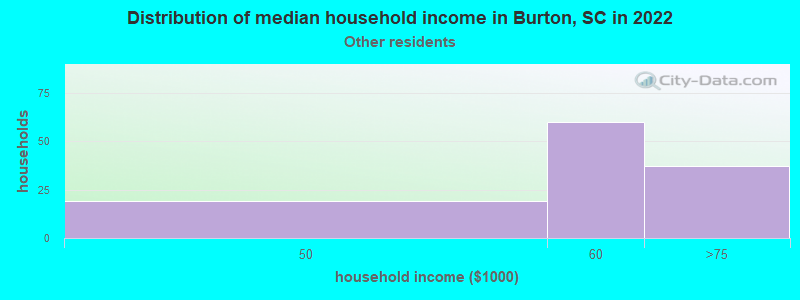
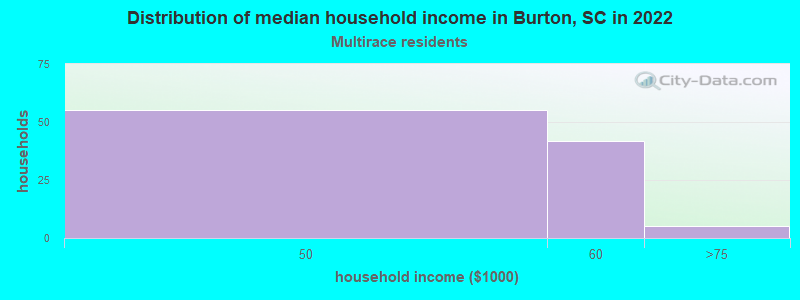
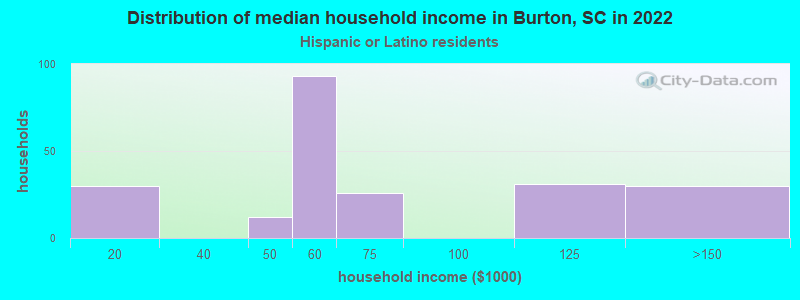
Income and house value in Burton Median household income in 2022 $69,918 White non-Hispanic householders$32,009 Black householders$87,051 Some other race householders$50,851 Two or more races householders$72,049 Hispanic or Latino race householdersMedian 2022 house value $309,298 White Non-Hispanic householders$227,875 Black or African American householders$201,540 Some other race householders$396,363 Two or more races householders$232,981 Hispanic or Latino householders
Median age by race in Burton
37.8 Median age for White residents39.1 34.5 43.4 Median age for Black or African American residents35.2 49.1 6.6 Median age for American Indian / Alaska Native residents-464,419,475.2 35.8 20.9 Median age for Asian residents25.9 58.3 -698,412,697.7 Median age for Native Hawaiian / Pacific Islander residents-551,574,375.1 -666,666,666.0 21.8 Median age for Other race residents19.9 4.7 14.1 Median age for Two or more races residents20.6 14.2 38.6 Median age for White alone residents39.0 37.4 21.6 Median age for Hispanic or Latino residents23.7 9.8
Owner/renter occupied households by race in Burton
House owners and renters - White residents 848 70.9% Owner occupied347 29.1% Renter occupiedHouse owners and renters - Black or African American residents 576 42.0% Owner occupied797 58.0% Renter occupiedHouse owners and renters - American Indian / Alaska Native residents 17 100.0% Owner occupiedHouse owners and renters - Asian residents 19 31.8% Owner occupied40 68.2% Renter occupiedHouse owners and renters - Other race residents 105 100.0% Renter occupiedHouse owners and renters - Two or more races residents 28 31.1% Owner occupied62 68.9% Renter occupiedHouse owners and renters - White alone residents 802 70.7% Owner occupied332 29.3% Renter occupiedHouse owners and renters - Hispanic or Latino residents 61 27.8% Owner occupied158 72.2% Renter occupied
Language usage in Burton
English speakers - Total 82.9% of residents of Burton speak English at home.
10.8% of residents speak Spanish at home 331 42.0% Speak English very well457 58.0% Speak English less than very well4.8% of residents speak other language at home 166 47.4% Speak English very well184 52.6% Speak English less than very well
English speakers - Born in the United States 93.9% of residents of Burton speak English at home.
8.4% of residents speak Spanish at home 177 100.0% Speak English very well
English speakers - Native, born elsewhere 8.6% of residents of Burton speak English at home.
67.5% of residents speak Spanish at home 212 100.0% Speak English less than very well
English speakers - Foreign-born 5.5% of residents of Burton speak English at home.
40.0% of residents speak Spanish at home 91 38.2% Speak English very well147 61.8% Speak English less than very well52.3% of residents speak other language at home 127 40.8% Speak English very well184 59.2% Speak English less than very well
White (Caucasian) - Speak only English Native:
99.2% (2,730)Foreign-born:
41.1% (34)
White (Caucasian) - Speak another language Native:
0.8% (23)Foreign-born:
55.4% (46)
Black or African American - Speak another language Native:
6.1% (192)Foreign-born:
100.0% (90)
Other race - Speak another language Native:
100.0% (330)Foreign-born:
100.0% (90)
Two or more races - Speak another language Native:
30.1% (97)Foreign-born:
91.8% (45)
White alone - Speak only English Native:
99.6% (2,690)Foreign-born:
51.9% (37)
Hispanic or Latino - Speak another language Native:
73.1% (453)Foreign-born:
100.0% (143)
Foreign-born residents in Burton 608 residents are foreign born (3.7% Asia , 3.2% Latin America , 0.9% Europe ).
This city:
7.7%South Carolina:
5.3%
Marital status for residents in Burton Marital status - White (Caucasian) population 15 years and over
Males 29.7% Never married56.4% Now married7.3% Separated0.5% Widowed6.1% DivorcedFemales 41.4% Never married44.3% Now married4.0% Separated2.9% Widowed7.4% DivorcedWomen who gave birth in the past 12 months Now married:
57.1% (19)Unmarried:
42.9% (15)
Women who did not give birth in the past 12 months Now married:
42.6% (479)Unmarried:
57.4% (645)
Marital status - Black or African American population 15 years and over
Males 39.8% Never married40.6% Now married8.6% Separated2.2% Widowed8.8% DivorcedFemales 37.9% Never married28.1% Now married5.1% Separated22.0% Widowed6.9% DivorcedWomen who did not give birth in the past 12 months Now married:
21.2% (183)Unmarried:
78.8% (679)
Marital status - Asian population 15 years and over
Males 71.8% Never married28.2% Now married0.0% Separated0.0% Widowed0.0% DivorcedFemales 0.0% Never married100.0% Now married0.0% Separated0.0% Widowed0.0% DivorcedMarital status - Other race population 15 years and over
Males 49.8% Never married50.2% Now married0.0% Separated0.0% Widowed0.0% DivorcedFemales 0.0% Never married100.0% Now married0.0% Separated0.0% Widowed0.0% DivorcedWomen who gave birth in the past 12 months Now married:
100.0% (101)Unmarried:
0.0% (0)
Women who did not give birth in the past 12 months Now married:
100.0% (69)Unmarried:
0.0% (0)
Marital status - Two or more races population 15 years and over
Males 36.2% Never married63.8% Now married0.0% Separated0.0% Widowed0.0% DivorcedFemales 26.1% Never married73.9% Now married0.0% Separated0.0% Widowed0.0% DivorcedWomen who did not give birth in the past 12 months Now married:
67.6% (64)Unmarried:
32.4% (31)
Marital status - White alone, not Hispanic / Latino population 15 years and over
Males 28.2% Never married56.7% Now married7.9% Separated0.6% Widowed6.7% DivorcedFemales 41.4% Never married44.3% Now married4.0% Separated2.9% Widowed7.4% DivorcedWomen who gave birth in the past 12 months Now married:
57.1% (20)Unmarried:
42.9% (15)
Women who did not give birth in the past 12 months Now married:
42.6% (483)Unmarried:
57.4% (651)
Marital status - Hispanic or Latino population 15 years and over
Males 44.8% Never married55.2% Now married0.0% Separated0.0% Widowed0.0% DivorcedFemales 4.3% Never married95.7% Now married0.0% Separated0.0% Widowed0.0% DivorcedWomen who gave birth in the past 12 months Now married:
100.0% (84)Unmarried:
0.0% (0)
Women who did not give birth in the past 12 months Now married:
92.9% (117)Unmarried:
7.1% (9)
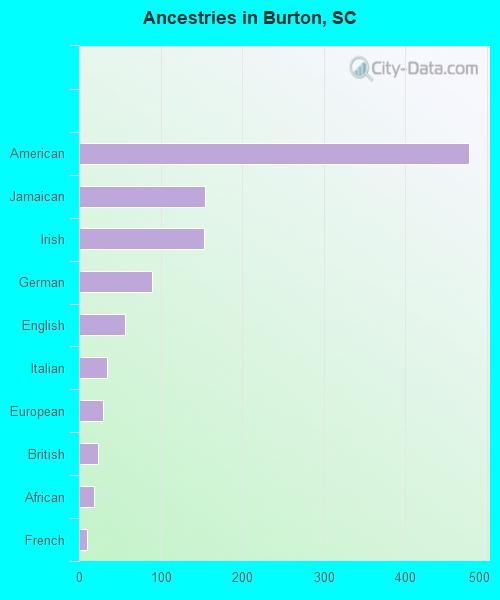
Ancestries in Burton
479 12.5% American155 4.0% Jamaican153 4.0% Irish90 2.3% German56 1.5% English34 0.9% Italian30 0.8% European23 0.6% British19 0.5% African10 0.3% French
Children Nativity (place of birth) in Burton
Children under 6 years - Living with two parents Both parents native 272 100.0% NativeBoth parents foreign-born 26 100.0% NativeOne native, one foreign-born parent 126 100.0% NativeChildren under 6 years - Living with one parent Native parent 145 100.0% NativeForeign-born parent 53 100.0% NativeChildren 6 to 17 years - Living with two parents Both parents native 374 100.0% NativeBoth parents foreign-born 32 33.8% Native62 66.2% Foreign-bornOne native, one foreign-born parent 100 100.0% NativeChildren 6 to 17 years - Living with one parent Native parent 460 100.0% Native
Grandparents responsible for own grandchildren in Burton
Grandparents (30 to 59 years) Black or African American 100 40.4% Responsible for grandchildren148 59.6% Not responsible for grandchildrenOther race 76 100.0% Not responsible for grandchildrenHispanic or Latino 94 100.0% Not responsible for grandchildren
Grandparents (60 years and over)