Races in Bronx, New York (NY) Detailed Stats
Ancestries, Foreign-born residents, place of birth
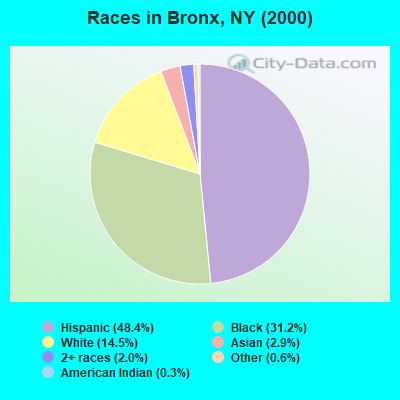
Race distribution in Bronx

- 644,70548.4%Hispanic
- 416,33831.2%Black alone
- 193,65114.5%White alone
- 38,5582.9%Asian alone
- 27,2092.0%Two or more races
- 8,2270.6%Other race alone
- 3,4880.3%American Indian alone
- 4740.04%Native Hawaiian and Other
Pacific Islander alone
2000
2022
-
- 11,760,98162.0%White alone
- 2,867,58315.1%Hispanic
- 2,812,62314.8%Black alone
- 1,035,9265.5%Asian alone
- 366,1161.9%Two or more races
- 75,4990.4%Other race alone
- 52,4990.3%American Indian alone
- 5,2300.03%Native Hawaiian and Other
Pacific Islander alone

-
- 10,408,93352.9%White alone
- 3,867,29919.7%Hispanic
- 2,633,84013.4%Black alone
- 1,776,2869.0%Asian alone
- 732,6703.7%Two or more races
- 216,1101.1%Other race alone
- 35,0820.2%American Indian alone
- 6,9310.04%Native Hawaiian and Other
Pacific Islander alone

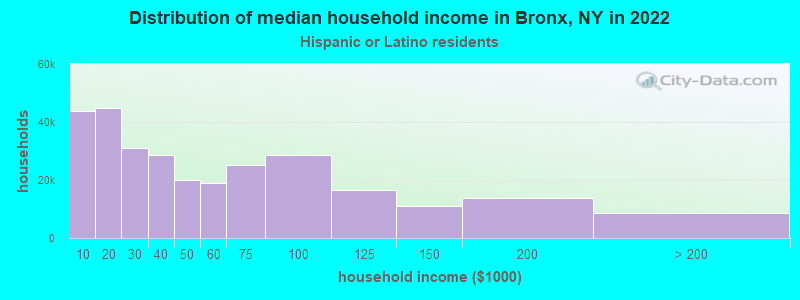
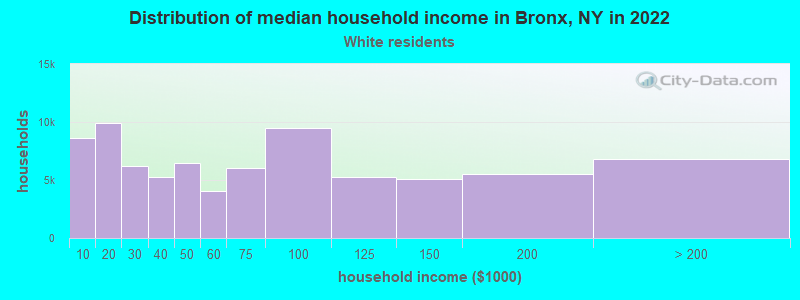
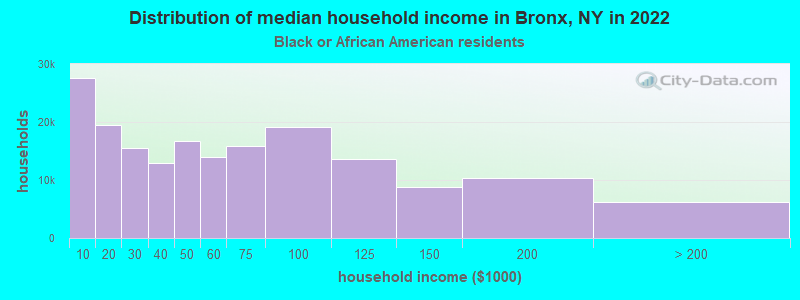
Income and house value in Bronx
- Median household income in 2022
- $70,525White non-Hispanic householders
- $48,497Black householders
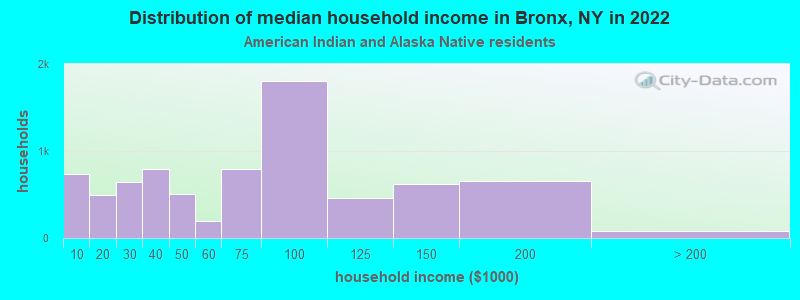
- $63,817American Indian and Alaska Native householders
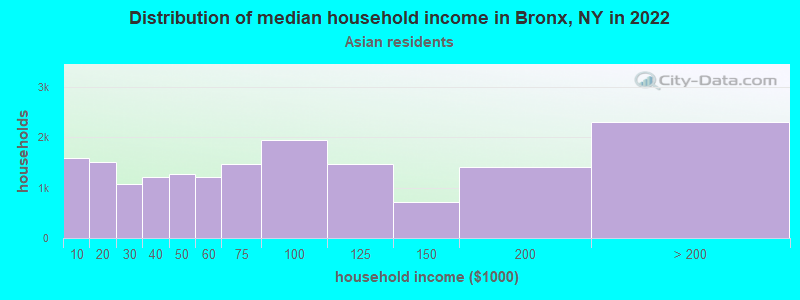
- $66,209Asian householders
- $36,916Some other race householders
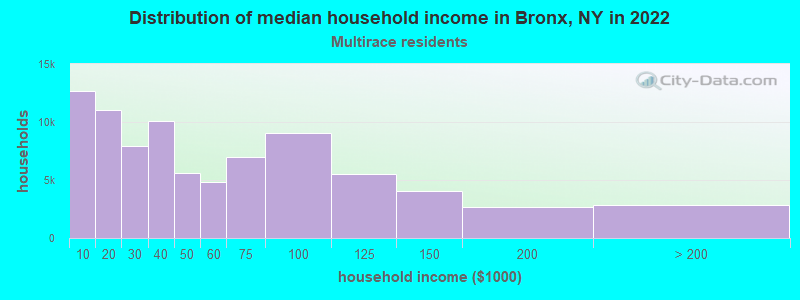
- $39,791Two or more races householders
- $38,661Hispanic or Latino race householders
- Median 2022 house value
- $539,099White Non-Hispanic householders
- $487,668Black or African American householders
- $486,602American Indian or Alaska Native householders
- $508,453Asian householders
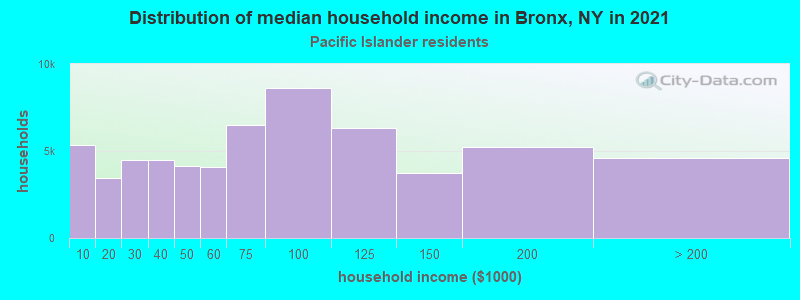
- $421,846Native Hawaiian and other Pacific Islander householders
- $490,332Some other race householders
- $493,530Two or more races householders
- $489,800Hispanic or Latino householders
Household income for White non-Hispanic householders
Household income for Black householders
Household income for American Indian and Alaska Native householders
Household income for Asian householders
Household income for Native Hawaiian and other Pacific Islander householders
Household income for Two or more races householders
Household income for Hispanic or Latino race householders