Races in Borger, Texas (TX) Detailed Stats
Data:
Races - White alone (%)
Races - White alone (% change since 2000)
Races - Black alone (%)
Races - Black alone (% change since 2000)
Races - American Indian alone (%)
Races - American Indian alone (% change since 2000)
Races - Asian alone (%)
Races - Asian alone (% change since 2000)
Races - Hispanic (%)
Races - Hispanic (% change since 2000)
Races - Native Hawaiian and Other Pacific Islander alone (%)
Races - Native Hawaiian and Other Pacific Islander alone (% change since 2000)
Races - Two or more races(%)
Races - Two or more races(% change since 2000)
Races - Other race alone (%)
Races - Other race alone (% change since 2000)
Racial diversity
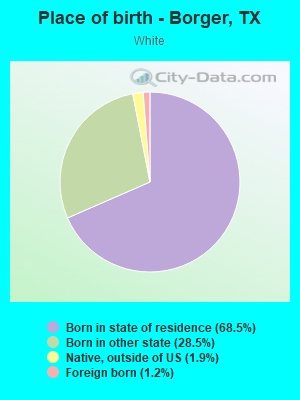
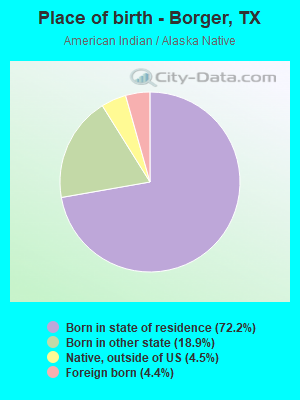
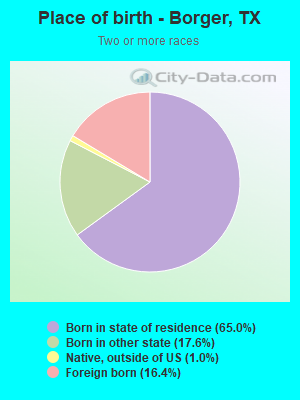
Place of birth - Born in state of residence (%)
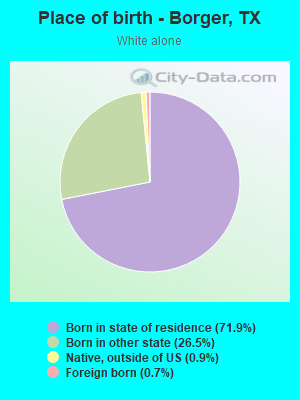
Place of birth - Born in state of residence (%) - White
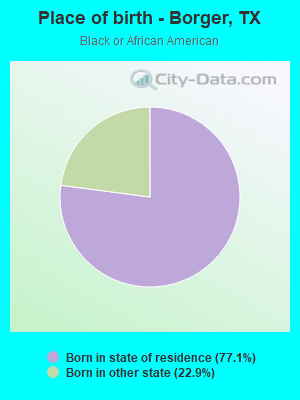
Place of birth - Born in state of residence (%) - Black or African American
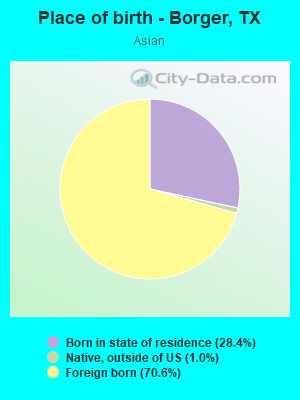
Place of birth - Born in state of residence (%) - Asian
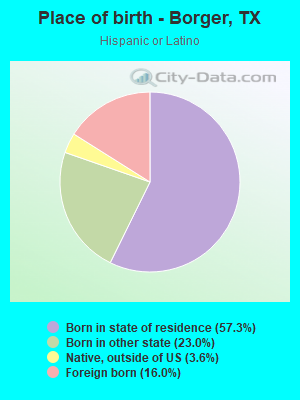
Place of birth - Born in state of residence (%) - Hispanic or Latino
Place of birth - Born in state of residence (%) - American Indian and Alaska Native
Place of birth - Born in state of residence (%) - Multirace
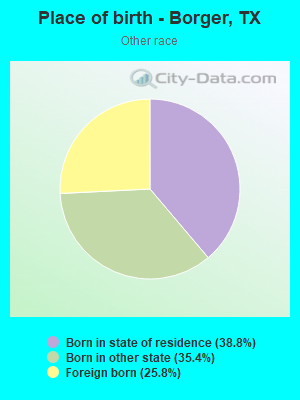
Place of birth - Born in state of residence (%) - Other Race
Place of birth - Born in other state (%)
Place of birth - Born in other state (%) - White
Place of birth - Born in other state (%) - Black or African American
Place of birth - Born in other state (%) - Asian
Place of birth - Born in other state (%) - Hispanic or Latino
Place of birth - Born in other state (%) - American Indian and Alaska Native
Place of birth - Born in other state (%) - Multirace
Place of birth - Born in other state (%) - Other Race
Place of birth - Native, outside of US (%)
Place of birth - Native, outside of US (%) - White
Place of birth - Native, outside of US (%) - Black or African American
Place of birth - Native, outside of US (%) - Asian
Place of birth - Native, outside of US (%) - Hispanic or Latino
Place of birth - Native, outside of US (%) - American Indian and Alaska Native
Place of birth - Native, outside of US (%) - Multirace
Place of birth - Native, outside of US (%) - Other Race
Place of birth - Foreign born (%)
Place of birth - Foreign born (%) - White
Place of birth - Foreign born (%) - Black or African American
Place of birth - Foreign born (%) - Asian
Place of birth - Foreign born (%) - Hispanic or Latino
Place of birth - Foreign born (%) - American Indian and Alaska Native
Place of birth - Foreign born (%) - Multirace
Place of birth - Foreign born (%) - Other Race
Residents speaking English at home (%)
Residents speaking English at home - Born in the United States (%)
Residents speaking English at home - Native, born elsewhere (%)
Residents speaking English at home - Foreign born (%)
Residents speaking Spanish at home (%)
Residents speaking Spanish at home - Born in the United States (%)
Residents speaking Spanish at home - Native, born elsewhere (%)
Residents speaking Spanish at home - Foreign born (%)
Residents speaking other language at home (%)
Residents speaking other language at home - Born in the United States (%)
Residents speaking other language at home - Native, born elsewhere (%)
Residents speaking other language at home - Foreign born (%)
Marital status - Never married (%)
Marital status - Now married (%)
Marital status - Separated (%)
Marital status - Widowed (%)
Marital status - Divorced (%)
Ancestries Reported - Arab (%)
Ancestries Reported - Czech (%)
Ancestries Reported - Danish (%)
Ancestries Reported - Dutch (%)
Ancestries Reported - English (%)
Ancestries Reported - French (%)
Ancestries Reported - French Canadian (%)
Ancestries Reported - German (%)
Ancestries Reported - Greek (%)
Ancestries Reported - Hungarian (%)
Ancestries Reported - Irish (%)
Ancestries Reported - Italian (%)
Ancestries Reported - Lithuanian (%)
Ancestries Reported - Norwegian (%)
Ancestries Reported - Polish (%)
Ancestries Reported - Portuguese (%)
Ancestries Reported - Russian (%)
Ancestries Reported - Scotch-Irish (%)
Ancestries Reported - Scottish (%)
Ancestries Reported - Slovak (%)
Ancestries Reported - Subsaharan African (%)
Ancestries Reported - Swedish (%)
Ancestries Reported - Swiss (%)
Ancestries Reported - Ukrainian (%)
Ancestries Reported - United States (%)
Ancestries Reported - Welsh (%)
Ancestries Reported - West Indian (%)
Ancestries Reported - Other (%)
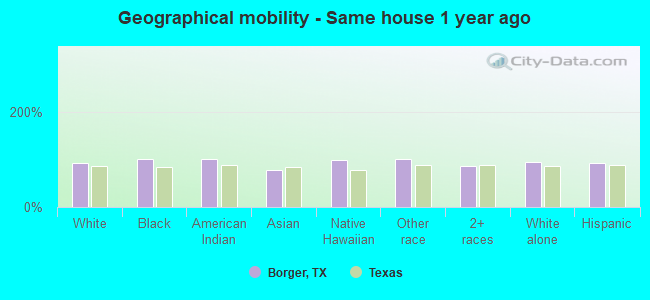
Geographical mobility - Same house 1 year ago (%)
Geographical mobility - Same house 1 year ago (%) - White
Geographical mobility - Same house 1 year ago (%) - Black or African American
Geographical mobility - Same house 1 year ago (%) - Asian
Geographical mobility - Same house 1 year ago (%) - Hispanic or Latino
Geographical mobility - Same house 1 year ago (%) - American Indian and Alaska Native
Geographical mobility - Same house 1 year ago (%) - Multirace
Geographical mobility - Same house 1 year ago (%) - Other Race
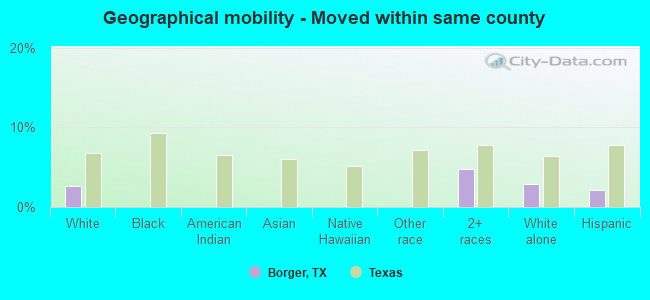
Geographical mobility - Moved within same county (%)
Geographical mobility - Moved within same county (%) - White
Geographical mobility - Moved within same county (%) - Black or African American
Geographical mobility - Moved within same county (%) - Asian
Geographical mobility - Moved within same county (%) - Hispanic or Latino
Geographical mobility - Moved within same county (%) - American Indian and Alaska Native
Geographical mobility - Moved within same county (%) - Multirace
Geographical mobility - Moved within same county (%) - Other Race
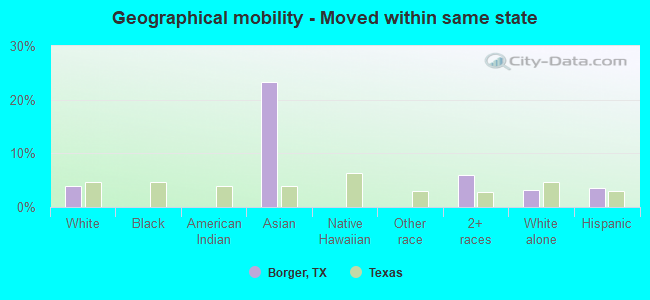
Geographical mobility - Moved from different county within same state (%)
Geographical mobility - Moved from different county within same state (%) - White
Geographical mobility - Moved from different county within same state (%) - Black or African American
Geographical mobility - Moved from different county within same state (%) - Asian
Geographical mobility - Moved from different county within same state (%) - Hispanic or Latino
Geographical mobility - Moved from different county within same state (%) - American Indian and Alaska Native
Geographical mobility - Moved from different county within same state (%) - Multirace
Geographical mobility - Moved from different county within same state (%) - Other Race
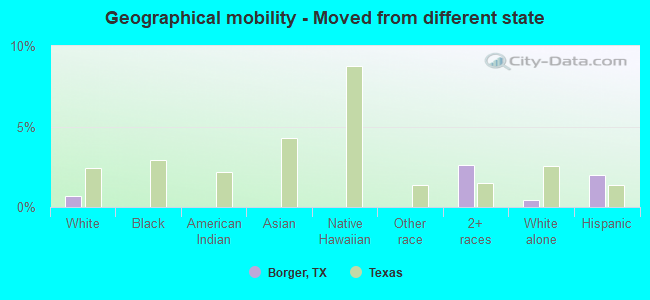
Geographical mobility - Moved from different state (%)
Geographical mobility - Moved from different state (%) - White
Geographical mobility - Moved from different state (%) - Black or African American
Geographical mobility - Moved from different state (%) - Asian
Geographical mobility - Moved from different state (%) - Hispanic or Latino
Geographical mobility - Moved from different state (%) - American Indian and Alaska Native
Geographical mobility - Moved from different state (%) - Multirace
Geographical mobility - Moved from different state (%) - Other Race
Geographical mobility - Moved from abroad (%)
Geographical mobility - Moved from abroad (%) - White
Geographical mobility - Moved from abroad (%) - Black or African American
Geographical mobility - Moved from abroad (%) - Asian
Geographical mobility - Moved from abroad (%) - Hispanic or Latino
Geographical mobility - Moved from abroad (%) - American Indian and Alaska Native
Geographical mobility - Moved from abroad (%) - Multirace
Geographical mobility - Moved from abroad (%) - Other Race
Place of birth for the foreign-born population - Ireland (%)
Place of birth for the foreign-born population - Denmark (%)
Place of birth for the foreign-born population - Norway (%)
Place of birth for the foreign-born population - Sweden (%)
Place of birth for the foreign-born population - United Kingdom (%)
Place of birth for the foreign-born population - England (%)
Place of birth for the foreign-born population - Scotland (%)
Place of birth for the foreign-born population - Other Northern Europe (%)
Place of birth for the foreign-born population - Austria (%)
Place of birth for the foreign-born population - Belgium (%)
Place of birth for the foreign-born population - France (%)
Place of birth for the foreign-born population - Germany (%)
Place of birth for the foreign-born population - Netherlands (%)
Place of birth for the foreign-born population - Switzerland (%)
Place of birth for the foreign-born population - Other Western Europe (%)
Place of birth for the foreign-born population - Greece (%)
Place of birth for the foreign-born population - Italy (%)
Place of birth for the foreign-born population - Portugal (%)
Place of birth for the foreign-born population - Spain (%)
Place of birth for the foreign-born population - Other Southern Europe (%)
Place of birth for the foreign-born population - Albania (%)
Place of birth for the foreign-born population - Belarus (%)
Place of birth for the foreign-born population - Bosnia and Herzegovina (%)
Place of birth for the foreign-born population - Bulgaria (%)
Place of birth for the foreign-born population - Croatia (%)
Place of birth for the foreign-born population - Czechoslovakia (%)
Place of birth for the foreign-born population - Hungary (%)
Place of birth for the foreign-born population - Latvia (%)
Place of birth for the foreign-born population - Lithuania (%)
Place of birth for the foreign-born population - North Macedonia (Macedonia) (%)
Place of birth for the foreign-born population - Moldova (%)
Place of birth for the foreign-born population - Poland (%)
Place of birth for the foreign-born population - Romania (%)
Place of birth for the foreign-born population - Russia (%)
Place of birth for the foreign-born population - Serbia (%)
Place of birth for the foreign-born population - Ukraine (%)
Place of birth for the foreign-born population - Other Eastern Europe (%)
Place of birth for the foreign-born population - China (%)
Place of birth for the foreign-born population - Hong Kong (%)
Place of birth for the foreign-born population - Taiwan (%)
Place of birth for the foreign-born population - Japan (%)
Place of birth for the foreign-born population - Korea (%)
Place of birth for the foreign-born population - Other Eastern Asia (%)
Place of birth for the foreign-born population - Afghanistan (%)
Place of birth for the foreign-born population - Bangladesh (%)
Place of birth for the foreign-born population - India (%)
Place of birth for the foreign-born population - Iran (%)
Place of birth for the foreign-born population - Kazakhstan (%)
Place of birth for the foreign-born population - Nepal (%)
Place of birth for the foreign-born population - Pakistan (%)
Place of birth for the foreign-born population - Sri Lanka (%)
Place of birth for the foreign-born population - Uzbekistan (%)
Place of birth for the foreign-born population - Other South Central Asia (%)
Place of birth for the foreign-born population - Burma (%)
Place of birth for the foreign-born population - Cambodia (%)
Place of birth for the foreign-born population - Indonesia (%)
Place of birth for the foreign-born population - Laos (%)
Place of birth for the foreign-born population - Malaysia (%)
Place of birth for the foreign-born population - Philippines (%)
Place of birth for the foreign-born population - Singapore (%)
Place of birth for the foreign-born population - Thailand (%)
Place of birth for the foreign-born population - Vietnam (%)
Place of birth for the foreign-born population - Other South Eastern Asia (%)
Place of birth for the foreign-born population - Armenia (%)
Place of birth for the foreign-born population - Iraq (%)
Place of birth for the foreign-born population - Israel (%)
Place of birth for the foreign-born population - Jordan (%)
Place of birth for the foreign-born population - Kuwait (%)
Place of birth for the foreign-born population - Lebanon (%)
Place of birth for the foreign-born population - Saudi Arabia (%)
Place of birth for the foreign-born population - Syria (%)
Place of birth for the foreign-born population - Turkey (%)
Place of birth for the foreign-born population - Yemen (%)
Place of birth for the foreign-born population - Other Western Asia (%)
Place of birth for the foreign-born population - Eritrea (%)
Place of birth for the foreign-born population - Ethiopia (%)
Place of birth for the foreign-born population - Kenya (%)
Place of birth for the foreign-born population - Somalia (%)
Place of birth for the foreign-born population - Uganda (%)
Place of birth for the foreign-born population - Zimbabwe (%)
Place of birth for the foreign-born population - Other Eastern Africa (%)
Place of birth for the foreign-born population - Cameroon (%)
Place of birth for the foreign-born population - Congo (%)
Place of birth for the foreign-born population - Democratic Republic of Congo (Zaire) (%)
Place of birth for the foreign-born population - Other Middle Africa (%)
Place of birth for the foreign-born population - Egypt (%)
Place of birth for the foreign-born population - Morocco (%)
Place of birth for the foreign-born population - Sudan (%)
Place of birth for the foreign-born population - Other Northern Africa (%)
Place of birth for the foreign-born population - South Africa (%)
Place of birth for the foreign-born population - Other Southern Africa (%)
Place of birth for the foreign-born population - Cabo Verde (%)
Place of birth for the foreign-born population - Ghana (%)
Place of birth for the foreign-born population - Liberia (%)
Place of birth for the foreign-born population - Nigeria (%)
Place of birth for the foreign-born population - Senegal (%)
Place of birth for the foreign-born population - Sierra Leone (%)
Place of birth for the foreign-born population - Other Western Africa (%)
Place of birth for the foreign-born population - Australia (%)
Place of birth for the foreign-born population - New Zealand (%)
Place of birth for the foreign-born population - Fiji (%)
Place of birth for the foreign-born population - Micronesia (%)
Place of birth for the foreign-born population - Bahamas (%)
Place of birth for the foreign-born population - Barbados (%)
Place of birth for the foreign-born population - Cuba (%)
Place of birth for the foreign-born population - Dominica (%)
Place of birth for the foreign-born population - Dominican Republic (%)
Place of birth for the foreign-born population - Grenada (%)
Place of birth for the foreign-born population - Haiti (%)
Place of birth for the foreign-born population - Jamaica (%)
Place of birth for the foreign-born population - St. Vincent and the Grenadines (%)
Place of birth for the foreign-born population - Trinidad and Tobago (%)
Place of birth for the foreign-born population - West Indies (%)
Place of birth for the foreign-born population - Other Caribbean (%)
Place of birth for the foreign-born population - Belize (%)
Place of birth for the foreign-born population - Costa Rica (%)
Place of birth for the foreign-born population - El Salvador (%)
Place of birth for the foreign-born population - Guatemala (%)
Place of birth for the foreign-born population - Honduras (%)
Place of birth for the foreign-born population - Mexico (%)
Place of birth for the foreign-born population - Nicaragua (%)
Place of birth for the foreign-born population - Panama (%)
Place of birth for the foreign-born population - Other Central America (%)
Place of birth for the foreign-born population - Argentina (%)
Place of birth for the foreign-born population - Bolivia (%)
Place of birth for the foreign-born population - Brazil (%)
Place of birth for the foreign-born population - Chile (%)
Place of birth for the foreign-born population - Colombia (%)
Place of birth for the foreign-born population - Ecuador (%)
Place of birth for the foreign-born population - Guyana (%)
Place of birth for the foreign-born population - Peru (%)
Place of birth for the foreign-born population - Uruguay (%)
Place of birth for the foreign-born population - Venezuela (%)
Place of birth for the foreign-born population - Other South America (%)
Place of birth for the foreign-born population - Canada (%)
Place of birth for the foreign-born population - Other Northern America (%)
Place of birth for the foreign-born population - Other (%)
Latest news about races in Borger, TX collected exclusively by city-data.com from local newspapers, TV, and radio stations
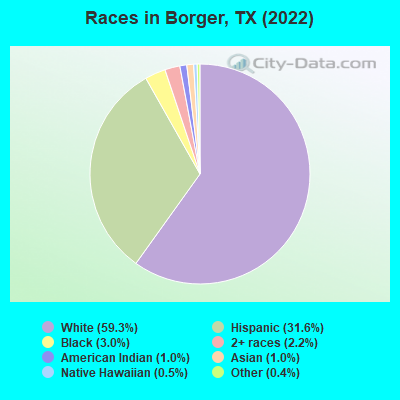
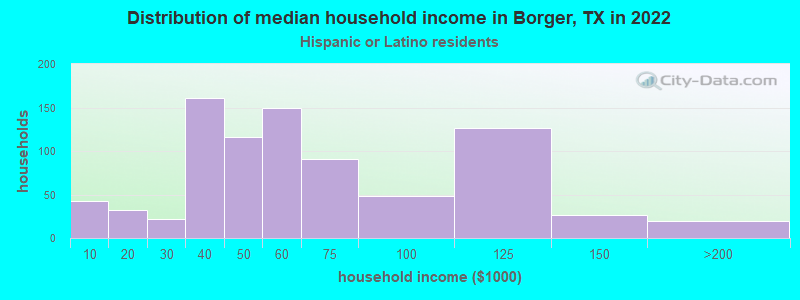
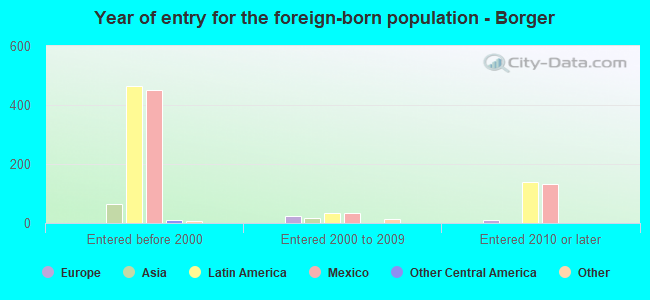
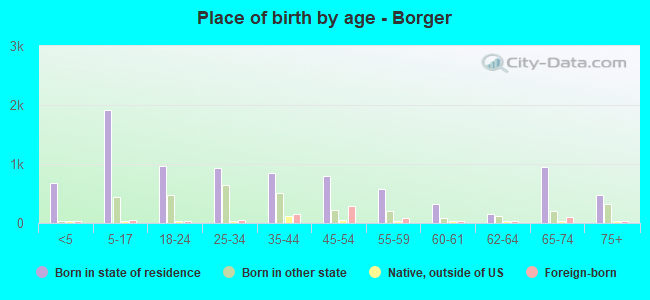
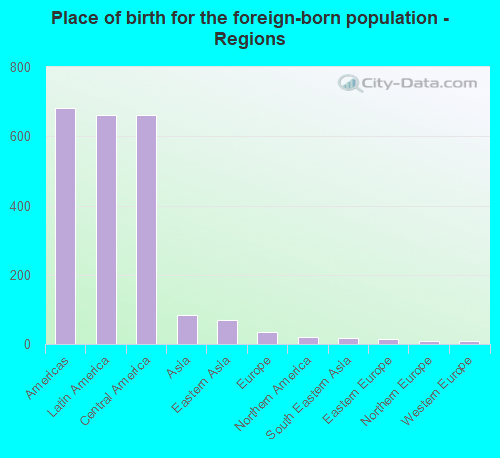
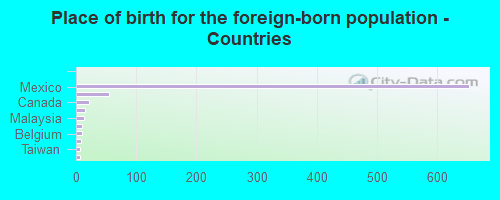
According to 2022 data, the most numerous races in Borger, TX are Hispanic (4,064 residents), White alone (7,611 residents), and Black alone (383 residents). 81.5% of Borger residents speak English at home. 6.3% of Borger, TX residents are foreign-born (5.1% born in Latin America, 0.7% born in Asia), which is 171.2% less than the foreign-born rate of 17.0% across the entire state of Texas.
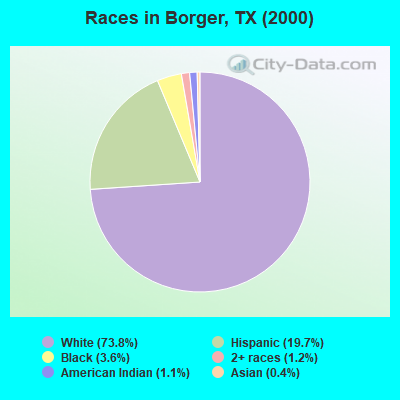
Race distribution in Borger
2000 2022
10,933,313 52.4% White alone 6,669,666 32.0% Hispanic 2,364,255 11.3% Black alone 554,445 2.7% Asian alone 230,567 1.1% Two or more races 68,859 0.3% American Indian alone 19,958 0.10% Other race alone 10,757 0.05% Native Hawaiian and Other
12,070,642 40.2% Hispanic 11,683,430 38.9% White alone 3,508,706 11.7% Black alone 1,608,173 5.4% Asian alone 956,560 3.2% Two or more races 125,763 0.4% Other race alone 47,023 0.2% American Indian alone 29,275 0.10% Native Hawaiian and Other
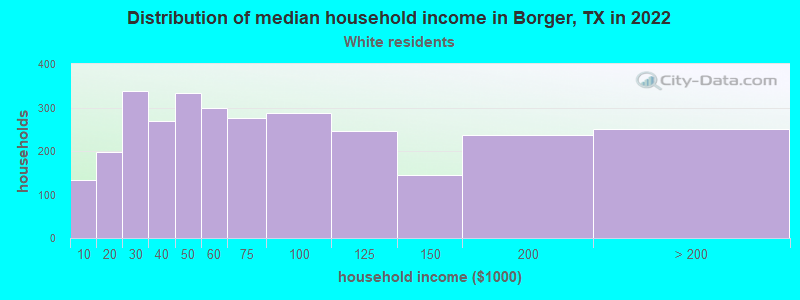
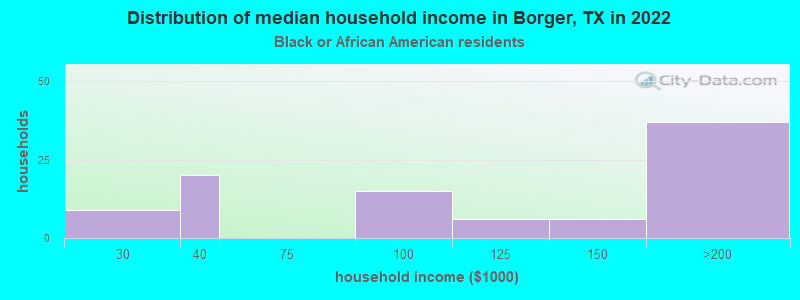
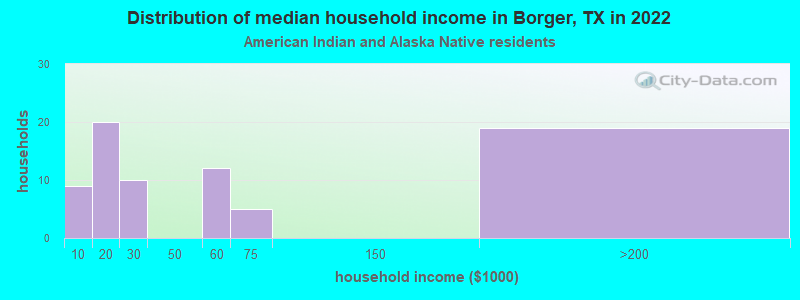
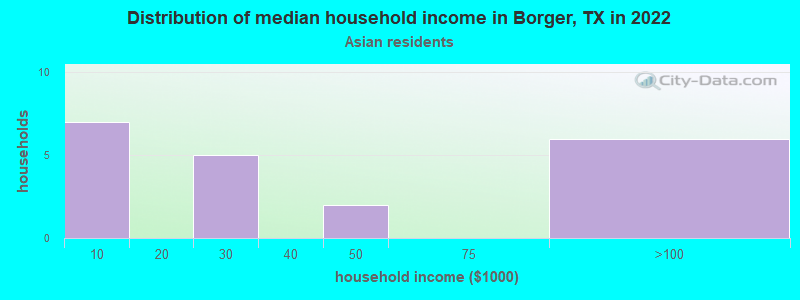
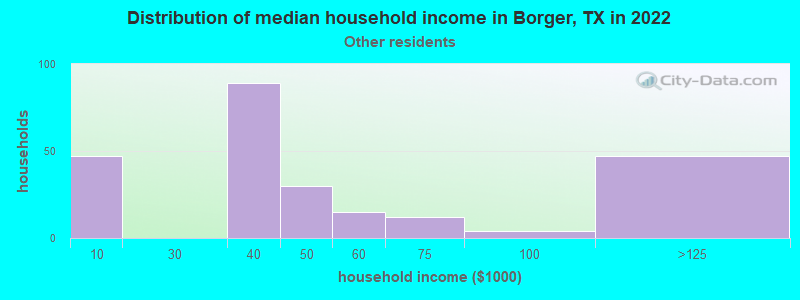
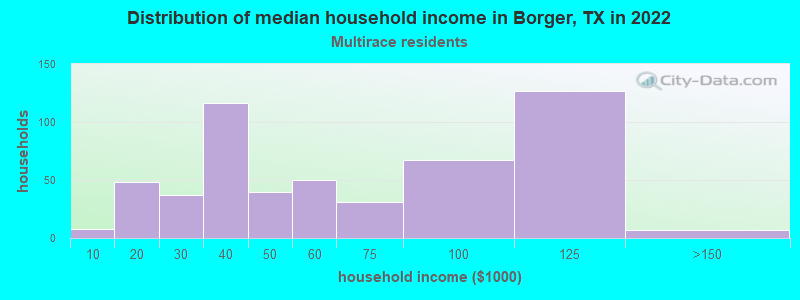
Income and house value in Borger Median household income in 2022 $56,164 White non-Hispanic householders$108,709 Black householders$37,764 Some other race householders$52,249 Two or more races householders$52,216 Hispanic or Latino race householdersMedian 2022 house value $113,846 White Non-Hispanic householders$88,748 Black or African American householders$74,517 American Indian or Alaska Native householders$71,154 Some other race householders$76,328 Two or more races householders$66,496 Hispanic or Latino householders
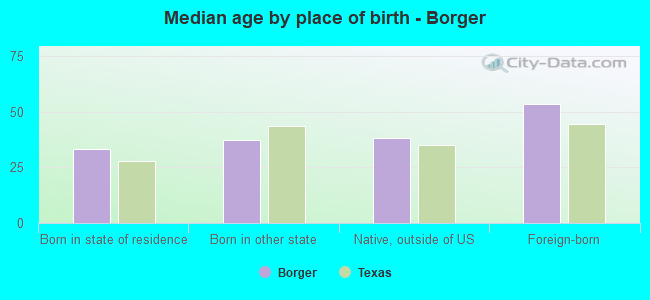
Median age by race in Borger
42.1 Median age for White residents41.3 43.5 27.1 Median age for Black or African American residents26.7 61.0 44.8 Median age for American Indian / Alaska Native residents32.1 67.0 53.1 Median age for Asian residents25.0 53.2 -581,560,283.1 Median age for Native Hawaiian / Pacific Islander residents-612,729,233.5 -577,777,777.2 29.9 Median age for Other race residents30.5 26.2 23.9 Median age for Two or more races residents23.6 23.8 43.8 Median age for White alone residents43.4 44.1 24.2 Median age for Hispanic or Latino residents26.8 23.3
Owner/renter occupied households by race in Borger
House owners and renters - White residents 2,397 78.1% Owner occupied672 21.9% Renter occupiedHouse owners and renters - Black or African American residents 69 74.8% Owner occupied23 25.2% Renter occupiedHouse owners and renters - American Indian / Alaska Native residents 41 54.8% Owner occupied34 45.2% Renter occupiedHouse owners and renters - Asian residents 7 86.4% Owner occupied1 13.6% Renter occupiedHouse owners and renters - Other race residents 204 84.6% Owner occupied37 15.4% Renter occupiedHouse owners and renters - Two or more races residents 430 80.6% Owner occupied104 19.4% Renter occupiedHouse owners and renters - White alone residents 2,383 75.8% Owner occupied760 24.2% Renter occupiedHouse owners and renters - Hispanic or Latino residents 717 86.1% Owner occupied116 13.9% Renter occupied
Language usage in Borger
English speakers - Total 81.5% of residents of Borger speak English at home.
17.8% of residents speak Spanish at home 1,514 70.1% Speak English very well647 29.9% Speak English less than very well0.6% of residents speak other language at home 22 32.4% Speak English very well46 67.6% Speak English less than very well
English speakers - Born in the United States 87.0% of residents of Borger speak English at home.
12.5% of residents speak Spanish at home 337 84.5% Speak English very well62 15.5% Speak English less than very well0.3% of residents speak other language at home 9 100.0% Speak English very well
English speakers - Native, born elsewhere 34.1% of residents of Borger speak English at home.
61.1% of residents speak Spanish at home 5 3.6% Speak English very well135 96.4% Speak English less than very well0.4% of residents speak other language at home 1 100.0% Speak English very well
English speakers - Foreign-born 16.3% of residents of Borger speak English at home.
77.3% of residents speak Spanish at home 261 42.0% Speak English very well361 58.0% Speak English less than very well5.5% of residents speak other language at home 3 6.8% Speak English very well41 93.2% Speak English less than very well
White (Caucasian) - Speak only English Native:
98.9% (7,542)Foreign-born:
38.6% (37)
White (Caucasian) - Speak another language Native:
5.3% (404)Foreign-born:
69.1% (66)
American Indian / Alaska Native - Speak another language Native:
21.7% (49)Foreign-born:
98.9% (11)
Asian - Speak only English Native:
74.3% (29)Foreign-born:
68.0% (60)
Asian - Speak another language Native:
26.2% (10)Foreign-born:
34.0% (30)
Other race - Speak another language Native:
26.7% (159)Foreign-born:
99.5% (285)
Two or more races - Speak only English Native:
49.9% (1,000)Foreign-born:
9.8% (44)
Two or more races - Speak another language Native:
49.9% (1,000)Foreign-born:
89.9% (402)
White alone - Speak only English Native:
98.9% (7,222)Foreign-born:
73.4% (40)
White alone - Speak another language Native:
1.2% (85)Foreign-born:
26.7% (14)
Hispanic or Latino - Speak only English Native:
51.6% (1,556)Foreign-born:
5.2% (35)
Hispanic or Latino - Speak another language Native:
48.7% (1,467)Foreign-born:
94.7% (625)
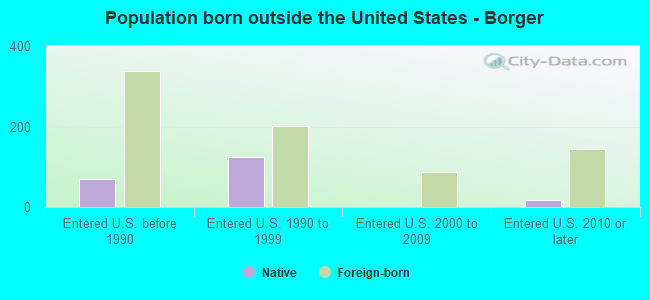
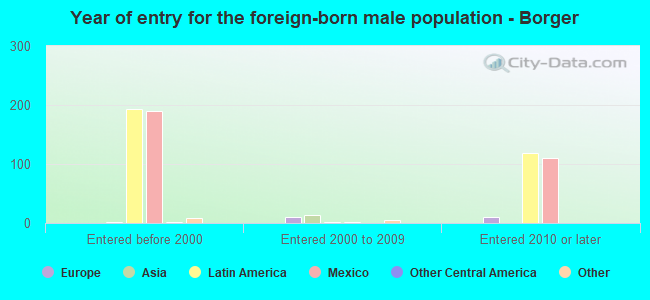
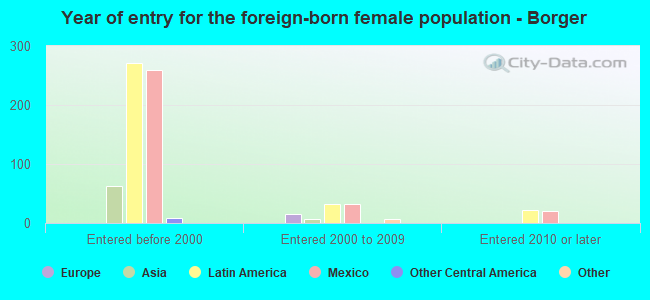
Foreign-born residents in Borger 805 residents are foreign born (5.1% Latin America , 0.7% Asia ).
This city:
6.3%Texas:
17.1%
Marital status for residents in Borger Marital status - White (Caucasian) population 15 years and over
Males 31.5% Never married50.6% Now married0.1% Separated3.6% Widowed14.1% DivorcedFemales 26.7% Never married42.5% Now married0.6% Separated11.7% Widowed18.6% DivorcedWomen who gave birth in the past 12 months Now married:
78.6% (27)Unmarried:
21.4% (7)
Women who did not give birth in the past 12 months Now married:
35.1% (611)Unmarried:
64.9% (1,130)
Marital status - Black or African American population 15 years and over
Males 80.6% Never married19.4% Now married0.0% Separated0.0% Widowed0.0% DivorcedFemales 0.0% Never married36.8% Now married0.0% Separated44.3% Widowed18.9% DivorcedWomen who did not give birth in the past 12 months Now married:
100.0% (11)Unmarried:
0.0% (0)
Marital status - American Indian / Alaska Native population 15 years and over
Males 2.9% Never married91.2% Now married0.0% Separated0.0% Widowed5.9% DivorcedFemales 21.1% Never married8.5% Now married14.1% Separated28.2% Widowed28.2% DivorcedWomen who gave birth in the past 12 months Now married:
0.0% (0)Unmarried:
100.0% (4)
Women who did not give birth in the past 12 months Now married:
0.0% (0)Unmarried:
100.0% (33)
Marital status - Asian population 15 years and over
Males 87.5% Never married12.5% Now married0.0% Separated0.0% Widowed0.0% DivorcedFemales 30.2% Never married63.5% Now married0.0% Separated0.0% Widowed6.2% DivorcedWomen who did not give birth in the past 12 months Now married:
3.3% (1)Unmarried:
96.7% (31)
Marital status - Other race population 15 years and over
Males 20.1% Never married79.9% Now married0.0% Separated0.0% Widowed0.0% DivorcedFemales 25.7% Never married56.6% Now married0.0% Separated7.2% Widowed10.6% DivorcedWomen who gave birth in the past 12 months Now married:
100.0% (4)Unmarried:
0.0% (0)
Women who did not give birth in the past 12 months Now married:
52.4% (137)Unmarried:
47.6% (125)
Marital status - Two or more races population 15 years and over
Males 58.9% Never married28.9% Now married0.0% Separated9.9% Widowed2.2% DivorcedFemales 41.1% Never married24.3% Now married2.2% Separated4.7% Widowed27.6% DivorcedWomen who gave birth in the past 12 months Now married:
0.0% (0)Unmarried:
100.0% (127)
Women who did not give birth in the past 12 months Now married:
23.1% (90)Unmarried:
76.9% (298)
Marital status - White alone, not Hispanic / Latino population 15 years and over
Males 27.2% Never married53.0% Now married0.1% Separated4.2% Widowed15.4% DivorcedFemales 21.9% Never married46.8% Now married0.3% Separated13.8% Widowed17.1% DivorcedWomen who gave birth in the past 12 months Now married:
78.6% (33)Unmarried:
21.4% (9)
Women who did not give birth in the past 12 months Now married:
42.6% (689)Unmarried:
57.4% (929)
Marital status - Hispanic or Latino population 15 years and over
Males 47.7% Never married44.2% Now married0.0% Separated4.0% Widowed4.1% DivorcedFemales 43.7% Never married28.0% Now married1.0% Separated3.3% Widowed24.1% DivorcedWomen who gave birth in the past 12 months Now married:
3.6% (3)Unmarried:
96.4% (84)
Women who did not give birth in the past 12 months Now married:
21.3% (198)Unmarried:
78.7% (732)
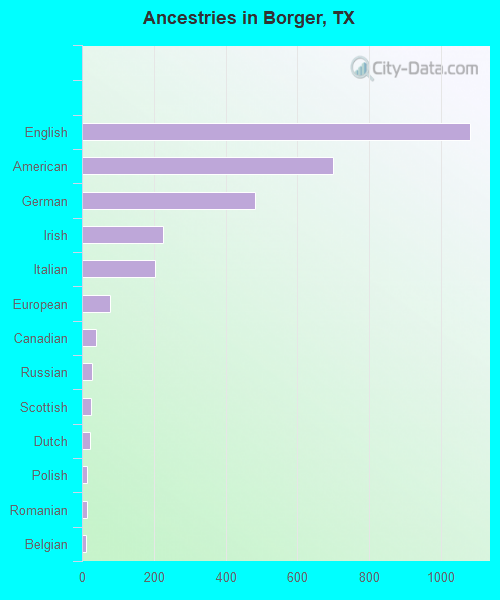
Ancestries in Borger
1,080 15.7% English699 10.2% American481 7.0% German226 3.3% Irish204 3.0% Italian77 1.1% European39 0.6% Canadian28 0.4% Russian26 0.4% Scottish22 0.3% Dutch13 0.2% Polish13 0.2% Romanian10 0.1% Belgian9 0.1% Eastern European7 0.1% Cajun7 0.1% Swedish6 0.09% Scandinavian6 0.09% Welsh4 0.06% Norwegian4 0.06% Scotch-Irish2 0.03% African
Children Nativity (place of birth) in Borger
Children under 6 years - Living with two parents Both parents native 282 100.0% NativeBoth parents foreign-born 12 100.0% NativeOne native, one foreign-born parent 130 100.0% NativeChildren under 6 years - Living with one parent Native parent 249 100.0% NativeForeign-born parent 102 100.0% NativeChildren 6 to 17 years - Living with two parents Both parents native 1,149 100.0% NativeBoth parents foreign-born 56 100.0% NativeOne native, one foreign-born parent 67 100.0% NativeChildren 6 to 17 years - Living with one parent Native parent 609 100.0% NativeForeign-born parent 114 61.9% Native70 38.1% Foreign-born
Grandparents responsible for own grandchildren in Borger
Grandparents (30 to 59 years) White / Caucasian 39 75.3% Responsible for grandchildren13 24.7% Not responsible for grandchildrenBlack or African American 8 100.0% Responsible for grandchildrenOther race 14 100.0% Not responsible for grandchildrenTwo or more races 70 100.0% Responsible for grandchildrenWhite alone, not Hispanic / Latino 51 100.0% Responsible for grandchildrenHispanic or Latino 41 57.5% Responsible for grandchildren30 42.5% Not responsible for grandchildrenGrandparents (60 years and over) White / Caucasian 22 24.9% Responsible for grandchildren65 75.1% Not responsible for grandchildrenBlack or African American 39 100.0% Responsible for grandchildrenOther race 8 100.0% Not responsible for grandchildrenWhite alone, not Hispanic / Latino 26 22.3% Responsible for grandchildren89 77.7% Not responsible for grandchildrenHispanic or Latino 7 100.0% Not responsible for grandchildren