Races in Bonney Lake, Washington (WA) Detailed Stats
Ancestries, Foreign-born residents, place of birth
Settings
X


Recent posts about races in Bonney Lake, Washington on our local forum with over 2,400,000 registered users:

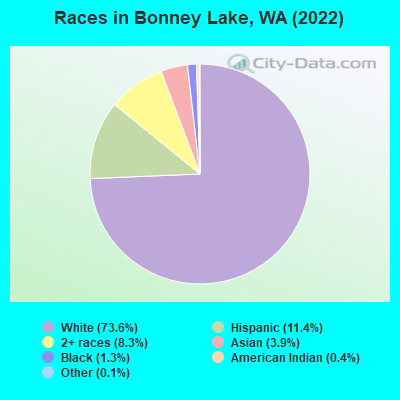
According to 2022 data, the most numerous races in Bonney Lake, WA are White alone (16,778 residents), Hispanic (2,592 residents), and Asian alone (880 residents). 89.3% of Bonney Lake residents speak English at home. 5.4% of Bonney Lake, WA residents are foreign-born (1.8% born in Latin America, 1.7% born in Asia, 1.2% born in Europe), which is 180.0% less than the foreign-born rate of 15.0% across the entire state of Washington.
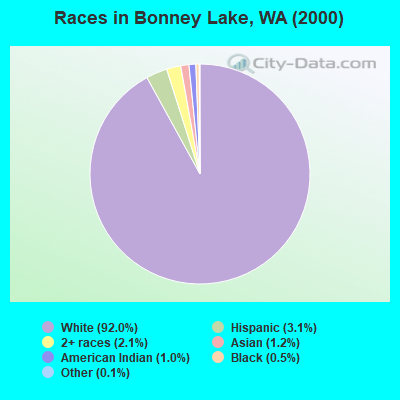
Race distribution in Bonney Lake
2000
2022

- 8,90892.0%White alone
- 2983.1%Hispanic
- 2062.1%Two or more races
- 1141.2%Asian alone
- 941.0%American Indian alone
- 500.5%Black alone
- 100.1%Other race alone
- 70.07%Native Hawaiian and Other
Pacific Islander alone
-
- 16,77873.6%White alone
- 2,59211.4%Hispanic
- 1,8898.3%Two or more races
- 8803.9%Asian alone
- 2871.3%Black alone
- 940.4%American Indian alone
- 280.1%Other race alone
- 190.08%Native Hawaiian and Other
Pacific Islander alone
2000
2022
-
- 4,652,49078.9%White alone
- 441,5097.5%Hispanic
- 319,4015.4%Asian alone
- 184,6313.1%Black alone
- 175,9263.0%Two or more races
- 85,3961.4%American Indian alone
- 22,7790.4%Native Hawaiian and Other
Pacific Islander alone - 11,9890.2%Other race alone

-
- 4,941,45663.5%White alone
- 1,093,31314.0%Hispanic
- 755,8329.7%Asian alone
- 523,4486.7%Two or more races
- 299,5373.8%Black alone
- 69,0240.9%American Indian alone
- 52,2310.7%Native Hawaiian and Other
Pacific Islander alone - 50,9450.7%Other race alone

Income and house value in Bonney Lake
- Median household income in 2022
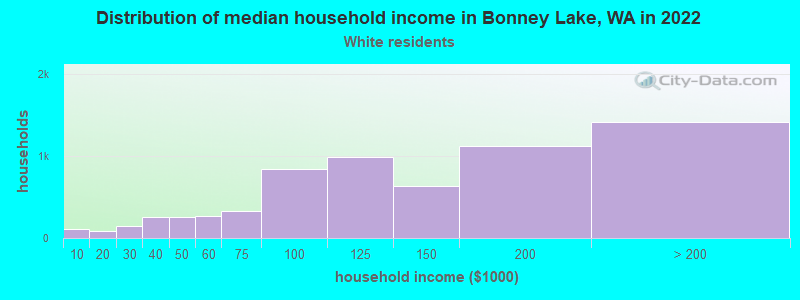
- $124,895White non-Hispanic householders
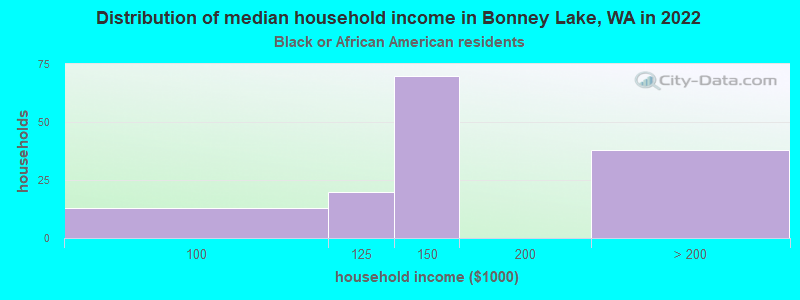
- $144,679Black householders
- $154,762Asian householders
- $93,506Two or more races householders
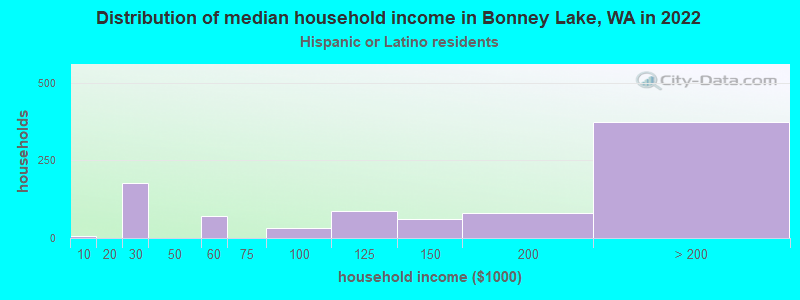
- $185,145Hispanic or Latino race householders
- Median 2022 house value
- $626,740White Non-Hispanic householders
- over $1,000,000Black or African American householders
- $640,536American Indian or Alaska Native householders
- $541,992Asian householders
- $177,379Some other race householders
- $777,315Two or more races householders
- $614,521Hispanic or Latino householders
Household income for White non-Hispanic householders
Household income for Black householders
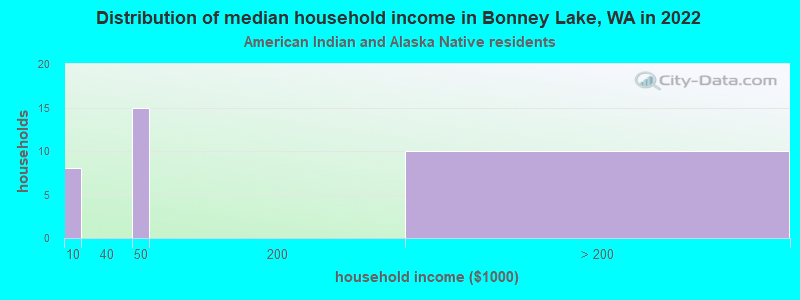
Household income for American Indian and Alaska Native householders
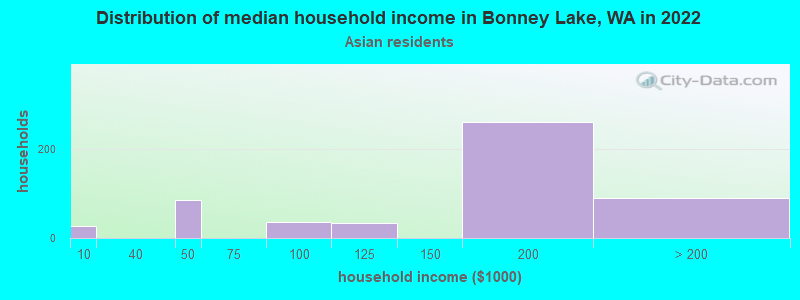
Household income for Asian householders
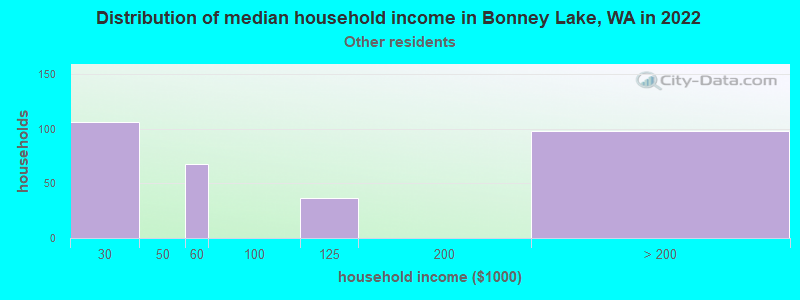
Household income for Some other race householders
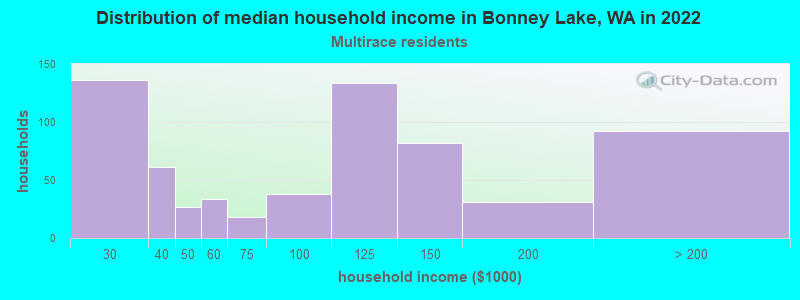
Household income for Two or more races householders
Household income for Hispanic or Latino race householders
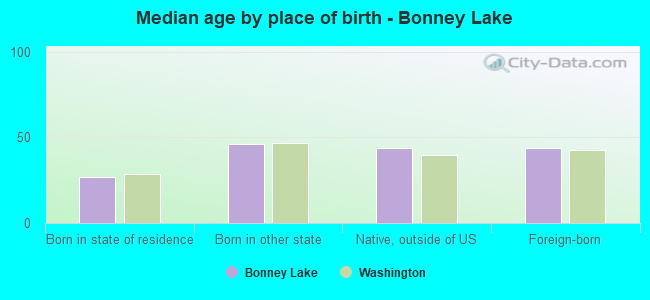
Median age by race in Bonney Lake
- 39.1Median age for White residents
- 39.1Males
- 39.4Females
- 43.9Median age for Black or African American residents
- 44.3Males
- 28.6Females
- 23.9Median age for American Indian / Alaska Native residents
- 26.1Males
- 38.7Females
- 41.5Median age for Asian residents
- 36.4Males
- 42.4Females
- 29.2Median age for Native Hawaiian / Pacific Islander residents
- 59.8Males
- 12.8Females
- 42.3Median age for Other race residents
- 51.6Males
- 42.4Females
- 22.8Median age for Two or more races residents
- 24.4Males
- 17.6Females
- 39.5Median age for White alone residents
- 39.3Males
- 39.7Females
- 21.5Median age for Hispanic or Latino residents
- 19.4Males
- 26.8Females
Owner/renter occupied households by race in Bonney Lake
- House owners and renters - White residents
- 5,02678.4%Owner occupied
- 1,38621.6%Renter occupied
- House owners and renters - Black or African American residents
- 12691.1%Owner occupied
- 128.9%Renter occupied
- House owners and renters - American Indian / Alaska Native residents
- 24100.0%Owner occupied
- House owners and renters - Asian residents
- 484100.0%Owner occupied
- House owners and renters - Native Hawaiian / Pacific Islander residents
- 6100.0%Owner occupied
- House owners and renters - Other race residents
- 12055.5%Owner occupied
- 9644.5%Renter occupied
- House owners and renters - Two or more races residents
- 49279.3%Owner occupied
- 12820.7%Renter occupied
- House owners and renters - White alone residents
- 4,95979.3%Owner occupied
- 1,29320.7%Renter occupied
- House owners and renters - Hispanic or Latino residents
- 46066.2%Owner occupied
- 23533.8%Renter occupied
Language usage in Bonney Lake
- English speakers - Total
- 89.3% of residents of Bonney Lake speak English at home.
- 4.4% of residents speak Spanish at home
- 65468.6%Speak English very well
- 30031.4%Speak English less than very well
- 5.9% of residents speak other language at home
- 95575.5%Speak English very well
- 31024.5%Speak English less than very well
- English speakers - Born in the United States
- 95.2% of residents of Bonney Lake speak English at home.
- 3.5% of residents speak Spanish at home
- 24390.7%Speak English very well
- 259.3%Speak English less than very well
- 1.4% of residents speak other language at home
- 4945.0%Speak English very well
- 6055.0%Speak English less than very well
- English speakers - Native, born elsewhere
- 67.8% of residents of Bonney Lake speak English at home.
- 13.3% of residents speak Spanish at home
- 50100.0%Speak English very well
- 18.6% of residents speak other language at home
- 6288.6%Speak English very well
- 811.4%Speak English less than very well
- English speakers - Foreign-born
- 23.5% of residents of Bonney Lake speak English at home.
- 21.5% of residents speak Spanish at home
- 9936.7%Speak English very well
- 17163.3%Speak English less than very well
- 54.0% of residents speak other language at home
- 49773.2%Speak English very well
- 18226.8%Speak English less than very well
White (Caucasian) - Speak only English
| Native: | 97.3% (15,775) |
| Foreign-born: | 32.2% (133) |
White (Caucasian) - Speak another language
| Native: | 2.7% (443) |
| Foreign-born: | 67.1% (277) |
Asian - Speak only English
| Native: | 58.6% (297) |
| Foreign-born: | 42.1% (168) |
Asian - Speak another language
| Native: | 40.6% (206) |
| Foreign-born: | 63.8% (254) |
Other race - Speak another language
| Native: | 39.6% (118) |
| Foreign-born: | 99.0% (129) |
Two or more races - Speak only English
| Native: | 86.3% (2,028) |
| Foreign-born: | 5.5% (20) |
Two or more races - Speak another language
| Native: | 13.4% (315) |
| Foreign-born: | 99.3% (361) |
White alone - Speak only English
| Native: | 97.7% (15,279) |
| Foreign-born: | 32.5% (141) |
White alone - Speak another language
| Native: | 2.3% (358) |
| Foreign-born: | 67.1% (290) |
Hispanic or Latino - Speak another language
| Native: | 25.0% (490) |
| Foreign-born: | 100.0% (287) |
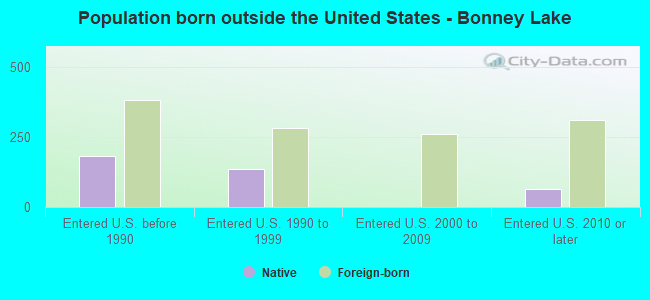
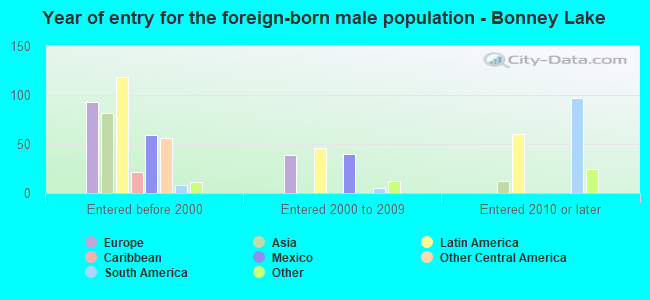
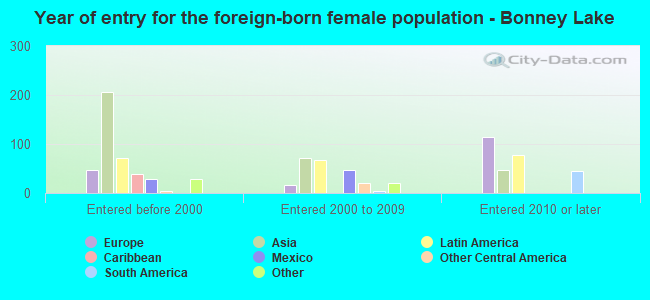
Foreign-born residents in Bonney Lake
1,221 residents are foreign born (1.8% Latin America, 1.7% Asia, 1.2% Europe).
| This city: | 5.4% |
| Washington: | 14.9% |

Marital status for residents in Bonney Lake
Marital status - White (Caucasian) population 15 years and over
- Males
- 31.5%Never married
- 57.2%Now married
- 1.8%Separated
- 2.0%Widowed
- 7.5%Divorced
- Females
- 25.0%Never married
- 57.4%Now married
- 1.3%Separated
- 6.3%Widowed
- 9.9%Divorced
Women who gave birth in the past 12 months
| Now married: | 71.7% (171) |
| Unmarried: | 28.3% (68) |
Women who did not give birth in the past 12 months
| Now married: | 55.2% (2,258) |
| Unmarried: | 44.8% (1,834) |
Marital status - Black or African American population 15 years and over
- Males
- 0.0%Never married
- 100.0%Now married
- 0.0%Separated
- 0.0%Widowed
- 0.0%Divorced
- Females
- 62.1%Never married
- 11.4%Now married
- 0.0%Separated
- 9.1%Widowed
- 17.4%Divorced
Women who did not give birth in the past 12 months
| Now married: | 12.5% (15) |
| Unmarried: | 87.5% (103) |
Marital status - American Indian / Alaska Native population 15 years and over
- Males
- 75.4%Never married
- 24.6%Now married
- 0.0%Separated
- 0.0%Widowed
- 0.0%Divorced
- Females
- 26.8%Never married
- 59.8%Now married
- 0.0%Separated
- 0.0%Widowed
- 13.4%Divorced
Women who did not give birth in the past 12 months
| Now married: | 28.3% (13) |
| Unmarried: | 71.7% (32) |
Marital status - Asian population 15 years and over
- Males
- 23.3%Never married
- 72.3%Now married
- 0.0%Separated
- 0.0%Widowed
- 4.4%Divorced
- Females
- 0.0%Never married
- 90.8%Now married
- 0.0%Separated
- 0.0%Widowed
- 9.2%Divorced
Women who gave birth in the past 12 months
| Now married: | 100.0% (51) |
| Unmarried: | 0.0% (0) |
Women who did not give birth in the past 12 months
| Now married: | 100.0% (160) |
| Unmarried: | 0.0% (0) |
Marital status - Native Hawaiian / Pacific Islander population 15 years and over
- Males
- 0.0%Never married
- 61.1%Now married
- 0.0%Separated
- 38.9%Widowed
- 0.0%Divorced
- Females
- 0.0%Never married
- 100.0%Now married
- 0.0%Separated
- 0.0%Widowed
- 0.0%Divorced
Women who did not give birth in the past 12 months
| Now married: | 100.0% (6) |
| Unmarried: | 0.0% (0) |
Marital status - Other race population 15 years and over
- Males
- 31.7%Never married
- 62.6%Now married
- 0.0%Separated
- 0.0%Widowed
- 5.7%Divorced
- Females
- 0.0%Never married
- 58.1%Now married
- 0.0%Separated
- 16.9%Widowed
- 25.0%Divorced
Women who did not give birth in the past 12 months
| Now married: | 49.1% (125) |
| Unmarried: | 50.9% (129) |
Marital status - Two or more races population 15 years and over
- Males
- 33.4%Never married
- 52.2%Now married
- 0.8%Separated
- 3.5%Widowed
- 10.2%Divorced
- Females
- 45.1%Never married
- 37.3%Now married
- 0.0%Separated
- 10.2%Widowed
- 7.5%Divorced
Women who gave birth in the past 12 months
| Now married: | 100.0% (57) |
| Unmarried: | 0.0% (0) |
Women who did not give birth in the past 12 months
| Now married: | 19.9% (91) |
| Unmarried: | 80.1% (364) |
Marital status - White alone, not Hispanic / Latino population 15 years and over
- Males
- 30.2%Never married
- 58.4%Now married
- 1.9%Separated
- 2.1%Widowed
- 7.4%Divorced
- Females
- 24.5%Never married
- 58.1%Now married
- 1.3%Separated
- 6.4%Widowed
- 9.7%Divorced
Women who gave birth in the past 12 months
| Now married: | 71.7% (176) |
| Unmarried: | 28.3% (70) |
Women who did not give birth in the past 12 months
| Now married: | 56.1% (2,306) |
| Unmarried: | 43.9% (1,804) |
Marital status - Hispanic or Latino population 15 years and over
- Males
- 41.5%Never married
- 44.8%Now married
- 0.0%Separated
- 0.0%Widowed
- 13.7%Divorced
- Females
- 27.1%Never married
- 45.8%Now married
- 1.0%Separated
- 7.9%Widowed
- 18.2%Divorced
Women who did not give birth in the past 12 months
| Now married: | 34.3% (170) |
| Unmarried: | 65.7% (326) |
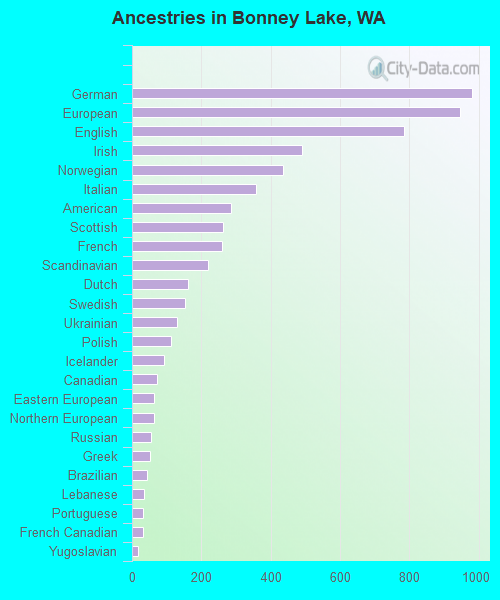
Ancestries in Bonney Lake

- 98110.9%German
- 94610.5%European
- 7848.7%English
- 4905.5%Irish
- 4354.8%Norwegian
- 3574.0%Italian
- 2863.2%American
- 2642.9%Scottish
- 2602.9%French
- 2182.4%Scandinavian
- 1621.8%Dutch
- 1521.7%Swedish
- 1311.5%Ukrainian
- 1121.2%Polish
- 921.0%Icelander
- 710.8%Canadian
- 630.7%Eastern European
- 630.7%Northern European
- 540.6%Russian
- 510.6%Greek
- 420.5%Brazilian
- 340.4%Lebanese
- 330.4%Portuguese
- 310.3%French Canadian
- 160.2%Yugoslavian
- 150.2%British
- 140.2%Scotch-Irish
- 80.09%Hungarian
- 60.07%Swiss
- 20.02%Czech
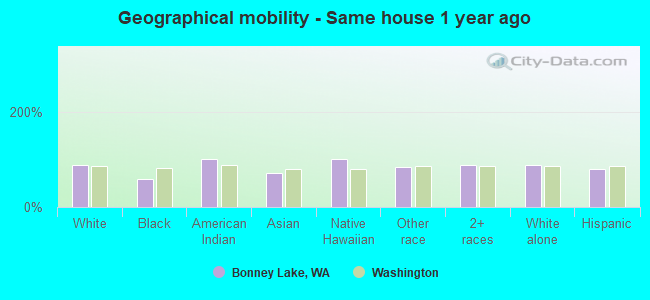
Geographical mobility in Bonney Lake

- Same house 1 year ago
- 14,86786.6%White (Caucasian)
- 17457.9%Black or African American
- 157100.0%American Indian / Alaska Native
- 77172.4%Asian
- 42100.0%Native Hawaiian / Pacific Islander
- 40782.7%Other race
- 2,72386.8%Two or more races
- 14,67788.1%White alone, not Hispanic / Latino
- 2,04678.5%Hispanic or Latino
-
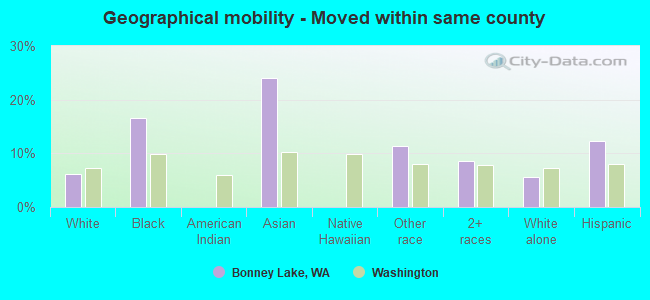
- Moved within same county
- 1,0406.1%White / Caucasian
- 5016.6%Black or African American
- 25624.0%Asian
- 5611.4%Other race
- 2688.6%Two or more races
- 9385.6%White alone, not Hispanic / Latino
- 32012.3%Hispanic or Latino
-
- Moved within same state
- 9425.5%White / Caucasian
- 4715.8%Black or African American
- 85.7%American Indian / Alaska Native
- 565.2%Asian
- 459.2%Other race
- 451.4%Two or more races
- 7994.8%White alone, not Hispanic / Latino
- 2188.4%Hispanic or Latino

-
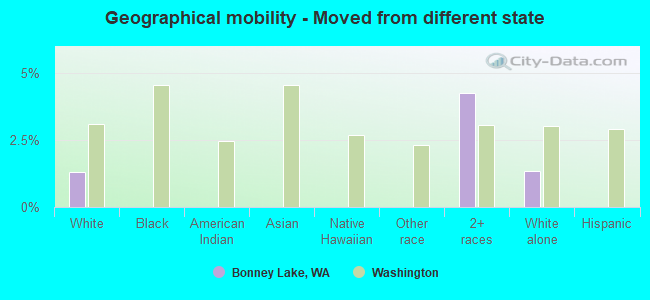
- Moved from different state
- 2261.3%White / Caucasian
- 1334.2%Two or more races
- 2241.3%White alone, not Hispanic / Latino
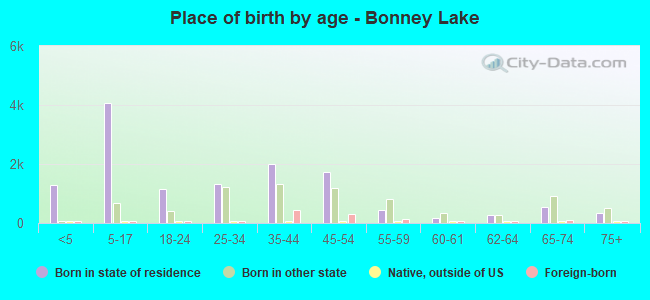
Children Nativity (place of birth) in Bonney Lake
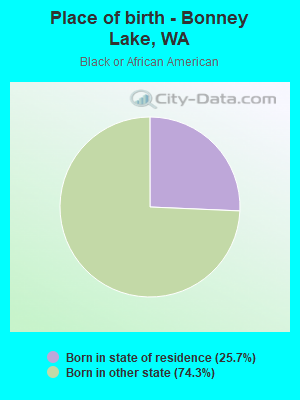
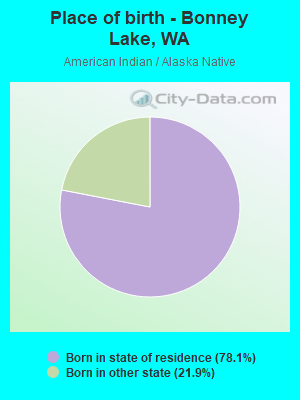
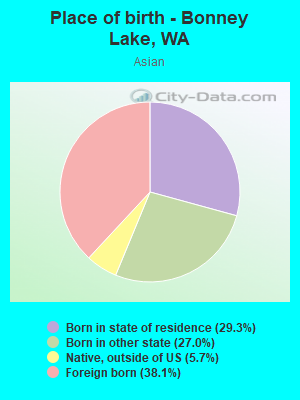
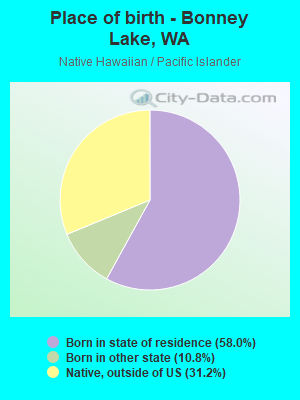
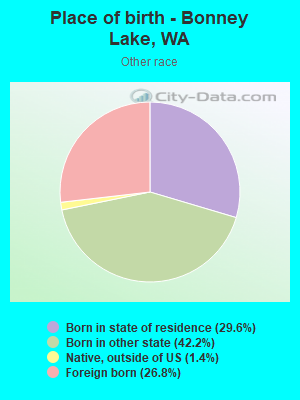
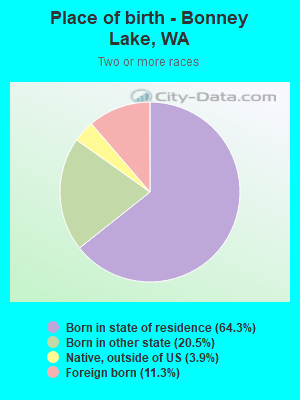
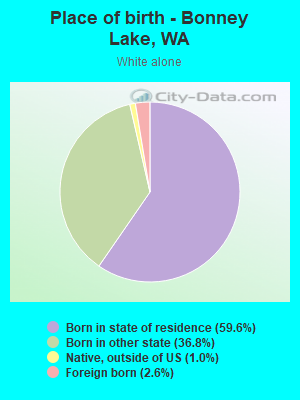
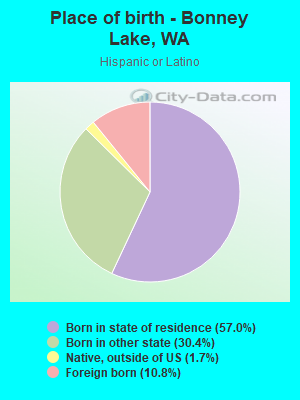
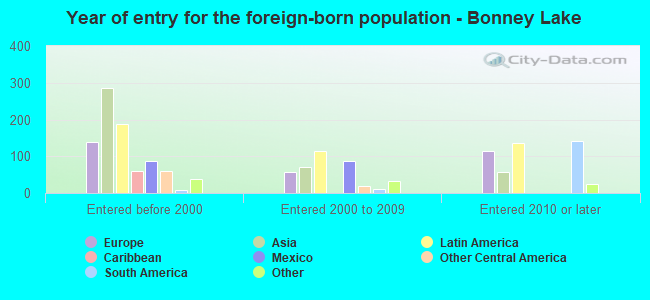
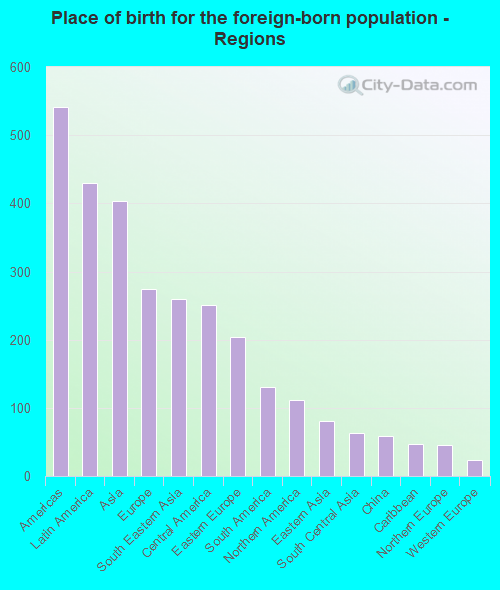
Place of birth for residents in Bonney Lake
![Place of birth for the foreign-born population - Regions]()
- 541Americas
- 430Latin America
- 404Asia
- 275Europe
- 259South Eastern Asia
- 251Central America
- 204Eastern Europe
- 130South America
- 111Northern America
- 81Eastern Asia
- 63South Central Asia
- 59China
- 47Caribbean
- 46Northern Europe
- 23Western Europe
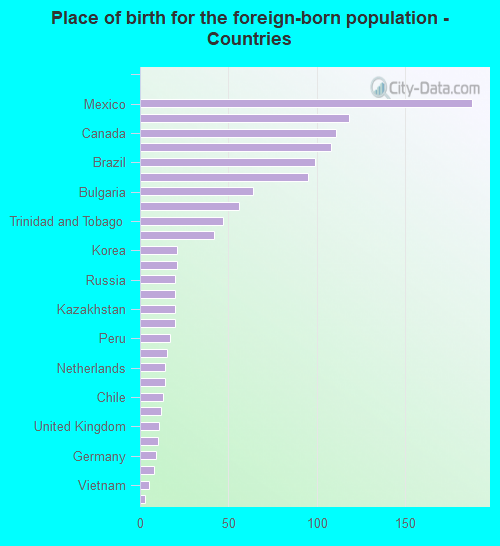
![Place of birth for the foreign-born population - Countries]()
- 188Mexico
- 118Philippines
- 111Canada
- 108Cambodia
- 99Brazil
- 95Ukraine
- 64Bulgaria
- 56China
- 47Trinidad and Tobago
- 42Costa Rica
- 21Korea
- 21India
- 20Russia
- 20Iran
- 20Kazakhstan
- 20Guatemala
- 17Peru
- 15Poland
- 14Netherlands
- 14Malaysia
- 13Chile
- 12Denmark
- 11United Kingdom
- 10England
- 9Germany
- 8Romania
- 5Vietnam
- 3Hong Kong
Grandparents responsible for own grandchildren in Bonney Lake
Zip codes: 98321.