Races in Bellmore, New York (NY) Detailed Stats
Data:
Races - White alone (%)
Races - White alone (% change since 2000)
Races - Black alone (%)
Races - Black alone (% change since 2000)
Races - American Indian alone (%)
Races - American Indian alone (% change since 2000)
Races - Asian alone (%)
Races - Asian alone (% change since 2000)
Races - Hispanic (%)
Races - Hispanic (% change since 2000)
Races - Native Hawaiian and Other Pacific Islander alone (%)
Races - Native Hawaiian and Other Pacific Islander alone (% change since 2000)
Races - Two or more races(%)
Races - Two or more races(% change since 2000)
Races - Other race alone (%)
Races - Other race alone (% change since 2000)
Racial diversity
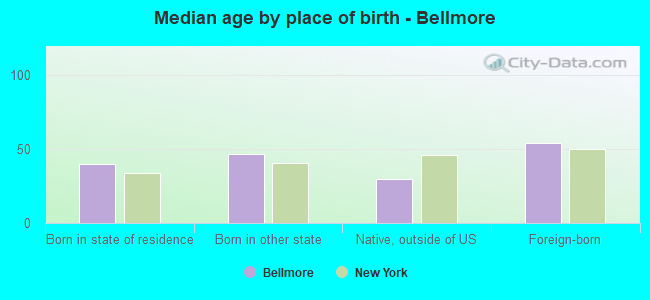
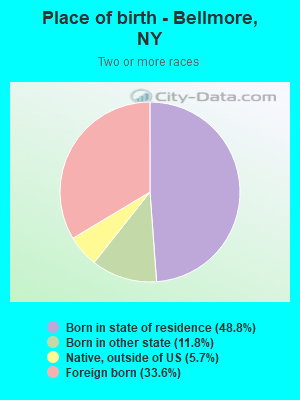
Place of birth - Born in state of residence (%)
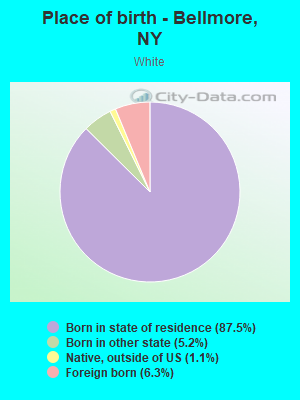
Place of birth - Born in state of residence (%) - White
Place of birth - Born in state of residence (%) - Black or African American
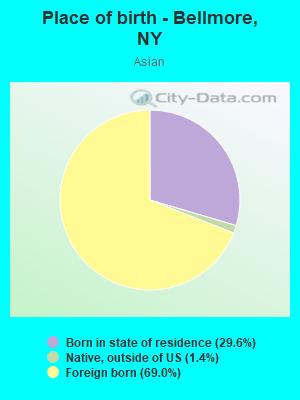
Place of birth - Born in state of residence (%) - Asian
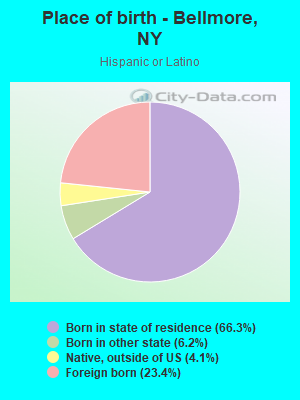
Place of birth - Born in state of residence (%) - Hispanic or Latino
Place of birth - Born in state of residence (%) - American Indian and Alaska Native
Place of birth - Born in state of residence (%) - Multirace
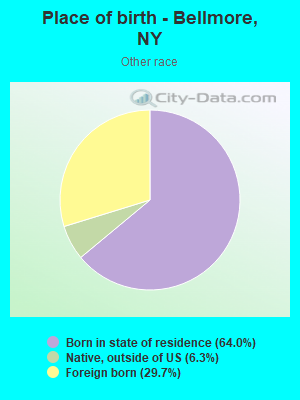
Place of birth - Born in state of residence (%) - Other Race
Place of birth - Born in other state (%)
Place of birth - Born in other state (%) - White
Place of birth - Born in other state (%) - Black or African American
Place of birth - Born in other state (%) - Asian
Place of birth - Born in other state (%) - Hispanic or Latino
Place of birth - Born in other state (%) - American Indian and Alaska Native
Place of birth - Born in other state (%) - Multirace
Place of birth - Born in other state (%) - Other Race
Place of birth - Native, outside of US (%)
Place of birth - Native, outside of US (%) - White
Place of birth - Native, outside of US (%) - Black or African American
Place of birth - Native, outside of US (%) - Asian
Place of birth - Native, outside of US (%) - Hispanic or Latino
Place of birth - Native, outside of US (%) - American Indian and Alaska Native
Place of birth - Native, outside of US (%) - Multirace
Place of birth - Native, outside of US (%) - Other Race
Place of birth - Foreign born (%)
Place of birth - Foreign born (%) - White
Place of birth - Foreign born (%) - Black or African American
Place of birth - Foreign born (%) - Asian
Place of birth - Foreign born (%) - Hispanic or Latino
Place of birth - Foreign born (%) - American Indian and Alaska Native
Place of birth - Foreign born (%) - Multirace
Place of birth - Foreign born (%) - Other Race
Residents speaking English at home (%)
Residents speaking English at home - Born in the United States (%)
Residents speaking English at home - Native, born elsewhere (%)
Residents speaking English at home - Foreign born (%)
Residents speaking Spanish at home (%)
Residents speaking Spanish at home - Born in the United States (%)
Residents speaking Spanish at home - Native, born elsewhere (%)
Residents speaking Spanish at home - Foreign born (%)
Residents speaking other language at home (%)
Residents speaking other language at home - Born in the United States (%)
Residents speaking other language at home - Native, born elsewhere (%)
Residents speaking other language at home - Foreign born (%)
Marital status - Never married (%)
Marital status - Now married (%)
Marital status - Separated (%)
Marital status - Widowed (%)
Marital status - Divorced (%)
Ancestries Reported - Arab (%)
Ancestries Reported - Czech (%)
Ancestries Reported - Danish (%)
Ancestries Reported - Dutch (%)
Ancestries Reported - English (%)
Ancestries Reported - French (%)
Ancestries Reported - French Canadian (%)
Ancestries Reported - German (%)
Ancestries Reported - Greek (%)
Ancestries Reported - Hungarian (%)
Ancestries Reported - Irish (%)
Ancestries Reported - Italian (%)
Ancestries Reported - Lithuanian (%)
Ancestries Reported - Norwegian (%)
Ancestries Reported - Polish (%)
Ancestries Reported - Portuguese (%)
Ancestries Reported - Russian (%)
Ancestries Reported - Scotch-Irish (%)
Ancestries Reported - Scottish (%)
Ancestries Reported - Slovak (%)
Ancestries Reported - Subsaharan African (%)
Ancestries Reported - Swedish (%)
Ancestries Reported - Swiss (%)
Ancestries Reported - Ukrainian (%)
Ancestries Reported - United States (%)
Ancestries Reported - Welsh (%)
Ancestries Reported - West Indian (%)
Ancestries Reported - Other (%)
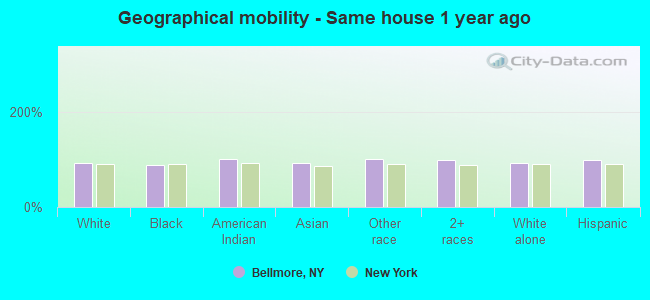
Geographical mobility - Same house 1 year ago (%)
Geographical mobility - Same house 1 year ago (%) - White
Geographical mobility - Same house 1 year ago (%) - Black or African American
Geographical mobility - Same house 1 year ago (%) - Asian
Geographical mobility - Same house 1 year ago (%) - Hispanic or Latino
Geographical mobility - Same house 1 year ago (%) - American Indian and Alaska Native
Geographical mobility - Same house 1 year ago (%) - Multirace
Geographical mobility - Same house 1 year ago (%) - Other Race
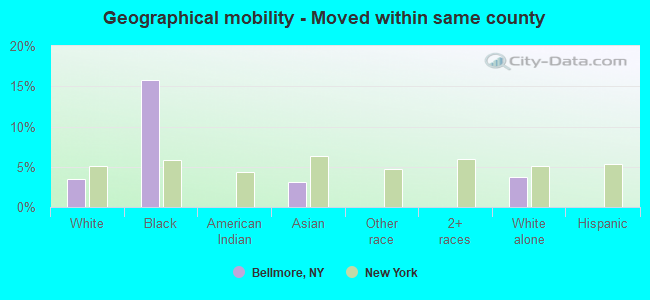
Geographical mobility - Moved within same county (%)
Geographical mobility - Moved within same county (%) - White
Geographical mobility - Moved within same county (%) - Black or African American
Geographical mobility - Moved within same county (%) - Asian
Geographical mobility - Moved within same county (%) - Hispanic or Latino
Geographical mobility - Moved within same county (%) - American Indian and Alaska Native
Geographical mobility - Moved within same county (%) - Multirace
Geographical mobility - Moved within same county (%) - Other Race
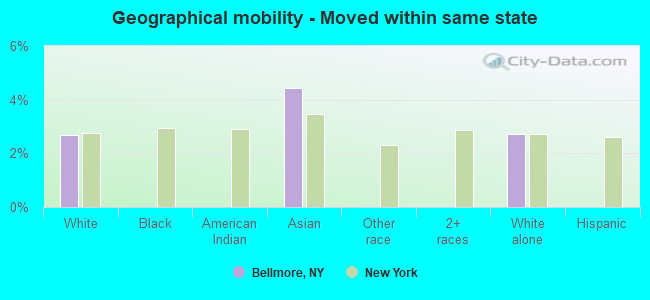
Geographical mobility - Moved from different county within same state (%)
Geographical mobility - Moved from different county within same state (%) - White
Geographical mobility - Moved from different county within same state (%) - Black or African American
Geographical mobility - Moved from different county within same state (%) - Asian
Geographical mobility - Moved from different county within same state (%) - Hispanic or Latino
Geographical mobility - Moved from different county within same state (%) - American Indian and Alaska Native
Geographical mobility - Moved from different county within same state (%) - Multirace
Geographical mobility - Moved from different county within same state (%) - Other Race
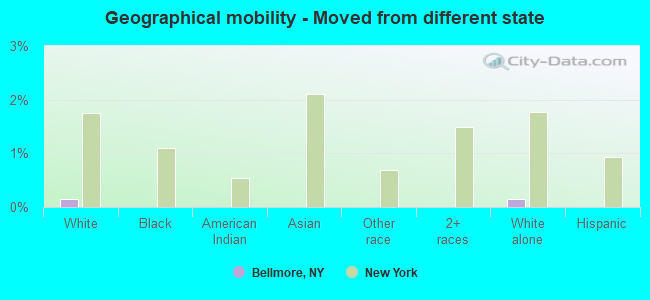
Geographical mobility - Moved from different state (%)
Geographical mobility - Moved from different state (%) - White
Geographical mobility - Moved from different state (%) - Black or African American
Geographical mobility - Moved from different state (%) - Asian
Geographical mobility - Moved from different state (%) - Hispanic or Latino
Geographical mobility - Moved from different state (%) - American Indian and Alaska Native
Geographical mobility - Moved from different state (%) - Multirace
Geographical mobility - Moved from different state (%) - Other Race
Geographical mobility - Moved from abroad (%)
Geographical mobility - Moved from abroad (%) - White
Geographical mobility - Moved from abroad (%) - Black or African American
Geographical mobility - Moved from abroad (%) - Asian
Geographical mobility - Moved from abroad (%) - Hispanic or Latino
Geographical mobility - Moved from abroad (%) - American Indian and Alaska Native
Geographical mobility - Moved from abroad (%) - Multirace
Geographical mobility - Moved from abroad (%) - Other Race
Place of birth for the foreign-born population - Ireland (%)
Place of birth for the foreign-born population - Denmark (%)
Place of birth for the foreign-born population - Norway (%)
Place of birth for the foreign-born population - Sweden (%)
Place of birth for the foreign-born population - United Kingdom (%)
Place of birth for the foreign-born population - England (%)
Place of birth for the foreign-born population - Scotland (%)
Place of birth for the foreign-born population - Other Northern Europe (%)
Place of birth for the foreign-born population - Austria (%)
Place of birth for the foreign-born population - Belgium (%)
Place of birth for the foreign-born population - France (%)
Place of birth for the foreign-born population - Germany (%)
Place of birth for the foreign-born population - Netherlands (%)
Place of birth for the foreign-born population - Switzerland (%)
Place of birth for the foreign-born population - Other Western Europe (%)
Place of birth for the foreign-born population - Greece (%)
Place of birth for the foreign-born population - Italy (%)
Place of birth for the foreign-born population - Portugal (%)
Place of birth for the foreign-born population - Spain (%)
Place of birth for the foreign-born population - Other Southern Europe (%)
Place of birth for the foreign-born population - Albania (%)
Place of birth for the foreign-born population - Belarus (%)
Place of birth for the foreign-born population - Bosnia and Herzegovina (%)
Place of birth for the foreign-born population - Bulgaria (%)
Place of birth for the foreign-born population - Croatia (%)
Place of birth for the foreign-born population - Czechoslovakia (%)
Place of birth for the foreign-born population - Hungary (%)
Place of birth for the foreign-born population - Latvia (%)
Place of birth for the foreign-born population - Lithuania (%)
Place of birth for the foreign-born population - North Macedonia (Macedonia) (%)
Place of birth for the foreign-born population - Moldova (%)
Place of birth for the foreign-born population - Poland (%)
Place of birth for the foreign-born population - Romania (%)
Place of birth for the foreign-born population - Russia (%)
Place of birth for the foreign-born population - Serbia (%)
Place of birth for the foreign-born population - Ukraine (%)
Place of birth for the foreign-born population - Other Eastern Europe (%)
Place of birth for the foreign-born population - China (%)
Place of birth for the foreign-born population - Hong Kong (%)
Place of birth for the foreign-born population - Taiwan (%)
Place of birth for the foreign-born population - Japan (%)
Place of birth for the foreign-born population - Korea (%)
Place of birth for the foreign-born population - Other Eastern Asia (%)
Place of birth for the foreign-born population - Afghanistan (%)
Place of birth for the foreign-born population - Bangladesh (%)
Place of birth for the foreign-born population - India (%)
Place of birth for the foreign-born population - Iran (%)
Place of birth for the foreign-born population - Kazakhstan (%)
Place of birth for the foreign-born population - Nepal (%)
Place of birth for the foreign-born population - Pakistan (%)
Place of birth for the foreign-born population - Sri Lanka (%)
Place of birth for the foreign-born population - Uzbekistan (%)
Place of birth for the foreign-born population - Other South Central Asia (%)
Place of birth for the foreign-born population - Burma (%)
Place of birth for the foreign-born population - Cambodia (%)
Place of birth for the foreign-born population - Indonesia (%)
Place of birth for the foreign-born population - Laos (%)
Place of birth for the foreign-born population - Malaysia (%)
Place of birth for the foreign-born population - Philippines (%)
Place of birth for the foreign-born population - Singapore (%)
Place of birth for the foreign-born population - Thailand (%)
Place of birth for the foreign-born population - Vietnam (%)
Place of birth for the foreign-born population - Other South Eastern Asia (%)
Place of birth for the foreign-born population - Armenia (%)
Place of birth for the foreign-born population - Iraq (%)
Place of birth for the foreign-born population - Israel (%)
Place of birth for the foreign-born population - Jordan (%)
Place of birth for the foreign-born population - Kuwait (%)
Place of birth for the foreign-born population - Lebanon (%)
Place of birth for the foreign-born population - Saudi Arabia (%)
Place of birth for the foreign-born population - Syria (%)
Place of birth for the foreign-born population - Turkey (%)
Place of birth for the foreign-born population - Yemen (%)
Place of birth for the foreign-born population - Other Western Asia (%)
Place of birth for the foreign-born population - Eritrea (%)
Place of birth for the foreign-born population - Ethiopia (%)
Place of birth for the foreign-born population - Kenya (%)
Place of birth for the foreign-born population - Somalia (%)
Place of birth for the foreign-born population - Uganda (%)
Place of birth for the foreign-born population - Zimbabwe (%)
Place of birth for the foreign-born population - Other Eastern Africa (%)
Place of birth for the foreign-born population - Cameroon (%)
Place of birth for the foreign-born population - Congo (%)
Place of birth for the foreign-born population - Democratic Republic of Congo (Zaire) (%)
Place of birth for the foreign-born population - Other Middle Africa (%)
Place of birth for the foreign-born population - Egypt (%)
Place of birth for the foreign-born population - Morocco (%)
Place of birth for the foreign-born population - Sudan (%)
Place of birth for the foreign-born population - Other Northern Africa (%)
Place of birth for the foreign-born population - South Africa (%)
Place of birth for the foreign-born population - Other Southern Africa (%)
Place of birth for the foreign-born population - Cabo Verde (%)
Place of birth for the foreign-born population - Ghana (%)
Place of birth for the foreign-born population - Liberia (%)
Place of birth for the foreign-born population - Nigeria (%)
Place of birth for the foreign-born population - Senegal (%)
Place of birth for the foreign-born population - Sierra Leone (%)
Place of birth for the foreign-born population - Other Western Africa (%)
Place of birth for the foreign-born population - Australia (%)
Place of birth for the foreign-born population - New Zealand (%)
Place of birth for the foreign-born population - Fiji (%)
Place of birth for the foreign-born population - Micronesia (%)
Place of birth for the foreign-born population - Bahamas (%)
Place of birth for the foreign-born population - Barbados (%)
Place of birth for the foreign-born population - Cuba (%)
Place of birth for the foreign-born population - Dominica (%)
Place of birth for the foreign-born population - Dominican Republic (%)
Place of birth for the foreign-born population - Grenada (%)
Place of birth for the foreign-born population - Haiti (%)
Place of birth for the foreign-born population - Jamaica (%)
Place of birth for the foreign-born population - St. Vincent and the Grenadines (%)
Place of birth for the foreign-born population - Trinidad and Tobago (%)
Place of birth for the foreign-born population - West Indies (%)
Place of birth for the foreign-born population - Other Caribbean (%)
Place of birth for the foreign-born population - Belize (%)
Place of birth for the foreign-born population - Costa Rica (%)
Place of birth for the foreign-born population - El Salvador (%)
Place of birth for the foreign-born population - Guatemala (%)
Place of birth for the foreign-born population - Honduras (%)
Place of birth for the foreign-born population - Mexico (%)
Place of birth for the foreign-born population - Nicaragua (%)
Place of birth for the foreign-born population - Panama (%)
Place of birth for the foreign-born population - Other Central America (%)
Place of birth for the foreign-born population - Argentina (%)
Place of birth for the foreign-born population - Bolivia (%)
Place of birth for the foreign-born population - Brazil (%)
Place of birth for the foreign-born population - Chile (%)
Place of birth for the foreign-born population - Colombia (%)
Place of birth for the foreign-born population - Ecuador (%)
Place of birth for the foreign-born population - Guyana (%)
Place of birth for the foreign-born population - Peru (%)
Place of birth for the foreign-born population - Uruguay (%)
Place of birth for the foreign-born population - Venezuela (%)
Place of birth for the foreign-born population - Other South America (%)
Place of birth for the foreign-born population - Canada (%)
Place of birth for the foreign-born population - Other Northern America (%)
Place of birth for the foreign-born population - Other (%)
Latest news about races in Bellmore, NY collected exclusively by city-data.com from local newspapers, TV, and radio stations
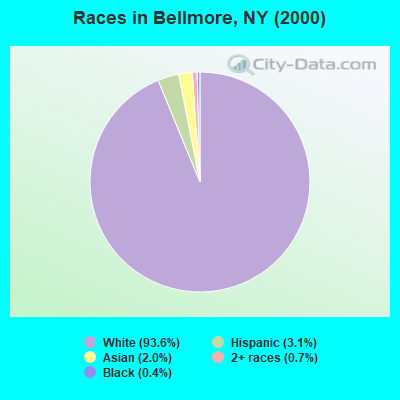
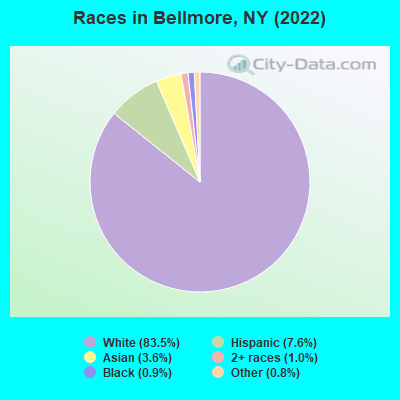
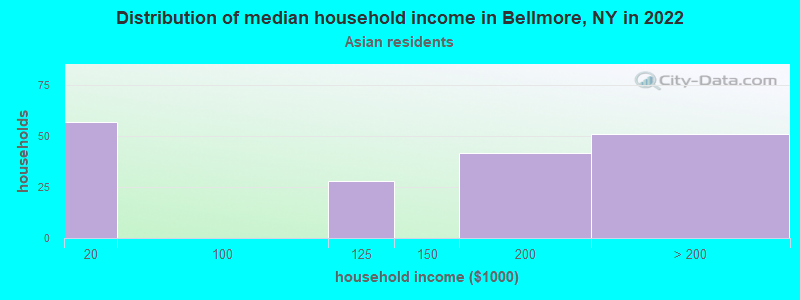
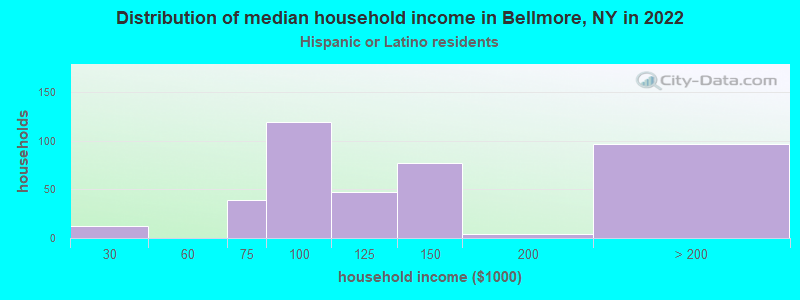
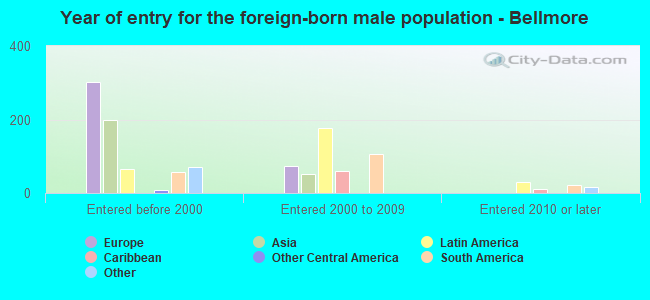
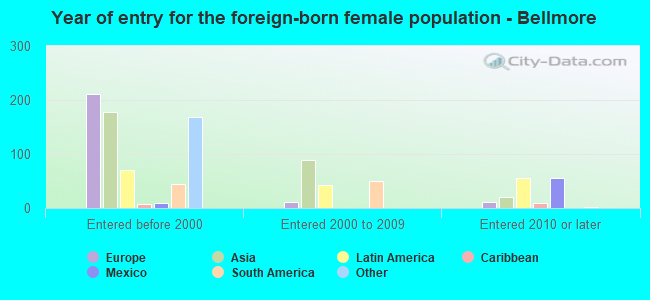
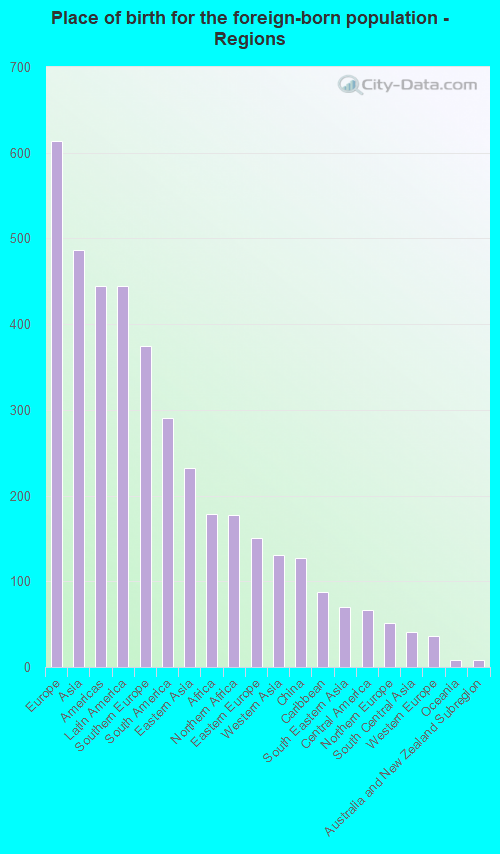
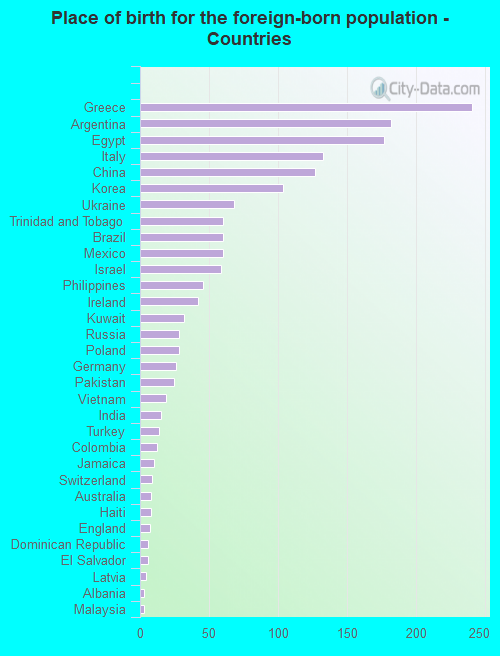
According to 2022 data, the most numerous races in Bellmore, NY are White alone (13,249 residents), Hispanic (1,209 residents), and Black alone (144 residents). 84.0% of Bellmore residents speak English at home. 10.9% of Bellmore, NY residents are foreign-born (3.9% born in Europe, 3.1% born in Asia, 2.8% born in Latin America, 1.1% born in Africa), which is 101.4% less than the foreign-born rate of 22.0% across the entire state of New York.
Race distribution in Bellmore
2000 2022
11,760,981 62.0% White alone 2,867,583 15.1% Hispanic 2,812,623 14.8% Black alone 1,035,926 5.5% Asian alone 366,116 1.9% Two or more races 75,499 0.4% Other race alone 52,499 0.3% American Indian alone 5,230 0.03% Native Hawaiian and Other
10,408,933 52.9% White alone 3,867,299 19.7% Hispanic 2,633,840 13.4% Black alone 1,776,286 9.0% Asian alone 732,670 3.7% Two or more races 216,110 1.1% Other race alone 35,082 0.2% American Indian alone 6,931 0.04% Native Hawaiian and Other
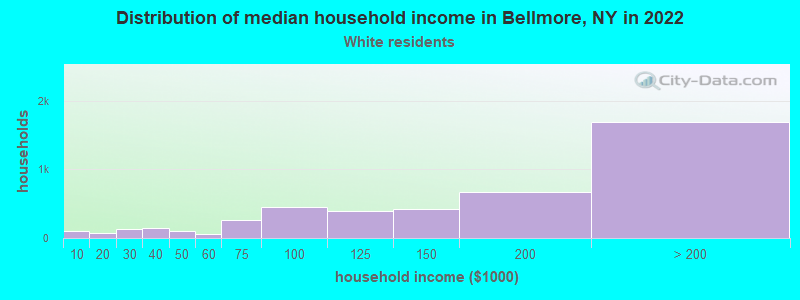
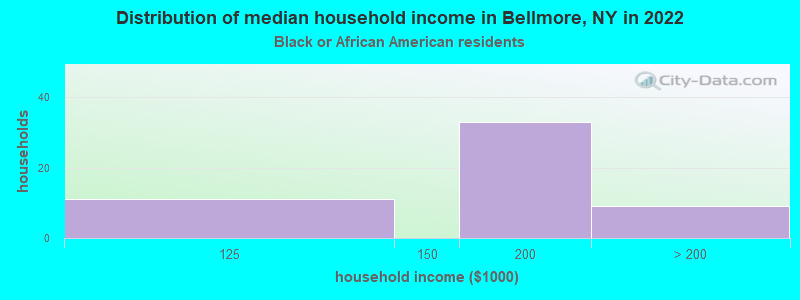
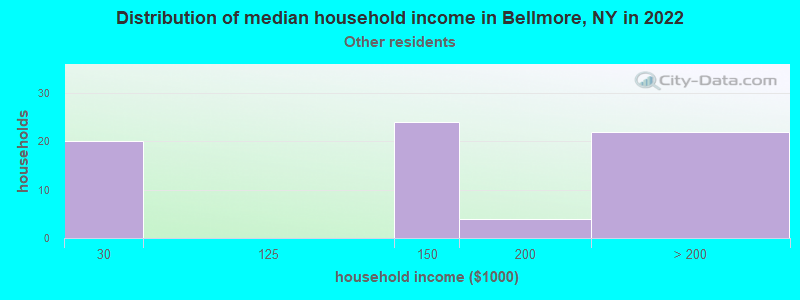
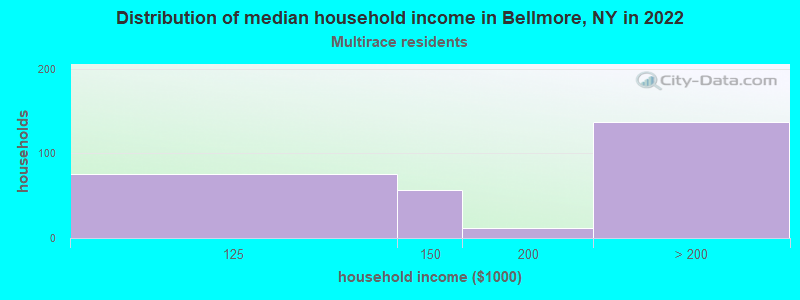
Income and house value in Bellmore Median household income in 2022 $160,357 White non-Hispanic householdersover $200,000 Black householders$159,765 Asian householders$149,460 Some other race householdersover $200,000 Two or more races householders$115,374 Hispanic or Latino race householdersMedian 2022 house value $649,028 White Non-Hispanic householders$498,741 Black or African American householders $606,469 Asian householders$642,910 Some other race householders$709,409 Two or more races householders$621,897 Hispanic or Latino householders
Median age by race in Bellmore
45.0 Median age for White residents47.3 43.9 46.1 Median age for Black or African American residents42.0 47.4 -855,158,729.3 Median age for American Indian / Alaska Native residents-607,543,322.5 -837,121,211.3 37.9 Median age for Asian residents38.7 37.6 -487,992,314.6 Median age for Native Hawaiian / Pacific Islander residents-477,502,295.2 -497,387,669.3 34.7 Median age for Other race residents10.3 39.8 32.5 Median age for Two or more races residents28.3 35.8 44.7 Median age for White alone residents46.7 43.5 35.2 Median age for Hispanic or Latino residents32.2 37.0
Owner/renter occupied households by race in Bellmore
House owners and renters - White residents 4,027 89.8% Owner occupied459 10.2% Renter occupiedHouse owners and renters - Black or African American residents 28 63.7% Owner occupied16 36.3% Renter occupiedHouse owners and renters - Asian residents 170 100.0% Owner occupiedHouse owners and renters - Other race residents 60 100.0% Owner occupiedHouse owners and renters - Two or more races residents 233 80.4% Owner occupied57 19.6% Renter occupiedHouse owners and renters - White alone residents 4,004 89.5% Owner occupied472 10.5% Renter occupiedHouse owners and renters - Hispanic or Latino residents 331 83.7% Owner occupied65 16.3% Renter occupied
Language usage in Bellmore
English speakers - Total 84.0% of residents of Bellmore speak English at home.
3.3% of residents speak Spanish at home 334 67.6% Speak English very well160 32.4% Speak English less than very well12.3% of residents speak other language at home 1,330 72.0% Speak English very well516 28.0% Speak English less than very well
English speakers - Born in the United States 88.2% of residents of Bellmore speak English at home.
7.0% of residents speak Spanish at home 51 91.1% Speak English very well5 8.9% Speak English less than very well5.0% of residents speak other language at home 40 100.0% Speak English very well
English speakers - Native, born elsewhere 45.7% of residents of Bellmore speak English at home.
10.8% of residents speak Spanish at home 24 100.0% Speak English very well44.4% of residents speak other language at home 99 100.0% Speak English very well
English speakers - Foreign-born 18.2% of residents of Bellmore speak English at home.
12.1% of residents speak Spanish at home 78 36.4% Speak English very well136 63.6% Speak English less than very well72.9% of residents speak other language at home 833 64.7% Speak English very well455 35.3% Speak English less than very well
White (Caucasian) - Speak only English Native:
96.3% (11,428)Foreign-born:
25.7% (207)
White (Caucasian) - Speak another language Native:
4.3% (509)Foreign-born:
73.5% (592)
Black or African American - Speak only English Native:
91.9% (140)Foreign-born:
49.5% (11)
Black or African American - Speak another language Native:
7.9% (12)Foreign-born:
50.8% (11)
Asian - Speak only English Native:
24.3% (32)Foreign-born:
0.7% (3)
Asian - Speak another language Native:
74.0% (96)Foreign-born:
100.0% (403)
Other race - Speak another language Native:
9.2% (9)Foreign-born:
100.0% (63)
Two or more races - Speak only English Native:
78.2% (358)Foreign-born:
34.3% (115)
Two or more races - Speak another language Native:
18.7% (86)Foreign-born:
63.2% (213)
White alone - Speak only English Native:
95.9% (11,312)Foreign-born:
22.3% (219)
White alone - Speak another language Native:
4.2% (499)Foreign-born:
77.9% (767)
Hispanic or Latino - Speak only English Native:
73.8% (546)Foreign-born:
16.8% (44)
Hispanic or Latino - Speak another language Native:
25.5% (189)Foreign-born:
83.2% (220)
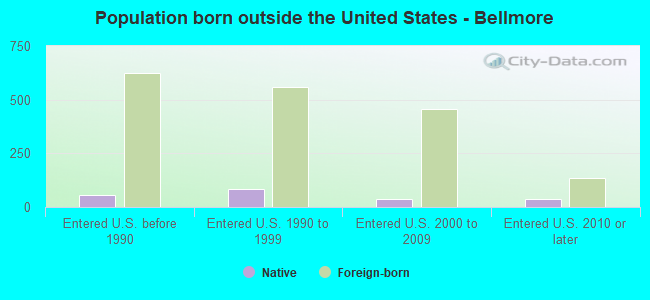
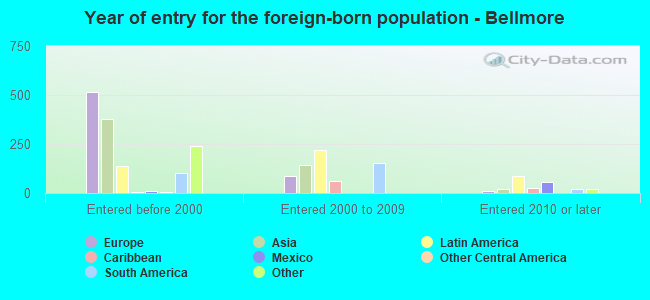
Foreign-born residents in Bellmore 1,734 residents are foreign born (3.9% Europe , 3.1% Asia , 2.8% Latin America , 1.1% Africa ).
This city:
10.9%New York:
22.6%
Marital status for residents in Bellmore Marital status - White (Caucasian) population 15 years and over
Males 29.2% Never married61.8% Now married0.4% Separated3.3% Widowed5.3% DivorcedFemales 29.9% Never married53.0% Now married1.2% Separated7.0% Widowed8.9% DivorcedWomen who gave birth in the past 12 months Now married:
100.0% (63)Unmarried:
0.0% (0)
Women who did not give birth in the past 12 months Now married:
42.0% (1,180)Unmarried:
58.0% (1,630)
Marital status - Black or African American population 15 years and over
Males 47.2% Never married52.8% Now married0.0% Separated0.0% Widowed0.0% DivorcedFemales 4.2% Never married57.7% Now married0.0% Separated16.9% Widowed21.1% DivorcedWomen who did not give birth in the past 12 months Now married:
68.1% (30)Unmarried:
31.9% (14)
Marital status - Asian population 15 years and over
Males 0.0% Never married75.8% Now married0.0% Separated0.0% Widowed24.2% DivorcedFemales 15.4% Never married64.2% Now married3.8% Separated10.4% Widowed6.2% DivorcedWomen who gave birth in the past 12 months Now married:
76.9% (55)Unmarried:
23.1% (17)
Women who did not give birth in the past 12 months Now married:
63.7% (72)Unmarried:
36.3% (41)
Marital status - Other race population 15 years and over
Males 0.0% Never married71.1% Now married0.0% Separated0.0% Widowed28.9% DivorcedFemales 40.0% Never married46.7% Now married0.0% Separated0.0% Widowed13.3% DivorcedWomen who gave birth in the past 12 months Now married:
69.7% (26)Unmarried:
30.3% (11)
Women who did not give birth in the past 12 months Now married:
44.4% (14)Unmarried:
55.6% (17)
Marital status - Two or more races population 15 years and over
Males 38.6% Never married61.4% Now married0.0% Separated0.0% Widowed0.0% DivorcedFemales 39.9% Never married54.6% Now married0.0% Separated0.0% Widowed5.5% DivorcedWomen who gave birth in the past 12 months Now married:
100.0% (11)Unmarried:
0.0% (0)
Women who did not give birth in the past 12 months Now married:
22.1% (50)Unmarried:
77.9% (175)
Marital status - White alone, not Hispanic / Latino population 15 years and over
Males 28.7% Never married62.0% Now married0.4% Separated3.4% Widowed5.5% DivorcedFemales 29.8% Never married53.5% Now married1.2% Separated7.2% Widowed8.3% DivorcedWomen who gave birth in the past 12 months Now married:
100.0% (67)Unmarried:
0.0% (0)
Women who did not give birth in the past 12 months Now married:
42.7% (1,240)Unmarried:
57.3% (1,664)
Marital status - Hispanic or Latino population 15 years and over
Males 46.1% Never married50.9% Now married0.0% Separated0.0% Widowed3.0% DivorcedFemales 34.8% Never married48.1% Now married0.0% Separated0.0% Widowed17.1% DivorcedWomen who gave birth in the past 12 months Now married:
60.0% (15)Unmarried:
40.0% (10)
Women who did not give birth in the past 12 months Now married:
18.9% (43)Unmarried:
81.1% (184)
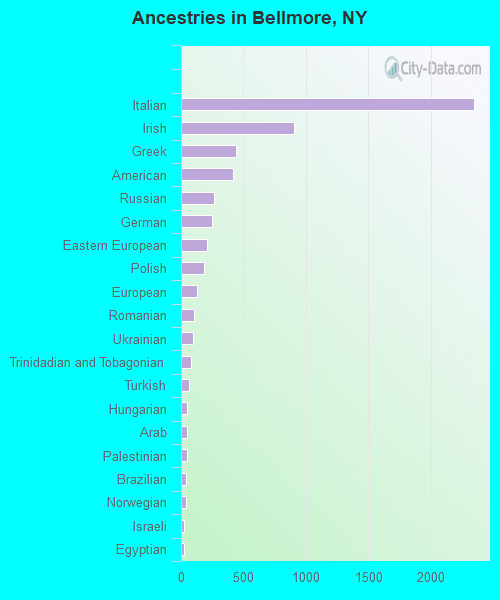
Ancestries in Bellmore
2,351 32.6% Italian908 12.6% Irish437 6.1% Greek419 5.8% American263 3.6% Russian252 3.5% German206 2.9% Eastern European182 2.5% Polish128 1.8% European106 1.5% Romanian98 1.4% Ukrainian80 1.1% Trinidadian and Tobagonian63 0.9% Turkish52 0.7% Hungarian49 0.7% Arab47 0.7% Palestinian43 0.6% Brazilian42 0.6% Norwegian25 0.3% Israeli23 0.3% Egyptian21 0.3% Yugoslavian21 0.3% English19 0.3% Australian18 0.2% Croatian17 0.2% Scotch-Irish15 0.2% French Canadian10 0.1% Albanian9 0.1% Bulgarian9 0.1% Austrian8 0.1% Lebanese8 0.1% Haitian6 0.08% Swiss5 0.07% Latvian
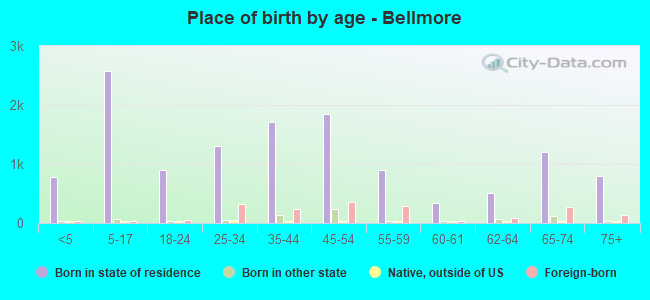
Children Nativity (place of birth) in Bellmore
Children under 6 years - Living with two parents Both parents native 696 100.0% NativeBoth parents foreign-born 32 59.0% Native22 41.0% Foreign-bornOne native, one foreign-born parent 85 100.0% NativeChildren under 6 years - Living with one parent Native parent 26 100.0% NativeForeign-born parent 16 100.0% NativeChildren 6 to 17 years - Living with two parents Both parents native 2,043 99.0% Native20 1.0% Foreign-bornBoth parents foreign-born 42 100.0% NativeOne native, one foreign-born parent 120 100.0% NativeChildren 6 to 17 years - Living with one parent Native parent 289 100.0% NativeForeign-born parent 27 47.2% Native30 52.8% Foreign-born