Races in Bel Air South, Maryland (MD) Detailed Stats
Data:
Races - White alone (%)
Races - White alone (% change since 2000)
Races - Black alone (%)
Races - Black alone (% change since 2000)
Races - American Indian alone (%)
Races - American Indian alone (% change since 2000)
Races - Asian alone (%)
Races - Asian alone (% change since 2000)
Races - Hispanic (%)
Races - Hispanic (% change since 2000)
Races - Native Hawaiian and Other Pacific Islander alone (%)
Races - Native Hawaiian and Other Pacific Islander alone (% change since 2000)
Races - Two or more races(%)
Races - Two or more races(% change since 2000)
Races - Other race alone (%)
Races - Other race alone (% change since 2000)
Racial diversity
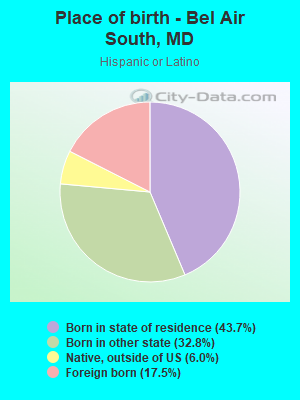
Place of birth - Born in state of residence (%)
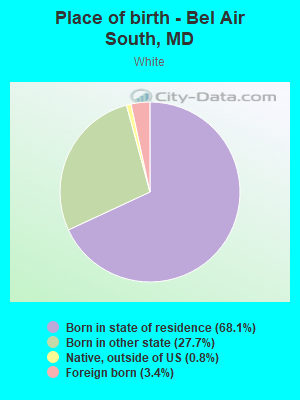
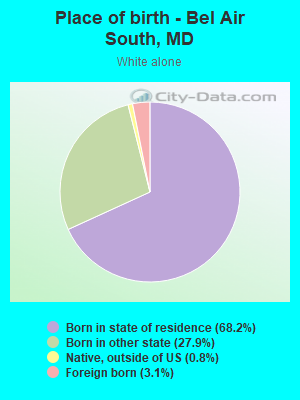
Place of birth - Born in state of residence (%) - White
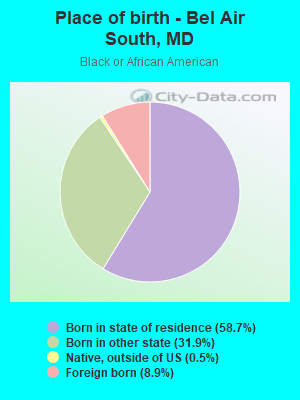
Place of birth - Born in state of residence (%) - Black or African American
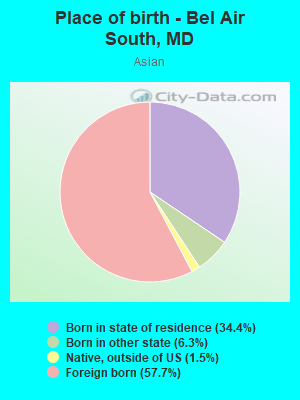
Place of birth - Born in state of residence (%) - Asian
Place of birth - Born in state of residence (%) - Hispanic or Latino
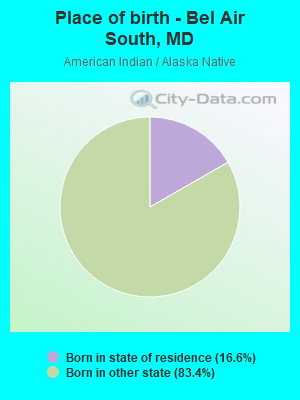
Place of birth - Born in state of residence (%) - American Indian and Alaska Native
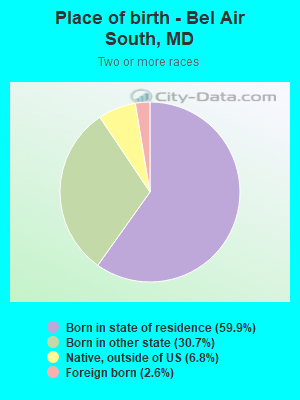
Place of birth - Born in state of residence (%) - Multirace
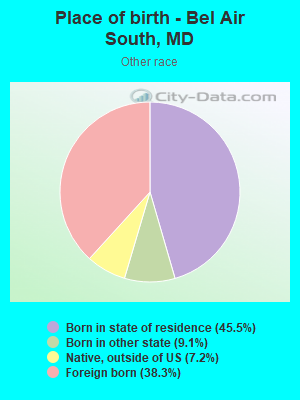
Place of birth - Born in state of residence (%) - Other Race
Place of birth - Born in other state (%)
Place of birth - Born in other state (%) - White
Place of birth - Born in other state (%) - Black or African American
Place of birth - Born in other state (%) - Asian
Place of birth - Born in other state (%) - Hispanic or Latino
Place of birth - Born in other state (%) - American Indian and Alaska Native
Place of birth - Born in other state (%) - Multirace
Place of birth - Born in other state (%) - Other Race
Place of birth - Native, outside of US (%)
Place of birth - Native, outside of US (%) - White
Place of birth - Native, outside of US (%) - Black or African American
Place of birth - Native, outside of US (%) - Asian
Place of birth - Native, outside of US (%) - Hispanic or Latino
Place of birth - Native, outside of US (%) - American Indian and Alaska Native
Place of birth - Native, outside of US (%) - Multirace
Place of birth - Native, outside of US (%) - Other Race
Place of birth - Foreign born (%)
Place of birth - Foreign born (%) - White
Place of birth - Foreign born (%) - Black or African American
Place of birth - Foreign born (%) - Asian
Place of birth - Foreign born (%) - Hispanic or Latino
Place of birth - Foreign born (%) - American Indian and Alaska Native
Place of birth - Foreign born (%) - Multirace
Place of birth - Foreign born (%) - Other Race
Residents speaking English at home (%)
Residents speaking English at home - Born in the United States (%)
Residents speaking English at home - Native, born elsewhere (%)
Residents speaking English at home - Foreign born (%)
Residents speaking Spanish at home (%)
Residents speaking Spanish at home - Born in the United States (%)
Residents speaking Spanish at home - Native, born elsewhere (%)
Residents speaking Spanish at home - Foreign born (%)
Residents speaking other language at home (%)
Residents speaking other language at home - Born in the United States (%)
Residents speaking other language at home - Native, born elsewhere (%)
Residents speaking other language at home - Foreign born (%)
Marital status - Never married (%)
Marital status - Now married (%)
Marital status - Separated (%)
Marital status - Widowed (%)
Marital status - Divorced (%)
Ancestries Reported - Arab (%)
Ancestries Reported - Czech (%)
Ancestries Reported - Danish (%)
Ancestries Reported - Dutch (%)
Ancestries Reported - English (%)
Ancestries Reported - French (%)
Ancestries Reported - French Canadian (%)
Ancestries Reported - German (%)
Ancestries Reported - Greek (%)
Ancestries Reported - Hungarian (%)
Ancestries Reported - Irish (%)
Ancestries Reported - Italian (%)
Ancestries Reported - Lithuanian (%)
Ancestries Reported - Norwegian (%)
Ancestries Reported - Polish (%)
Ancestries Reported - Portuguese (%)
Ancestries Reported - Russian (%)
Ancestries Reported - Scotch-Irish (%)
Ancestries Reported - Scottish (%)
Ancestries Reported - Slovak (%)
Ancestries Reported - Subsaharan African (%)
Ancestries Reported - Swedish (%)
Ancestries Reported - Swiss (%)
Ancestries Reported - Ukrainian (%)
Ancestries Reported - United States (%)
Ancestries Reported - Welsh (%)
Ancestries Reported - West Indian (%)
Ancestries Reported - Other (%)
Geographical mobility - Same house 1 year ago (%)
Geographical mobility - Same house 1 year ago (%) - White
Geographical mobility - Same house 1 year ago (%) - Black or African American
Geographical mobility - Same house 1 year ago (%) - Asian
Geographical mobility - Same house 1 year ago (%) - Hispanic or Latino
Geographical mobility - Same house 1 year ago (%) - American Indian and Alaska Native
Geographical mobility - Same house 1 year ago (%) - Multirace
Geographical mobility - Same house 1 year ago (%) - Other Race
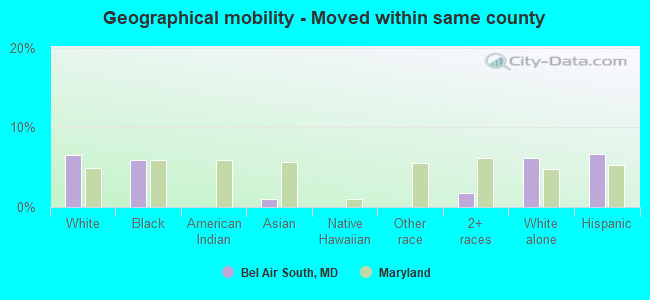
Geographical mobility - Moved within same county (%)
Geographical mobility - Moved within same county (%) - White
Geographical mobility - Moved within same county (%) - Black or African American
Geographical mobility - Moved within same county (%) - Asian
Geographical mobility - Moved within same county (%) - Hispanic or Latino
Geographical mobility - Moved within same county (%) - American Indian and Alaska Native
Geographical mobility - Moved within same county (%) - Multirace
Geographical mobility - Moved within same county (%) - Other Race
Geographical mobility - Moved from different county within same state (%)
Geographical mobility - Moved from different county within same state (%) - White
Geographical mobility - Moved from different county within same state (%) - Black or African American
Geographical mobility - Moved from different county within same state (%) - Asian
Geographical mobility - Moved from different county within same state (%) - Hispanic or Latino
Geographical mobility - Moved from different county within same state (%) - American Indian and Alaska Native
Geographical mobility - Moved from different county within same state (%) - Multirace
Geographical mobility - Moved from different county within same state (%) - Other Race
Geographical mobility - Moved from different state (%)
Geographical mobility - Moved from different state (%) - White
Geographical mobility - Moved from different state (%) - Black or African American
Geographical mobility - Moved from different state (%) - Asian
Geographical mobility - Moved from different state (%) - Hispanic or Latino
Geographical mobility - Moved from different state (%) - American Indian and Alaska Native
Geographical mobility - Moved from different state (%) - Multirace
Geographical mobility - Moved from different state (%) - Other Race
Geographical mobility - Moved from abroad (%)
Geographical mobility - Moved from abroad (%) - White
Geographical mobility - Moved from abroad (%) - Black or African American
Geographical mobility - Moved from abroad (%) - Asian
Geographical mobility - Moved from abroad (%) - Hispanic or Latino
Geographical mobility - Moved from abroad (%) - American Indian and Alaska Native
Geographical mobility - Moved from abroad (%) - Multirace
Geographical mobility - Moved from abroad (%) - Other Race
Place of birth for the foreign-born population - Ireland (%)
Place of birth for the foreign-born population - Denmark (%)
Place of birth for the foreign-born population - Norway (%)
Place of birth for the foreign-born population - Sweden (%)
Place of birth for the foreign-born population - United Kingdom (%)
Place of birth for the foreign-born population - England (%)
Place of birth for the foreign-born population - Scotland (%)
Place of birth for the foreign-born population - Other Northern Europe (%)
Place of birth for the foreign-born population - Austria (%)
Place of birth for the foreign-born population - Belgium (%)
Place of birth for the foreign-born population - France (%)
Place of birth for the foreign-born population - Germany (%)
Place of birth for the foreign-born population - Netherlands (%)
Place of birth for the foreign-born population - Switzerland (%)
Place of birth for the foreign-born population - Other Western Europe (%)
Place of birth for the foreign-born population - Greece (%)
Place of birth for the foreign-born population - Italy (%)
Place of birth for the foreign-born population - Portugal (%)
Place of birth for the foreign-born population - Spain (%)
Place of birth for the foreign-born population - Other Southern Europe (%)
Place of birth for the foreign-born population - Albania (%)
Place of birth for the foreign-born population - Belarus (%)
Place of birth for the foreign-born population - Bosnia and Herzegovina (%)
Place of birth for the foreign-born population - Bulgaria (%)
Place of birth for the foreign-born population - Croatia (%)
Place of birth for the foreign-born population - Czechoslovakia (%)
Place of birth for the foreign-born population - Hungary (%)
Place of birth for the foreign-born population - Latvia (%)
Place of birth for the foreign-born population - Lithuania (%)
Place of birth for the foreign-born population - North Macedonia (Macedonia) (%)
Place of birth for the foreign-born population - Moldova (%)
Place of birth for the foreign-born population - Poland (%)
Place of birth for the foreign-born population - Romania (%)
Place of birth for the foreign-born population - Russia (%)
Place of birth for the foreign-born population - Serbia (%)
Place of birth for the foreign-born population - Ukraine (%)
Place of birth for the foreign-born population - Other Eastern Europe (%)
Place of birth for the foreign-born population - China (%)
Place of birth for the foreign-born population - Hong Kong (%)
Place of birth for the foreign-born population - Taiwan (%)
Place of birth for the foreign-born population - Japan (%)
Place of birth for the foreign-born population - Korea (%)
Place of birth for the foreign-born population - Other Eastern Asia (%)
Place of birth for the foreign-born population - Afghanistan (%)
Place of birth for the foreign-born population - Bangladesh (%)
Place of birth for the foreign-born population - India (%)
Place of birth for the foreign-born population - Iran (%)
Place of birth for the foreign-born population - Kazakhstan (%)
Place of birth for the foreign-born population - Nepal (%)
Place of birth for the foreign-born population - Pakistan (%)
Place of birth for the foreign-born population - Sri Lanka (%)
Place of birth for the foreign-born population - Uzbekistan (%)
Place of birth for the foreign-born population - Other South Central Asia (%)
Place of birth for the foreign-born population - Burma (%)
Place of birth for the foreign-born population - Cambodia (%)
Place of birth for the foreign-born population - Indonesia (%)
Place of birth for the foreign-born population - Laos (%)
Place of birth for the foreign-born population - Malaysia (%)
Place of birth for the foreign-born population - Philippines (%)
Place of birth for the foreign-born population - Singapore (%)
Place of birth for the foreign-born population - Thailand (%)
Place of birth for the foreign-born population - Vietnam (%)
Place of birth for the foreign-born population - Other South Eastern Asia (%)
Place of birth for the foreign-born population - Armenia (%)
Place of birth for the foreign-born population - Iraq (%)
Place of birth for the foreign-born population - Israel (%)
Place of birth for the foreign-born population - Jordan (%)
Place of birth for the foreign-born population - Kuwait (%)
Place of birth for the foreign-born population - Lebanon (%)
Place of birth for the foreign-born population - Saudi Arabia (%)
Place of birth for the foreign-born population - Syria (%)
Place of birth for the foreign-born population - Turkey (%)
Place of birth for the foreign-born population - Yemen (%)
Place of birth for the foreign-born population - Other Western Asia (%)
Place of birth for the foreign-born population - Eritrea (%)
Place of birth for the foreign-born population - Ethiopia (%)
Place of birth for the foreign-born population - Kenya (%)
Place of birth for the foreign-born population - Somalia (%)
Place of birth for the foreign-born population - Uganda (%)
Place of birth for the foreign-born population - Zimbabwe (%)
Place of birth for the foreign-born population - Other Eastern Africa (%)
Place of birth for the foreign-born population - Cameroon (%)
Place of birth for the foreign-born population - Congo (%)
Place of birth for the foreign-born population - Democratic Republic of Congo (Zaire) (%)
Place of birth for the foreign-born population - Other Middle Africa (%)
Place of birth for the foreign-born population - Egypt (%)
Place of birth for the foreign-born population - Morocco (%)
Place of birth for the foreign-born population - Sudan (%)
Place of birth for the foreign-born population - Other Northern Africa (%)
Place of birth for the foreign-born population - South Africa (%)
Place of birth for the foreign-born population - Other Southern Africa (%)
Place of birth for the foreign-born population - Cabo Verde (%)
Place of birth for the foreign-born population - Ghana (%)
Place of birth for the foreign-born population - Liberia (%)
Place of birth for the foreign-born population - Nigeria (%)
Place of birth for the foreign-born population - Senegal (%)
Place of birth for the foreign-born population - Sierra Leone (%)
Place of birth for the foreign-born population - Other Western Africa (%)
Place of birth for the foreign-born population - Australia (%)
Place of birth for the foreign-born population - New Zealand (%)
Place of birth for the foreign-born population - Fiji (%)
Place of birth for the foreign-born population - Micronesia (%)
Place of birth for the foreign-born population - Bahamas (%)
Place of birth for the foreign-born population - Barbados (%)
Place of birth for the foreign-born population - Cuba (%)
Place of birth for the foreign-born population - Dominica (%)
Place of birth for the foreign-born population - Dominican Republic (%)
Place of birth for the foreign-born population - Grenada (%)
Place of birth for the foreign-born population - Haiti (%)
Place of birth for the foreign-born population - Jamaica (%)
Place of birth for the foreign-born population - St. Vincent and the Grenadines (%)
Place of birth for the foreign-born population - Trinidad and Tobago (%)
Place of birth for the foreign-born population - West Indies (%)
Place of birth for the foreign-born population - Other Caribbean (%)
Place of birth for the foreign-born population - Belize (%)
Place of birth for the foreign-born population - Costa Rica (%)
Place of birth for the foreign-born population - El Salvador (%)
Place of birth for the foreign-born population - Guatemala (%)
Place of birth for the foreign-born population - Honduras (%)
Place of birth for the foreign-born population - Mexico (%)
Place of birth for the foreign-born population - Nicaragua (%)
Place of birth for the foreign-born population - Panama (%)
Place of birth for the foreign-born population - Other Central America (%)
Place of birth for the foreign-born population - Argentina (%)
Place of birth for the foreign-born population - Bolivia (%)
Place of birth for the foreign-born population - Brazil (%)
Place of birth for the foreign-born population - Chile (%)
Place of birth for the foreign-born population - Colombia (%)
Place of birth for the foreign-born population - Ecuador (%)
Place of birth for the foreign-born population - Guyana (%)
Place of birth for the foreign-born population - Peru (%)
Place of birth for the foreign-born population - Uruguay (%)
Place of birth for the foreign-born population - Venezuela (%)
Place of birth for the foreign-born population - Other South America (%)
Place of birth for the foreign-born population - Canada (%)
Place of birth for the foreign-born population - Other Northern America (%)
Place of birth for the foreign-born population - Other (%)
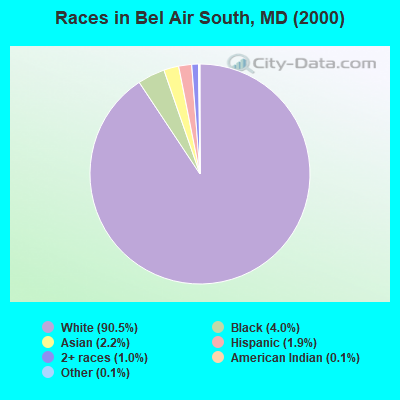
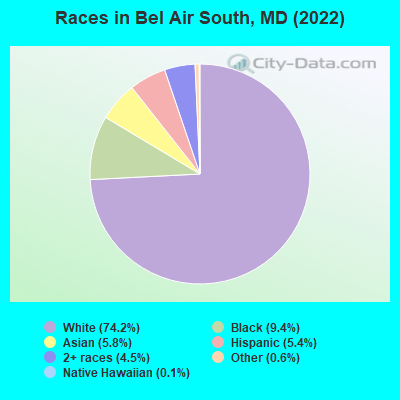
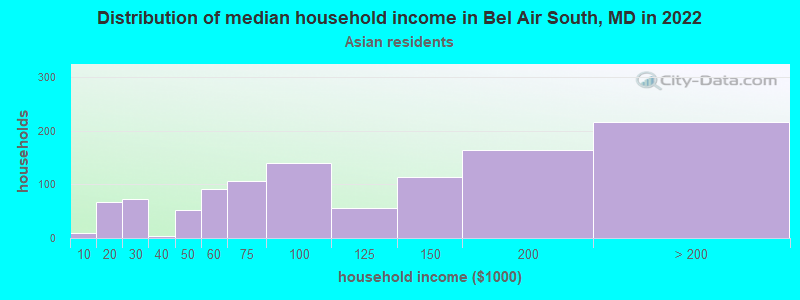
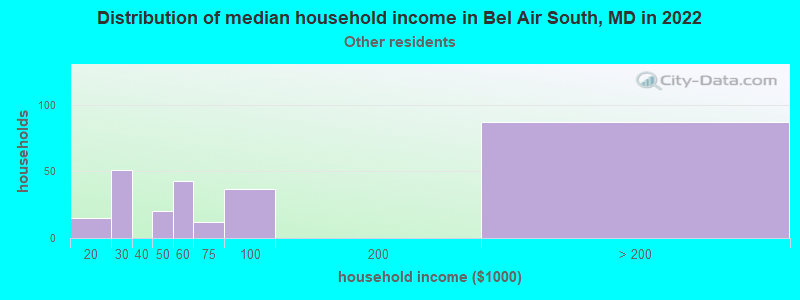
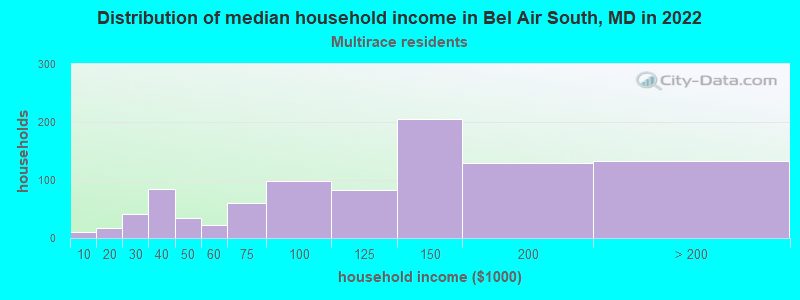
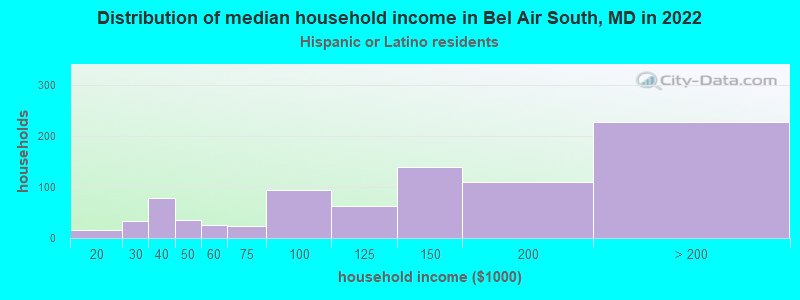
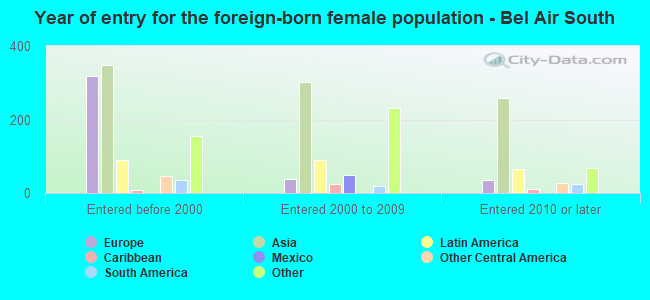
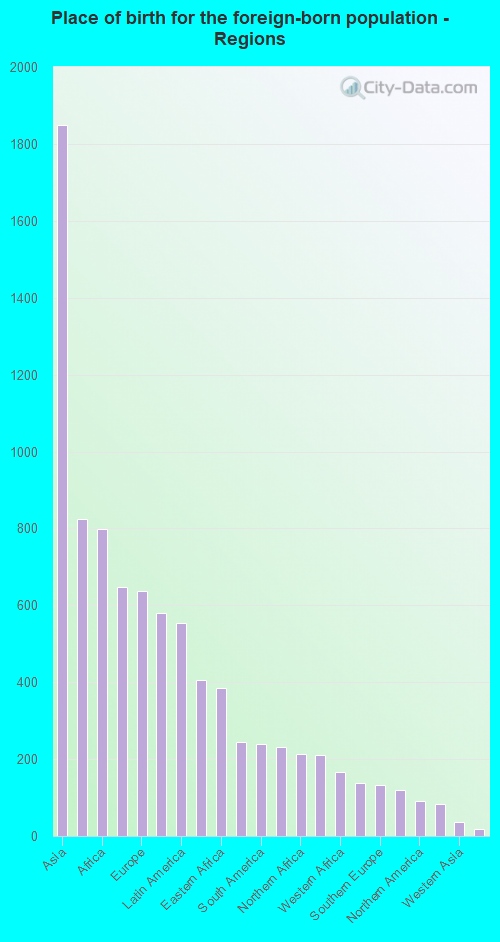
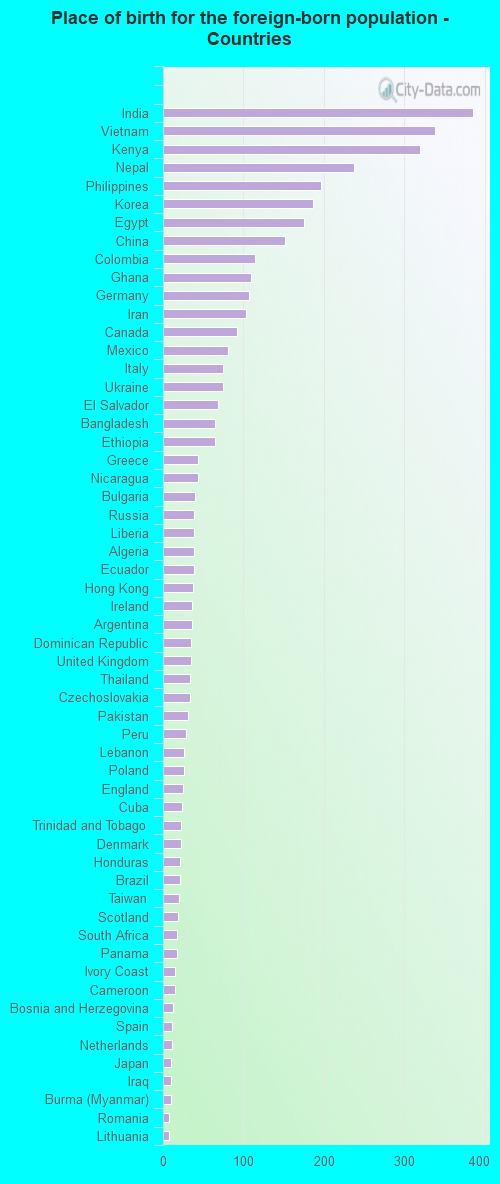
According to 2022 data, the most numerous races in Bel Air South, MD are White alone (42,825 residents), Black alone (5,417 residents), and Hispanic (3,119 residents). 89.7% of Bel Air South residents speak English at home. 6.8% of Bel Air South, MD residents are foreign-born (3.0% born in Asia, 1.3% born in Africa, 1.0% born in Europe, 0.9% born in Latin America), which is 134.9% less than the foreign-born rate of 16.0% across the entire state of Maryland.
Race distribution in Bel Air South
2000 2022
3,286,547 62.1% White alone 1,464,735 27.7% Black alone 227,916 4.3% Hispanic 209,738 4.0% Asian alone 82,946 1.6% Two or more races 13,312 0.3% American Indian alone 9,379 0.2% Other race alone 1,913 0.04% Native Hawaiian and Other
2,906,492 47.1% White alone 1,800,914 29.2% Black alone 705,842 11.4% Hispanic 401,818 6.5% Asian alone 291,317 4.7% Two or more races 46,930 0.8% Other race alone 8,930 0.1% American Indian alone 2,417 0.04% Native Hawaiian and Other
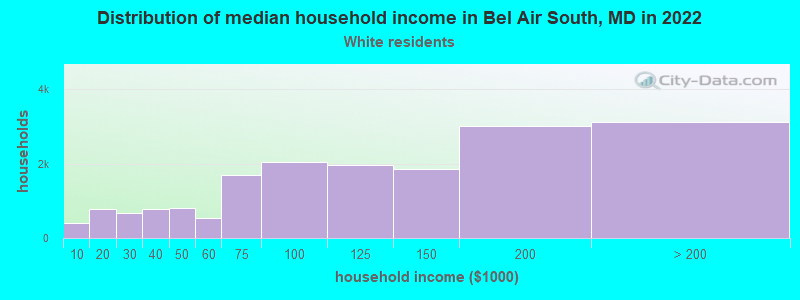
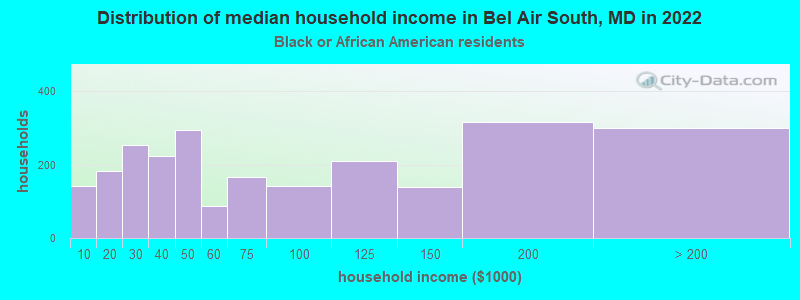
Income and house value in Bel Air South Median household income in 2022 $114,588 White non-Hispanic householders$77,962 Black householders$92,561 Asian householders$107,104 Two or more races householders$86,514 Hispanic or Latino race householdersMedian 2022 house value $379,874 White Non-Hispanic householders$369,199 Black or African American householders$495,477 American Indian or Alaska Native householders $342,642 Asian householders$423,095 Some other race householders$322,854 Two or more races householders$378,832 Hispanic or Latino householders
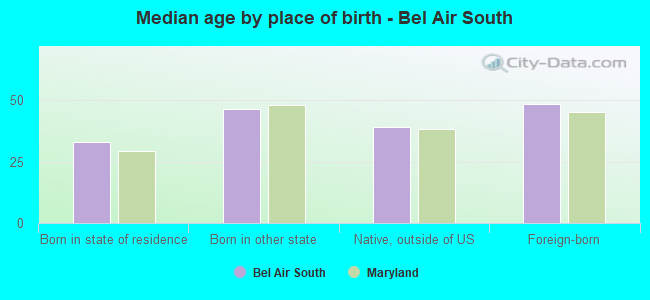
Median age by race in Bel Air South
39.7 Median age for White residents37.8 41.7 37.0 Median age for Black or African American residents31.0 46.8 59.4 Median age for American Indian / Alaska Native residents-642,487,046.0 -676,818,950.3 39.8 Median age for Asian residents46.1 35.0 -763,333,332.6 Median age for Native Hawaiian / Pacific Islander residents-666,666,666.0 -760,942,760.2 38.2 Median age for Other race residents34.1 38.7 23.9 Median age for Two or more races residents26.0 20.7 40.2 Median age for White alone residents38.3 42.2 25.4 Median age for Hispanic or Latino residents26.2 24.7
Owner/renter occupied households by race in Bel Air South
House owners and renters - White residents 14,998 84.4% Owner occupied2,766 15.6% Renter occupiedHouse owners and renters - Black or African American residents 1,565 69.9% Owner occupied675 30.1% Renter occupiedHouse owners and renters - American Indian / Alaska Native residents 14 100.0% Owner occupiedHouse owners and renters - Asian residents 1,027 80.9% Owner occupied242 19.1% Renter occupiedHouse owners and renters - Native Hawaiian / Pacific Islander residents 70 100.0% Owner occupiedHouse owners and renters - Other race residents 166 74.1% Owner occupied58 25.9% Renter occupiedHouse owners and renters - Two or more races residents 908 82.6% Owner occupied191 17.4% Renter occupiedHouse owners and renters - White alone residents 14,902 85.0% Owner occupied2,620 15.0% Renter occupiedHouse owners and renters - Hispanic or Latino residents 641 74.3% Owner occupied222 25.7% Renter occupied
Language usage in Bel Air South
English speakers - Total 89.7% of residents of Bel Air South speak English at home.
3.1% of residents speak Spanish at home 1,243 74.3% Speak English very well431 25.7% Speak English less than very well7.5% of residents speak other language at home 2,287 56.0% Speak English very well1,799 44.0% Speak English less than very well
English speakers - Born in the United States 94.8% of residents of Bel Air South speak English at home.
3.2% of residents speak Spanish at home 343 71.2% Speak English very well139 28.8% Speak English less than very well2.3% of residents speak other language at home 346 100.0% Speak English very well
English speakers - Native, born elsewhere 63.0% of residents of Bel Air South speak English at home.
40.5% of residents speak Spanish at home 190 65.7% Speak English very well99 34.3% Speak English less than very well8.5% of residents speak other language at home 61 100.0% Speak English very well
English speakers - Foreign-born 27.0% of residents of Bel Air South speak English at home.
12.5% of residents speak Spanish at home 401 72.9% Speak English very well149 27.1% Speak English less than very well60.6% of residents speak other language at home 1,085 40.6% Speak English very well1,587 59.4% Speak English less than very well
White (Caucasian) - Speak only English Native:
97.3% (38,762)Foreign-born:
34.2% (508)
White (Caucasian) - Speak another language Native:
2.7% (1,073)Foreign-born:
63.1% (936)
Black or African American - Speak only English Native:
97.4% (4,856)Foreign-born:
29.7% (143)
Black or African American - Speak another language Native:
2.1% (107)Foreign-born:
69.6% (335)
Asian - Speak only English Native:
44.3% (570)Foreign-born:
29.1% (570)
Asian - Speak another language Native:
54.7% (704)Foreign-born:
70.0% (1,371)
Other race - Speak only English Native:
59.4% (294)Foreign-born:
23.2% (79)
Other race - Speak another language Native:
40.6% (200)Foreign-born:
77.9% (264)
Two or more races - Speak only English Native:
87.8% (2,960)Foreign-born:
38.0% (39)
Two or more races - Speak another language Native:
12.1% (408)Foreign-born:
64.2% (66)
White alone - Speak only English Native:
97.5% (38,153)Foreign-born:
39.3% (525)
White alone - Speak another language Native:
2.5% (972)Foreign-born:
58.0% (774)
Hispanic or Latino - Speak only English Native:
68.3% (1,619)Foreign-born:
7.2% (39)
Hispanic or Latino - Speak another language Native:
31.8% (754)Foreign-born:
94.7% (514)
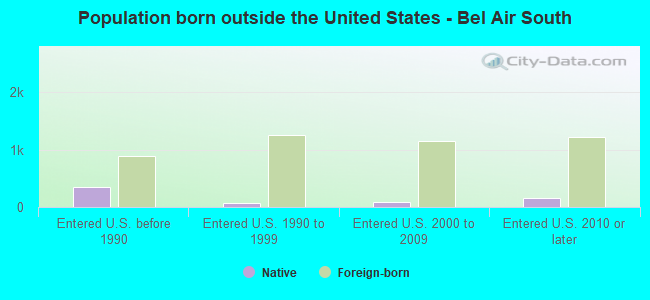
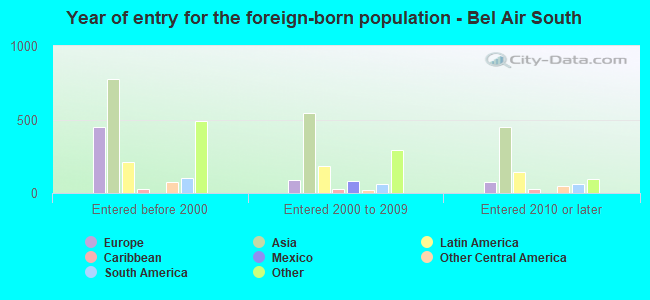
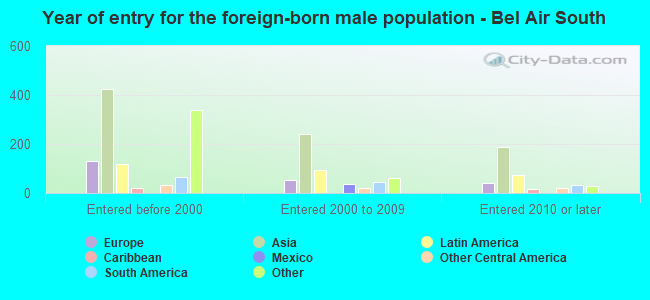
Foreign-born residents in Bel Air South 3,932 residents are foreign born (3.0% Asia , 1.3% Africa , 1.0% Europe , 0.9% Latin America ).
This city:
6.8%Maryland:
15.7%
Marital status for residents in Bel Air South Marital status - White (Caucasian) population 15 years and over
Males 30.8% Never married59.1% Now married0.4% Separated1.8% Widowed7.9% DivorcedFemales 23.5% Never married54.9% Now married0.9% Separated9.2% Widowed11.5% DivorcedWomen who gave birth in the past 12 months Now married:
65.2% (476)Unmarried:
34.8% (254)
Women who did not give birth in the past 12 months Now married:
51.7% (4,703)Unmarried:
48.3% (4,391)
Marital status - Black or African American population 15 years and over
Males 44.0% Never married46.2% Now married0.6% Separated0.0% Widowed9.1% DivorcedFemales 39.3% Never married40.6% Now married0.3% Separated9.5% Widowed10.4% DivorcedWomen who gave birth in the past 12 months Now married:
25.8% (8)Unmarried:
74.2% (23)
Women who did not give birth in the past 12 months Now married:
35.2% (486)Unmarried:
64.8% (896)
Marital status - Asian population 15 years and over
Males 21.5% Never married74.0% Now married1.8% Separated0.1% Widowed2.8% DivorcedFemales 21.6% Never married69.0% Now married1.5% Separated5.7% Widowed2.3% DivorcedWomen who gave birth in the past 12 months Now married:
100.0% (17)Unmarried:
0.0% (0)
Women who did not give birth in the past 12 months Now married:
70.0% (591)Unmarried:
30.0% (254)
Marital status - Other race population 15 years and over
Males 61.6% Never married38.4% Now married0.0% Separated0.0% Widowed0.0% DivorcedFemales 32.4% Never married54.4% Now married2.2% Separated0.0% Widowed11.0% DivorcedWomen who did not give birth in the past 12 months Now married:
42.0% (148)Unmarried:
58.0% (204)
Marital status - Two or more races population 15 years and over
Males 33.5% Never married62.1% Now married0.0% Separated2.4% Widowed2.0% DivorcedFemales 41.8% Never married42.3% Now married0.0% Separated7.4% Widowed8.5% DivorcedWomen who gave birth in the past 12 months Now married:
100.0% (14)Unmarried:
0.0% (0)
Women who did not give birth in the past 12 months Now married:
36.2% (275)Unmarried:
63.8% (485)
Marital status - White alone, not Hispanic / Latino population 15 years and over
Males 30.4% Never married59.5% Now married0.4% Separated1.8% Widowed7.9% DivorcedFemales 22.6% Never married55.5% Now married0.9% Separated9.4% Widowed11.5% DivorcedWomen who gave birth in the past 12 months Now married:
65.2% (483)Unmarried:
34.8% (258)
Women who did not give birth in the past 12 months Now married:
52.8% (4,595)Unmarried:
47.2% (4,109)
Marital status - Hispanic or Latino population 15 years and over
Males 37.5% Never married56.3% Now married0.0% Separated1.7% Widowed4.5% DivorcedFemales 42.3% Never married41.0% Now married0.8% Separated5.2% Widowed10.7% DivorcedWomen who did not give birth in the past 12 months Now married:
37.2% (365)Unmarried:
62.8% (615)
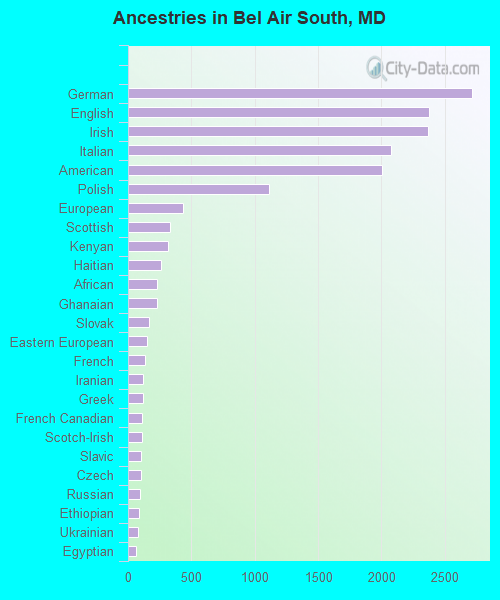
Ancestries in Bel Air South
2,714 10.2% German2,377 9.0% English2,367 8.9% Irish2,079 7.8% Italian2,002 7.5% American1,113 4.2% Polish435 1.6% European329 1.2% Scottish316 1.2% Kenyan262 1.0% Haitian232 0.9% African226 0.9% Ghanaian166 0.6% Slovak147 0.6% Eastern European137 0.5% French122 0.5% Iranian120 0.5% Greek113 0.4% French Canadian107 0.4% Scotch-Irish104 0.4% Slavic99 0.4% Czech93 0.4% Russian85 0.3% Ethiopian75 0.3% Ukrainian67 0.3% Egyptian61 0.2% British54 0.2% Swedish53 0.2% Bulgarian53 0.2% Welsh49 0.2% Dutch48 0.2% Finnish45 0.2% Danish43 0.2% Brazilian42 0.2% Portuguese42 0.2% Nigerian38 0.1% Canadian32 0.1% Norwegian30 0.1% Scandinavian30 0.1% Northern European28 0.1% Hungarian21 0.08% Czechoslovakian19 0.07% South African18 0.07% Latvian18 0.07% Lithuanian16 0.06% Yugoslavian13 0.05% Trinidadian and Tobagonian12 0.05% Lebanese12 0.05% Pennsylvania German11 0.04% Romanian8 0.03% Croatian
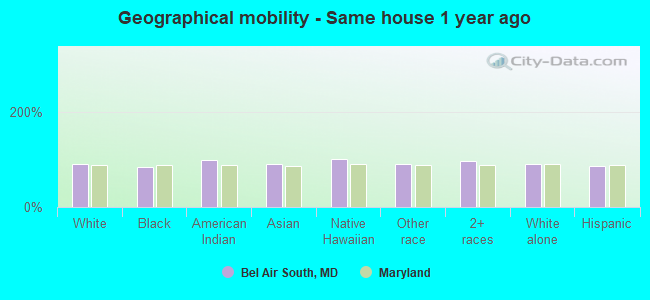
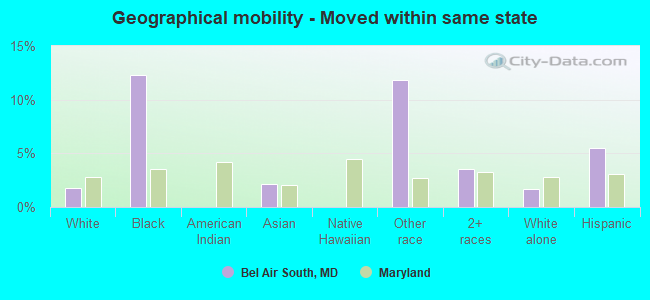
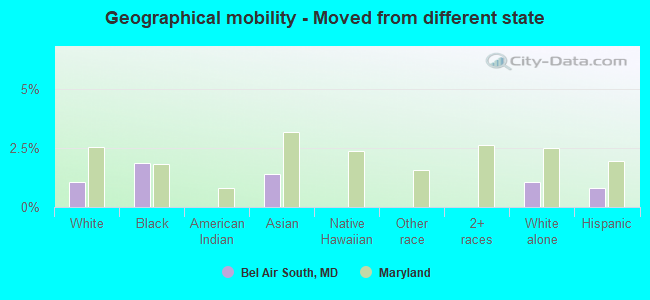
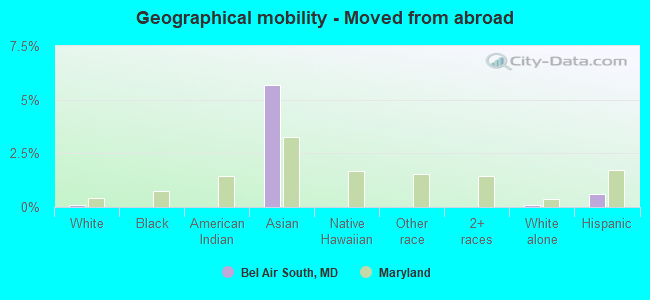
Geographical mobility in Bel Air South Same house 1 year ago 39,265 90.6% White (Caucasian)4,594 82.7% Black or African American39 98.9% American Indian / Alaska Native2,802 90.9% Asian72 100.0% Native Hawaiian / Pacific Islander777 90.9% Other race3,636 96.0% Two or more races38,594 91.1% White alone, not Hispanic / Latino2,581 86.1% Hispanic or LatinoMoved within same county 2,842 6.6% White / Caucasian329 5.9% Black or African American30 1.0% Asian66 1.7% Two or more races2,584 6.1% White alone, not Hispanic / Latino198 6.6% Hispanic or LatinoMoved within same state 762 1.8% White / Caucasian681 12.3% Black or African American66 2.2% Asian101 11.8% Other race135 3.6% Two or more races722 1.7% White alone, not Hispanic / Latino164 5.5% Hispanic or LatinoMoved from different state 457 1.1% White / Caucasian104 1.9% Black or African American43 1.4% Asian448 1.1% White alone, not Hispanic / Latino25 0.8% Hispanic or LatinoMoved from abroad 47 0.1% White175 5.7% Asian41 0.1% White alone, not Hispanic / Latino18 0.6% Hispanic or Latino
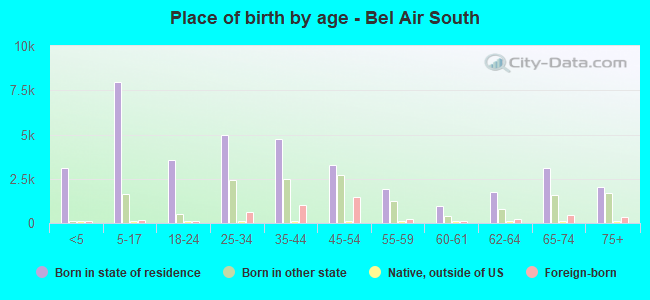
Children Nativity (place of birth) in Bel Air South
Children under 6 years - Living with two parents Both parents native 2,883 100.0% NativeBoth parents foreign-born 169 100.0% NativeOne native, one foreign-born parent 211 100.0% NativeChildren under 6 years - Living with one parent Native parent 684 100.0% NativeForeign-born parent 44 100.0% NativeChildren 6 to 17 years - Living with two parents Both parents native 5,025 100.0% NativeBoth parents foreign-born 1,161 88.6% Native149 11.4% Foreign-bornOne native, one foreign-born parent 133 100.0% NativeChildren 6 to 17 years - Living with one parent Native parent 1,748 100.0% NativeForeign-born parent 241 31.1% Native535 68.9% Foreign-born
Grandparents responsible for own grandchildren in Bel Air South
Grandparents (30 to 59 years) White / Caucasian 415 69.2% Responsible for grandchildren185 30.8% Not responsible for grandchildrenBlack or African American 60 91.5% Responsible for grandchildren6 8.5% Not responsible for grandchildrenAsian 6 100.0% Not responsible for grandchildrenOther race 13 52.4% Responsible for grandchildren12 47.6% Not responsible for grandchildrenWhite alone, not Hispanic / Latino 415 70.3% Responsible for grandchildren175 29.7% Not responsible for grandchildrenHispanic or Latino 13 38.0% Responsible for grandchildren21 62.0% Not responsible for grandchildrenGrandparents (60 years and over) White / Caucasian 138 31.8% Responsible for grandchildren297 68.2% Not responsible for grandchildrenAsian 89 49.8% Responsible for grandchildren90 50.2% Not responsible for grandchildrenWhite alone, not Hispanic / Latino 138 32.0% Responsible for grandchildren294 68.0% Not responsible for grandchildrenHispanic or Latino 6 100.0% Not responsible for grandchildren