Races in Bedford, Indiana (IN) Detailed Stats
Ancestries, Foreign-born residents, place of birth
Settings
X


Recent posts about races in Bedford, Indiana on our local forum with over 2,400,000 registered users:
 | Best Small Towns (20 replies) |
| Salem Indiana (31 replies) |
| Cougars, Wolves, Bears, Bobcats in Indiana (55 replies) |
| jackson county vs. washington county (15 replies) |
| Moving from Fl to Northwest Indiana (61 replies) |
| Possible move back to Columbus Area (3 replies) |
Latest news about races in Bedford, IN collected exclusively by city-data.com from local newspapers, TV, and radio stations
According to 2022 data, the most numerous races in Bedford, IN are White alone (12,714 residents), Black alone (71 residents), and Hispanic (509 residents). 97.3% of Bedford residents speak English at home. 1.8% of Bedford, IN residents are foreign-born , which is 225.8% less than the foreign-born rate of 6.0% across the entire state of Indiana.
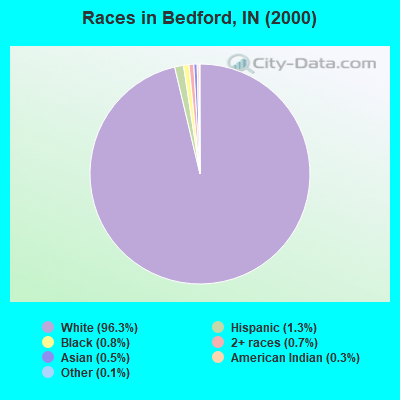
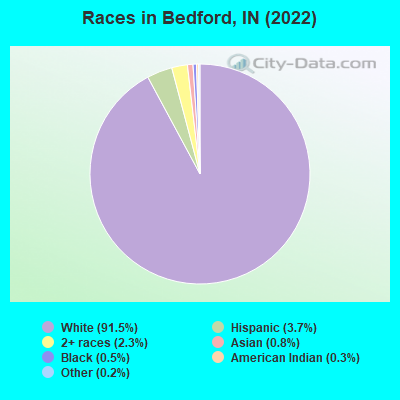
Race distribution in Bedford
2000
2022

- 13,26196.3%White alone
- 1731.3%Hispanic
- 1090.8%Black alone
- 1030.7%Two or more races
- 660.5%Asian alone
- 360.3%American Indian alone
- 190.1%Other race alone
- 10.01%Native Hawaiian and Other
Pacific Islander alone
-
- 12,71491.5%White alone
- 5093.7%Hispanic
- 3212.3%Two or more races
- 1140.8%Asian alone
- 710.5%Black alone
- 390.3%American Indian alone
- 300.2%Other race alone
2000
2022
-
- 5,219,37385.8%White alone
- 505,4628.3%Black alone
- 214,5363.5%Hispanic
- 61,1151.0%Two or more races
- 58,4241.0%Asian alone
- 13,6540.2%American Indian alone
- 6,3480.1%Other race alone
- 1,5730.03%Native Hawaiian and Other
Pacific Islander alone

-
- 5,192,45576.0%White alone
- 628,0549.2%Black alone
- 534,5287.8%Hispanic
- 263,2423.9%Two or more races
- 172,8802.5%Asian alone
- 33,4670.5%Other race alone
- 5,8660.09%American Indian alone
- 2,5450.04%Native Hawaiian and Other
Pacific Islander alone

Income and house value in Bedford
- Median household income in 2022
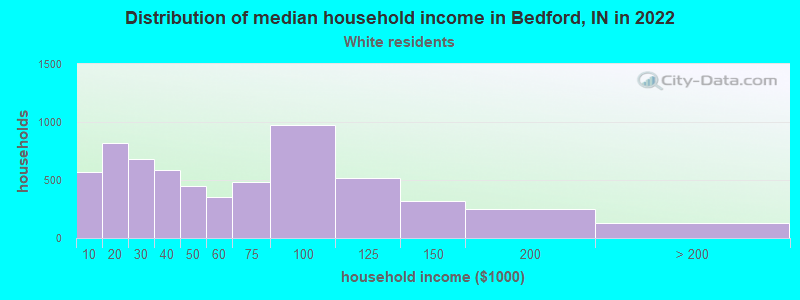
- $50,397White non-Hispanic householders
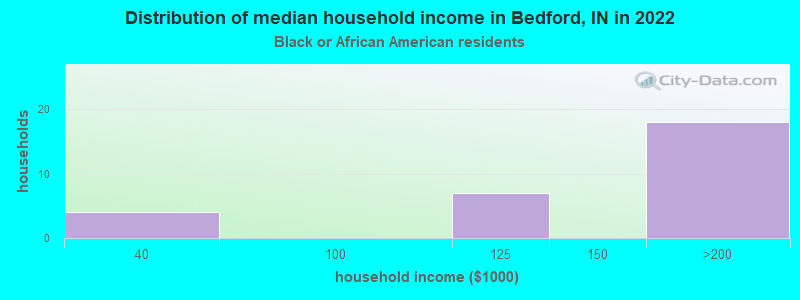
- $161,251Black householders
- $77,512Some other race householders
- $26,305Two or more races householders
- Median 2022 house value
- $139,843White Non-Hispanic householders
- $128,073Black or African American householders
- $79,197Some other race householders
- $153,408Two or more races householders
- $128,272Hispanic or Latino householders
Household income for White non-Hispanic householders
Household income for Black householders
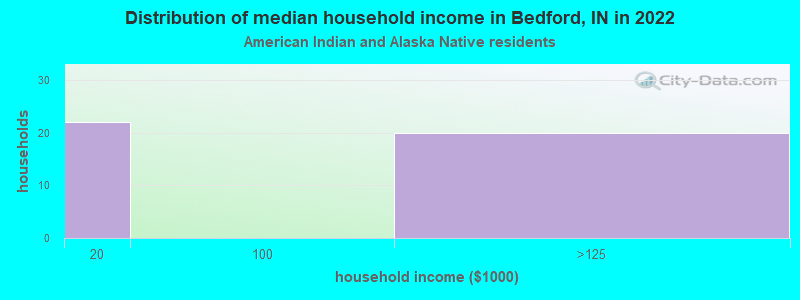
Household income for American Indian and Alaska Native householders
Household income for Some other race householders
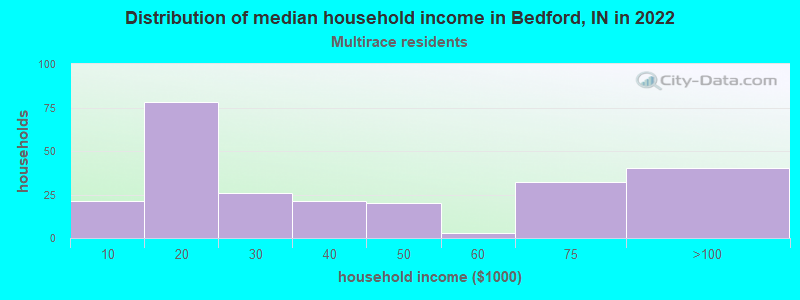
Household income for Two or more races householders
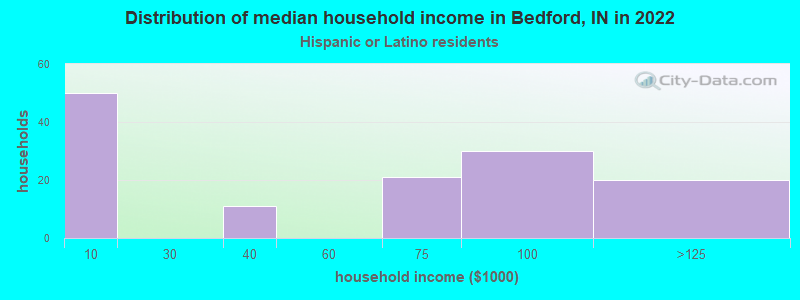
Household income for Hispanic or Latino race householders
Median age by race in Bedford
- 43.3Median age for White residents
- 42.0Males
- 44.6Females
- 59.8Median age for Black or African American residents
- 38.9Males
- 60.0Females
- 25.8Median age for American Indian / Alaska Native residents
- -654,255,318.5Males
- -491,600,353.2Females
- 41.8Median age for Asian residents
- 30.7Males
- 45.4Females
- -664,335,663.7Median age for Native Hawaiian / Pacific Islander residents
- -644,025,156.6Males
- -664,437,011.6Females
- 51.3Median age for Other race residents
- -691,695,107.4Males
- 52.7Females
- 37.4Median age for Two or more races residents
- 30.9Males
- 47.1Females
- 43.7Median age for White alone residents
- 42.0Males
- 47.3Females
- 23.9Median age for Hispanic or Latino residents
- 32.8Males
- 24.3Females
Owner/renter occupied households by race in Bedford
- House owners and renters - White residents
- 4,02266.2%Owner occupied
- 2,05033.8%Renter occupied
- House owners and renters - Black or African American residents
- 2083.1%Owner occupied
- 416.9%Renter occupied
- House owners and renters - American Indian / Alaska Native residents
- 22.3%Owner occupied
- 7997.7%Renter occupied
- House owners and renters - Asian residents
- 21100.0%Owner occupied
- House owners and renters - Other race residents
- 1325.0%Owner occupied
- 4075.0%Renter occupied
- House owners and renters - Two or more races residents
- 19980.0%Owner occupied
- 5020.0%Renter occupied
- House owners and renters - White alone residents
- 4,05566.4%Owner occupied
- 2,05133.6%Renter occupied
- House owners and renters - Hispanic or Latino residents
- 5339.6%Owner occupied
- 8160.4%Renter occupied
Language usage in Bedford
- English speakers - Total
- 97.3% of residents of Bedford speak English at home.
- 1.4% of residents speak Spanish at home
- 10957.4%Speak English very well
- 8142.6%Speak English less than very well
- 0.5% of residents speak other language at home
- 1420.3%Speak English very well
- 5579.7%Speak English less than very well
- English speakers - Born in the United States
- 97.6% of residents of Bedford speak English at home.
- 1.6% of residents speak Spanish at home
- 3579.5%Speak English very well
- 920.5%Speak English less than very well
- 0.3% of residents speak other language at home
- 7100.0%Speak English very well
All residents speak only English at home
- English speakers - Foreign-born
- 39.7% of residents of Bedford speak English at home.
- 33.9% of residents speak Spanish at home
- 1517.2%Speak English very well
- 7282.8%Speak English less than very well
- 24.5% of residents speak other language at home
- 711.1%Speak English very well
- 5688.9%Speak English less than very well
White (Caucasian) - Speak only English
| Native: | 99.7% (12,236) |
| Foreign-born: | 100.0% (36) |
Black or African American - Speak only English
| Native: | 99.5% (65) |
| Foreign-born: | 68.2% (4) |
Asian - Speak only English
| Native: | 94.8% (36) |
| Foreign-born: | 26.4% (20) |
Other race - Speak only English
| Native: | 84.2% (26) |
| Foreign-born: | 100.0% (30) |
Two or more races - Speak another language
| Native: | 10.5% (51) |
| Foreign-born: | 99.0% (101) |
White alone - Speak only English
| Native: | 99.5% (12,092) |
| Foreign-born: | 93.1% (47) |
Hispanic or Latino - Speak only English
| Native: | 83.9% (325) |
| Foreign-born: | 25.0% (29) |
Hispanic or Latino - Speak another language
| Native: | 14.3% (55) |
| Foreign-born: | 75.6% (86) |
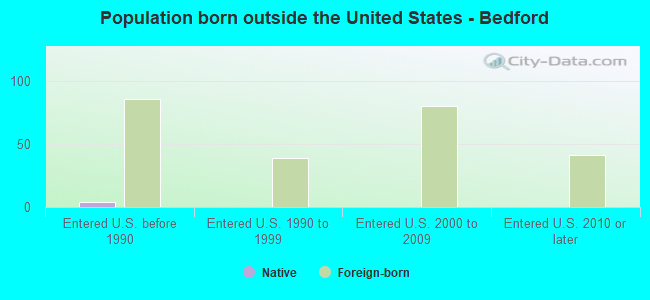
Foreign-born residents in Bedford
256 residents are foreign born
| This city: | 1.8% |
| Indiana: | 5.6% |
Marital status for residents in Bedford
Marital status - White (Caucasian) population 15 years and over
- Males
- 31.4%Never married
- 47.2%Now married
- 0.3%Separated
- 4.9%Widowed
- 16.2%Divorced
- Females
- 20.2%Never married
- 39.2%Now married
- 2.8%Separated
- 18.8%Widowed
- 19.1%Divorced
Women who gave birth in the past 12 months
| Now married: | 37.5% (55) |
| Unmarried: | 62.5% (92) |
Women who did not give birth in the past 12 months
| Now married: | 42.7% (1,048) |
| Unmarried: | 57.3% (1,408) |
Marital status - Black or African American population 15 years and over
- Males
- 100.0%Never married
- 0.0%Now married
- 0.0%Separated
- 0.0%Widowed
- 0.0%Divorced
- Females
- 49.0%Never married
- 8.2%Now married
- 0.0%Separated
- 0.0%Widowed
- 42.9%Divorced
Women who did not give birth in the past 12 months
| Now married: | 44.4% (4) |
| Unmarried: | 55.6% (5) |
Marital status - American Indian / Alaska Native population 15 years and over
- Males
- 32.7%Never married
- 67.3%Now married
- 0.0%Separated
- 0.0%Widowed
- 0.0%Divorced
- Females
- 0.0%Never married
- 100.0%Now married
- 0.0%Separated
- 0.0%Widowed
- 0.0%Divorced
Women who did not give birth in the past 12 months
| Now married: | 100.0% (2) |
| Unmarried: | 0.0% (0) |
Marital status - Asian population 15 years and over
- Males
- 66.7%Never married
- 33.3%Now married
- 0.0%Separated
- 0.0%Widowed
- 0.0%Divorced
- Females
- 62.0%Never married
- 38.0%Now married
- 0.0%Separated
- 0.0%Widowed
- 0.0%Divorced
Women who did not give birth in the past 12 months
| Now married: | 73.0% (28) |
| Unmarried: | 27.0% (10) |
Marital status - Other race population 15 years and over
- Males
- 0.0%Never married
- 40.0%Now married
- 60.0%Separated
- 0.0%Widowed
- 0.0%Divorced
- Females
- 28.6%Never married
- 0.0%Now married
- 0.0%Separated
- 11.9%Widowed
- 59.5%Divorced
Women who did not give birth in the past 12 months
| Now married: | 0.0% (0) |
| Unmarried: | 100.0% (45) |
Marital status - Two or more races population 15 years and over
- Males
- 18.8%Never married
- 60.7%Now married
- 0.0%Separated
- 17.0%Widowed
- 3.6%Divorced
- Females
- 6.2%Never married
- 18.0%Now married
- 9.6%Separated
- 29.8%Widowed
- 36.5%Divorced
Women who gave birth in the past 12 months
| Now married: | 100.0% (8) |
| Unmarried: | 0.0% (0) |
Women who did not give birth in the past 12 months
| Now married: | 40.0% (41) |
| Unmarried: | 60.0% (62) |
Marital status - White alone, not Hispanic / Latino population 15 years and over
- Males
- 31.4%Never married
- 47.2%Now married
- 0.3%Separated
- 4.9%Widowed
- 16.2%Divorced
- Females
- 19.2%Never married
- 39.5%Now married
- 2.5%Separated
- 19.2%Widowed
- 19.6%Divorced
Women who gave birth in the past 12 months
| Now married: | 43.2% (56) |
| Unmarried: | 56.8% (74) |
Women who did not give birth in the past 12 months
| Now married: | 42.6% (1,011) |
| Unmarried: | 57.4% (1,362) |
Marital status - Hispanic or Latino population 15 years and over
- Males
- 25.5%Never married
- 55.1%Now married
- 0.0%Separated
- 19.4%Widowed
- 0.0%Divorced
- Females
- 44.9%Never married
- 28.3%Now married
- 8.3%Separated
- 0.0%Widowed
- 18.5%Divorced
Women who gave birth in the past 12 months
| Now married: | 23.1% (6) |
| Unmarried: | 76.9% (21) |
Women who did not give birth in the past 12 months
| Now married: | 36.6% (60) |
| Unmarried: | 63.4% (104) |
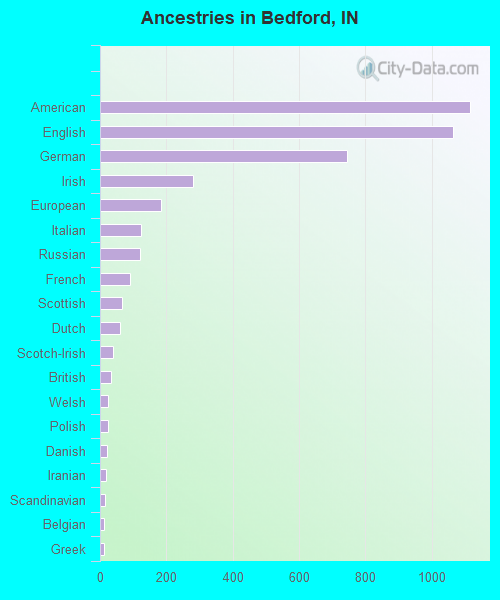
Ancestries in Bedford

- 1,11721.8%American
- 1,06520.8%English
- 74514.5%German
- 2815.5%Irish
- 1843.6%European
- 1232.4%Italian
- 1222.4%Russian
- 911.8%French
- 671.3%Scottish
- 601.2%Dutch
- 390.8%Scotch-Irish
- 320.6%British
- 240.5%Welsh
- 230.4%Polish
- 210.4%Danish
- 190.4%Iranian
- 150.3%Scandinavian
- 120.2%Belgian
- 110.2%Greek
- 80.2%Ukrainian
- 60.1%Celtic
- 50.10%Ugandan
- 30.06%Canadian
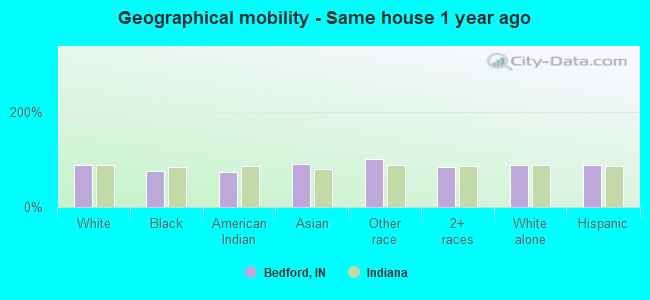
Geographical mobility in Bedford

- Same house 1 year ago
- 11,09387.6%White (Caucasian)
- 5576.4%Black or African American
- 6873.0%American Indian / Alaska Native
- 10390.6%Asian
- 63100.0%Other race
- 52183.5%Two or more races
- 11,03087.4%White alone, not Hispanic / Latino
- 44087.8%Hispanic or Latino
-
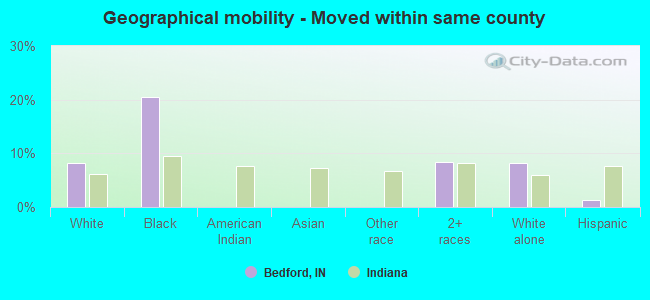
- Moved within same county
- 1,0328.1%White / Caucasian
- 1520.5%Black or African American
- 538.4%Two or more races
- 1,0458.3%White alone, not Hispanic / Latino
- 61.2%Hispanic or Latino
-
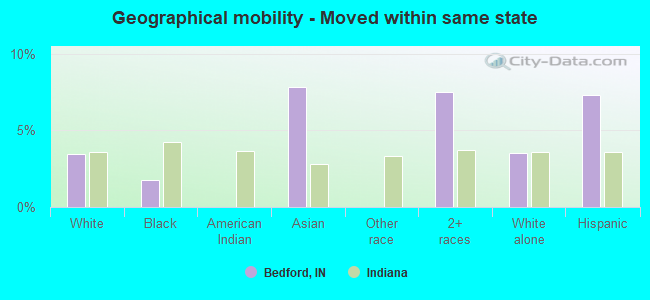
- Moved within same state
- 4403.5%White / Caucasian
- 11.7%Black or African American
- 97.8%Asian
- 477.5%Two or more races
- 4453.5%White alone, not Hispanic / Latino
- 377.3%Hispanic or Latino
-
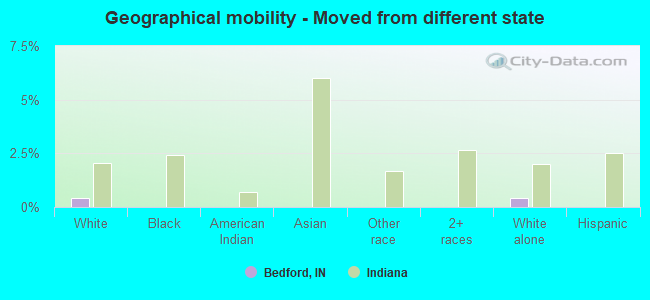
- Moved from different state
- 520.4%White / Caucasian
- 530.4%White alone, not Hispanic / Latino
-
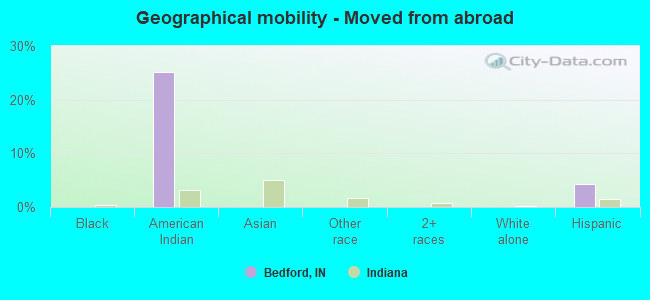
- Moved from abroad
- 2425.2%American Indian / Alaska Native
- 224.3%Hispanic or Latino
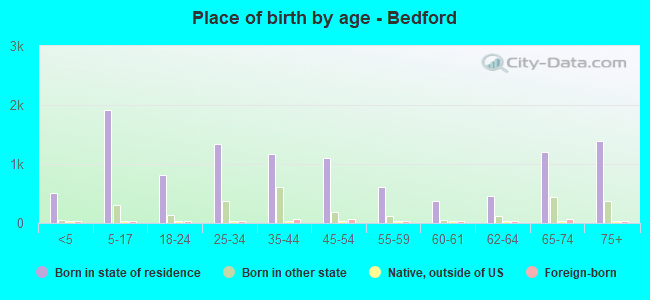
Children Nativity (place of birth) in Bedford
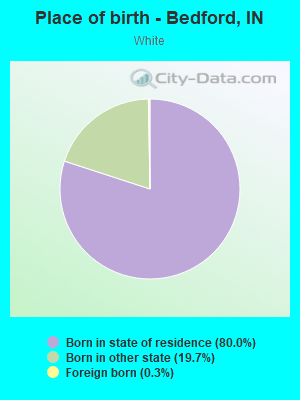
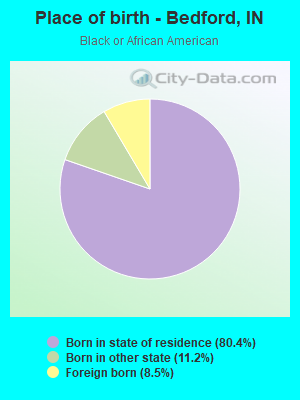
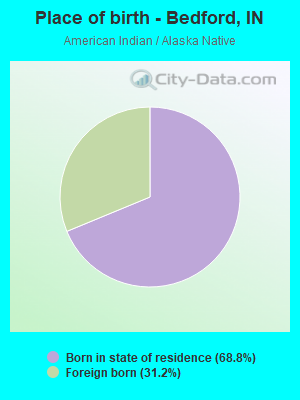
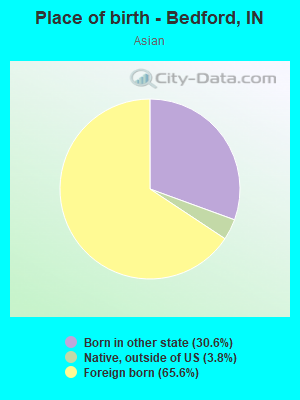
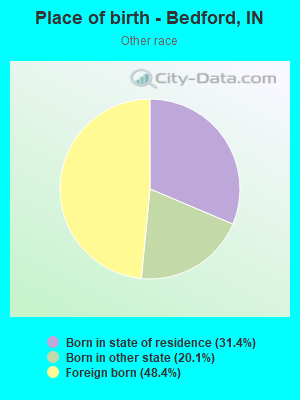
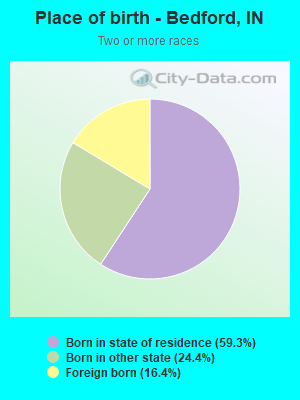
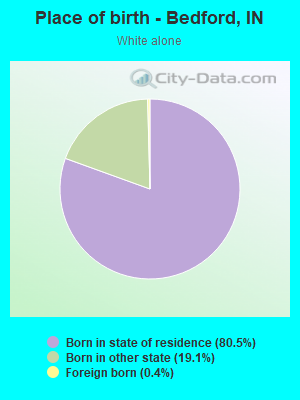
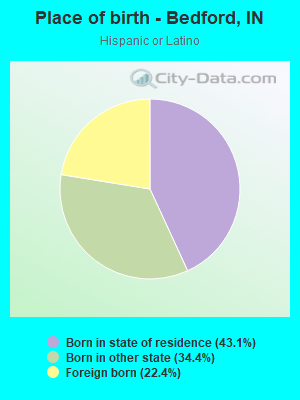
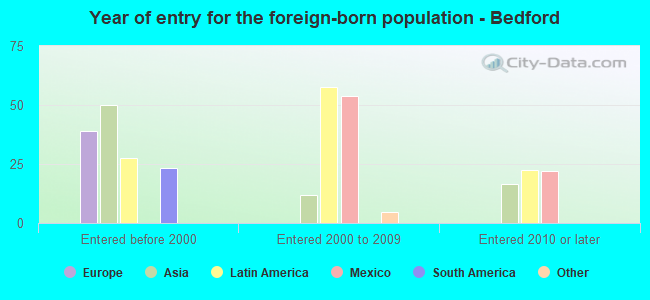
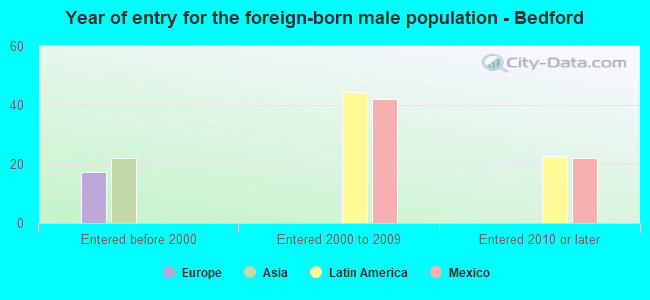
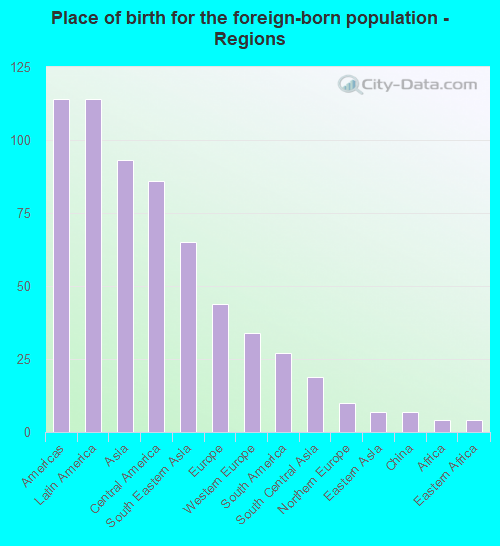
Place of birth for residents in Bedford
![Place of birth for the foreign-born population - Regions]()
- 114Americas
- 114Latin America
- 93Asia
- 86Central America
- 65South Eastern Asia
- 44Europe
- 34Western Europe
- 27South America
- 19South Central Asia
- 10Northern Europe
- 7Eastern Asia
- 7China
- 4Africa
- 4Eastern Africa
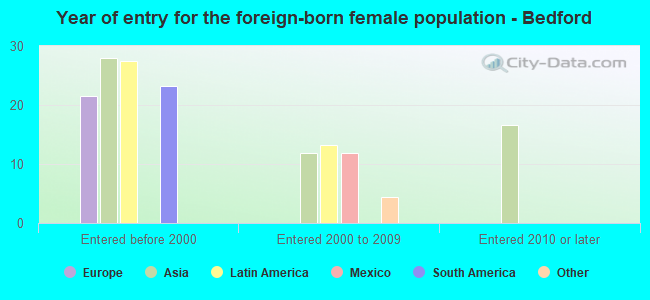
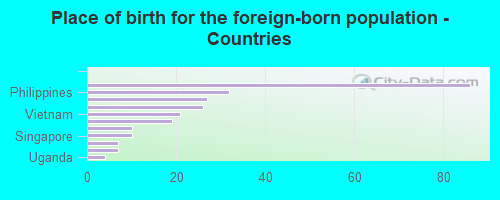
![Place of birth for the foreign-born population - Countries]()
- 86Mexico
- 32Philippines
- 27Colombia
- 26Germany
- 21Vietnam
- 19Iran
- 10United Kingdom
- 10Singapore
- 7Netherlands
- 7China
- 4Uganda
Grandparents responsible for own grandchildren in Bedford
Zip codes: 47421.