Races in Barnard, Tennessee (TN) Detailed Stats
Ancestries, Foreign-born residents, place of birth
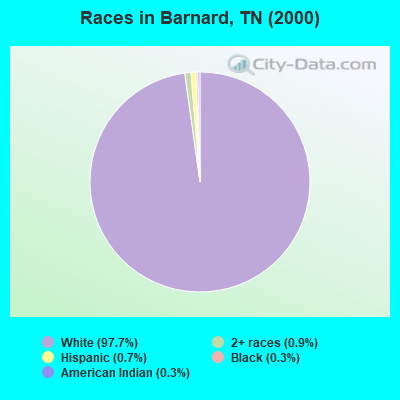
Race distribution in Barnard

- 6,03197.7%White alone
- 560.9%Two or more races
- 430.7%Hispanic
- 200.3%Black alone
- 190.3%American Indian alone
- 40.06%Asian alone
2000
2022
-
- 4,505,93079.2%White alone
- 928,20416.3%Black alone
- 123,8382.2%Hispanic
- 54,8241.0%Two or more races
- 56,0771.0%Asian alone
- 13,8200.2%American Indian alone
- 4,7800.08%Other race alone
- 1,8100.03%Native Hawaiian and Other
Pacific Islander alone

-
- 5,070,02671.9%White alone
- 1,089,73815.5%Black alone
- 442,6296.3%Hispanic
- 279,3814.0%Two or more races
- 131,8171.9%Asian alone
- 26,9720.4%Other race alone
- 6,3870.09%American Indian alone
- 4,3890.06%Native Hawaiian and Other
Pacific Islander alone

Income and house value in Barnard
- Median household income in 2022
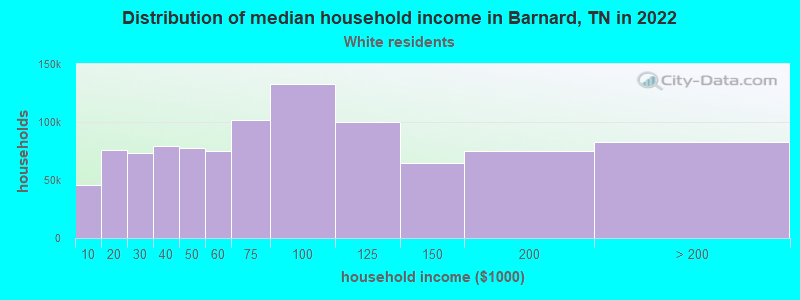
- $61,860White non-Hispanic householders
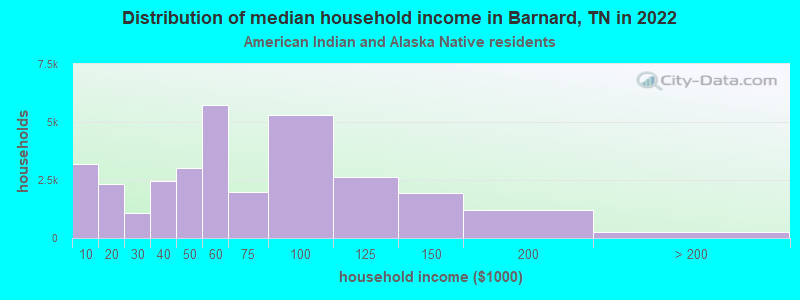
- over $200,000American Indian and Alaska Native householders
- $24,911Some other race householders
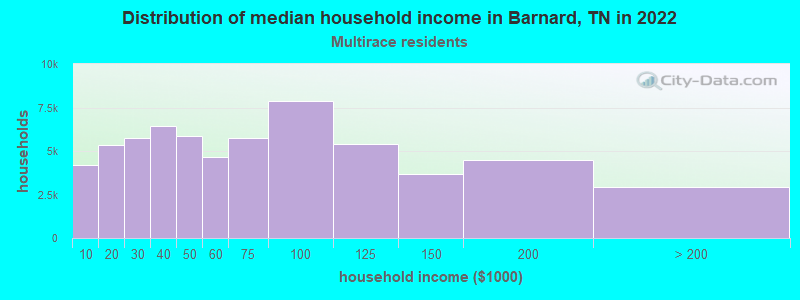
- $49,034Two or more races householders
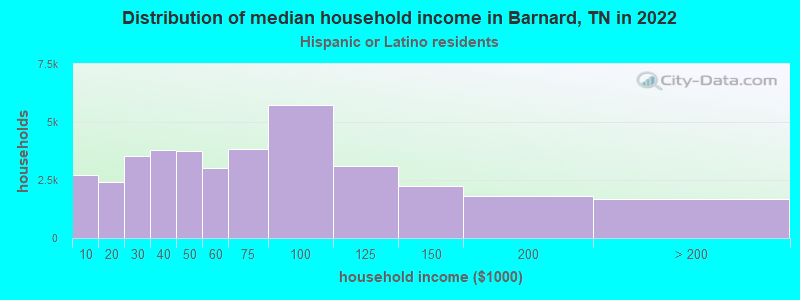
- $48,552Hispanic or Latino race householders
- Median 2022 house value
- $288,720White Non-Hispanic householders
- $336,243American Indian or Alaska Native householders
- $224,162Hispanic or Latino householders
Household income for White non-Hispanic householders
Household income for American Indian and Alaska Native householders
Household income for Two or more races householders
Household income for Hispanic or Latino race householders
Zip code: 37880