Races in Atascocita, Texas (TX) Detailed Stats
Data:
Races - White alone (%)
Races - White alone (% change since 2000)
Races - Black alone (%)
Races - Black alone (% change since 2000)
Races - American Indian alone (%)
Races - American Indian alone (% change since 2000)
Races - Asian alone (%)
Races - Asian alone (% change since 2000)
Races - Hispanic (%)
Races - Hispanic (% change since 2000)
Races - Native Hawaiian and Other Pacific Islander alone (%)
Races - Native Hawaiian and Other Pacific Islander alone (% change since 2000)
Races - Two or more races(%)
Races - Two or more races(% change since 2000)
Races - Other race alone (%)
Races - Other race alone (% change since 2000)
Racial diversity
Place of birth - Born in state of residence (%)
Place of birth - Born in state of residence (%) - White
Place of birth - Born in state of residence (%) - Black or African American
Place of birth - Born in state of residence (%) - Asian
Place of birth - Born in state of residence (%) - Hispanic or Latino
Place of birth - Born in state of residence (%) - American Indian and Alaska Native
Place of birth - Born in state of residence (%) - Multirace
Place of birth - Born in state of residence (%) - Other Race
Place of birth - Born in other state (%)
Place of birth - Born in other state (%) - White
Place of birth - Born in other state (%) - Black or African American
Place of birth - Born in other state (%) - Asian
Place of birth - Born in other state (%) - Hispanic or Latino
Place of birth - Born in other state (%) - American Indian and Alaska Native
Place of birth - Born in other state (%) - Multirace
Place of birth - Born in other state (%) - Other Race
Place of birth - Native, outside of US (%)
Place of birth - Native, outside of US (%) - White
Place of birth - Native, outside of US (%) - Black or African American
Place of birth - Native, outside of US (%) - Asian
Place of birth - Native, outside of US (%) - Hispanic or Latino
Place of birth - Native, outside of US (%) - American Indian and Alaska Native
Place of birth - Native, outside of US (%) - Multirace
Place of birth - Native, outside of US (%) - Other Race
Place of birth - Foreign born (%)
Place of birth - Foreign born (%) - White
Place of birth - Foreign born (%) - Black or African American
Place of birth - Foreign born (%) - Asian
Place of birth - Foreign born (%) - Hispanic or Latino
Place of birth - Foreign born (%) - American Indian and Alaska Native
Place of birth - Foreign born (%) - Multirace
Place of birth - Foreign born (%) - Other Race
Residents speaking English at home (%)
Residents speaking English at home - Born in the United States (%)
Residents speaking English at home - Native, born elsewhere (%)
Residents speaking English at home - Foreign born (%)
Residents speaking Spanish at home (%)
Residents speaking Spanish at home - Born in the United States (%)
Residents speaking Spanish at home - Native, born elsewhere (%)
Residents speaking Spanish at home - Foreign born (%)
Residents speaking other language at home (%)
Residents speaking other language at home - Born in the United States (%)
Residents speaking other language at home - Native, born elsewhere (%)
Residents speaking other language at home - Foreign born (%)
Marital status - Never married (%)
Marital status - Now married (%)
Marital status - Separated (%)
Marital status - Widowed (%)
Marital status - Divorced (%)
Ancestries Reported - Arab (%)
Ancestries Reported - Czech (%)
Ancestries Reported - Danish (%)
Ancestries Reported - Dutch (%)
Ancestries Reported - English (%)
Ancestries Reported - French (%)
Ancestries Reported - French Canadian (%)
Ancestries Reported - German (%)
Ancestries Reported - Greek (%)
Ancestries Reported - Hungarian (%)
Ancestries Reported - Irish (%)
Ancestries Reported - Italian (%)
Ancestries Reported - Lithuanian (%)
Ancestries Reported - Norwegian (%)
Ancestries Reported - Polish (%)
Ancestries Reported - Portuguese (%)
Ancestries Reported - Russian (%)
Ancestries Reported - Scotch-Irish (%)
Ancestries Reported - Scottish (%)
Ancestries Reported - Slovak (%)
Ancestries Reported - Subsaharan African (%)
Ancestries Reported - Swedish (%)
Ancestries Reported - Swiss (%)
Ancestries Reported - Ukrainian (%)
Ancestries Reported - United States (%)
Ancestries Reported - Welsh (%)
Ancestries Reported - West Indian (%)
Ancestries Reported - Other (%)
Geographical mobility - Same house 1 year ago (%)
Geographical mobility - Same house 1 year ago (%) - White
Geographical mobility - Same house 1 year ago (%) - Black or African American
Geographical mobility - Same house 1 year ago (%) - Asian
Geographical mobility - Same house 1 year ago (%) - Hispanic or Latino
Geographical mobility - Same house 1 year ago (%) - American Indian and Alaska Native
Geographical mobility - Same house 1 year ago (%) - Multirace
Geographical mobility - Same house 1 year ago (%) - Other Race
Geographical mobility - Moved within same county (%)
Geographical mobility - Moved within same county (%) - White
Geographical mobility - Moved within same county (%) - Black or African American
Geographical mobility - Moved within same county (%) - Asian
Geographical mobility - Moved within same county (%) - Hispanic or Latino
Geographical mobility - Moved within same county (%) - American Indian and Alaska Native
Geographical mobility - Moved within same county (%) - Multirace
Geographical mobility - Moved within same county (%) - Other Race
Geographical mobility - Moved from different county within same state (%)
Geographical mobility - Moved from different county within same state (%) - White
Geographical mobility - Moved from different county within same state (%) - Black or African American
Geographical mobility - Moved from different county within same state (%) - Asian
Geographical mobility - Moved from different county within same state (%) - Hispanic or Latino
Geographical mobility - Moved from different county within same state (%) - American Indian and Alaska Native
Geographical mobility - Moved from different county within same state (%) - Multirace
Geographical mobility - Moved from different county within same state (%) - Other Race
Geographical mobility - Moved from different state (%)
Geographical mobility - Moved from different state (%) - White
Geographical mobility - Moved from different state (%) - Black or African American
Geographical mobility - Moved from different state (%) - Asian
Geographical mobility - Moved from different state (%) - Hispanic or Latino
Geographical mobility - Moved from different state (%) - American Indian and Alaska Native
Geographical mobility - Moved from different state (%) - Multirace
Geographical mobility - Moved from different state (%) - Other Race
Geographical mobility - Moved from abroad (%)
Geographical mobility - Moved from abroad (%) - White
Geographical mobility - Moved from abroad (%) - Black or African American
Geographical mobility - Moved from abroad (%) - Asian
Geographical mobility - Moved from abroad (%) - Hispanic or Latino
Geographical mobility - Moved from abroad (%) - American Indian and Alaska Native
Geographical mobility - Moved from abroad (%) - Multirace
Geographical mobility - Moved from abroad (%) - Other Race
Place of birth for the foreign-born population - Ireland (%)
Place of birth for the foreign-born population - Denmark (%)
Place of birth for the foreign-born population - Norway (%)
Place of birth for the foreign-born population - Sweden (%)
Place of birth for the foreign-born population - United Kingdom (%)
Place of birth for the foreign-born population - England (%)
Place of birth for the foreign-born population - Scotland (%)
Place of birth for the foreign-born population - Other Northern Europe (%)
Place of birth for the foreign-born population - Austria (%)
Place of birth for the foreign-born population - Belgium (%)
Place of birth for the foreign-born population - France (%)
Place of birth for the foreign-born population - Germany (%)
Place of birth for the foreign-born population - Netherlands (%)
Place of birth for the foreign-born population - Switzerland (%)
Place of birth for the foreign-born population - Other Western Europe (%)
Place of birth for the foreign-born population - Greece (%)
Place of birth for the foreign-born population - Italy (%)
Place of birth for the foreign-born population - Portugal (%)
Place of birth for the foreign-born population - Spain (%)
Place of birth for the foreign-born population - Other Southern Europe (%)
Place of birth for the foreign-born population - Albania (%)
Place of birth for the foreign-born population - Belarus (%)
Place of birth for the foreign-born population - Bosnia and Herzegovina (%)
Place of birth for the foreign-born population - Bulgaria (%)
Place of birth for the foreign-born population - Croatia (%)
Place of birth for the foreign-born population - Czechoslovakia (%)
Place of birth for the foreign-born population - Hungary (%)
Place of birth for the foreign-born population - Latvia (%)
Place of birth for the foreign-born population - Lithuania (%)
Place of birth for the foreign-born population - North Macedonia (Macedonia) (%)
Place of birth for the foreign-born population - Moldova (%)
Place of birth for the foreign-born population - Poland (%)
Place of birth for the foreign-born population - Romania (%)
Place of birth for the foreign-born population - Russia (%)
Place of birth for the foreign-born population - Serbia (%)
Place of birth for the foreign-born population - Ukraine (%)
Place of birth for the foreign-born population - Other Eastern Europe (%)
Place of birth for the foreign-born population - China (%)
Place of birth for the foreign-born population - Hong Kong (%)
Place of birth for the foreign-born population - Taiwan (%)
Place of birth for the foreign-born population - Japan (%)
Place of birth for the foreign-born population - Korea (%)
Place of birth for the foreign-born population - Other Eastern Asia (%)
Place of birth for the foreign-born population - Afghanistan (%)
Place of birth for the foreign-born population - Bangladesh (%)
Place of birth for the foreign-born population - India (%)
Place of birth for the foreign-born population - Iran (%)
Place of birth for the foreign-born population - Kazakhstan (%)
Place of birth for the foreign-born population - Nepal (%)
Place of birth for the foreign-born population - Pakistan (%)
Place of birth for the foreign-born population - Sri Lanka (%)
Place of birth for the foreign-born population - Uzbekistan (%)
Place of birth for the foreign-born population - Other South Central Asia (%)
Place of birth for the foreign-born population - Burma (%)
Place of birth for the foreign-born population - Cambodia (%)
Place of birth for the foreign-born population - Indonesia (%)
Place of birth for the foreign-born population - Laos (%)
Place of birth for the foreign-born population - Malaysia (%)
Place of birth for the foreign-born population - Philippines (%)
Place of birth for the foreign-born population - Singapore (%)
Place of birth for the foreign-born population - Thailand (%)
Place of birth for the foreign-born population - Vietnam (%)
Place of birth for the foreign-born population - Other South Eastern Asia (%)
Place of birth for the foreign-born population - Armenia (%)
Place of birth for the foreign-born population - Iraq (%)
Place of birth for the foreign-born population - Israel (%)
Place of birth for the foreign-born population - Jordan (%)
Place of birth for the foreign-born population - Kuwait (%)
Place of birth for the foreign-born population - Lebanon (%)
Place of birth for the foreign-born population - Saudi Arabia (%)
Place of birth for the foreign-born population - Syria (%)
Place of birth for the foreign-born population - Turkey (%)
Place of birth for the foreign-born population - Yemen (%)
Place of birth for the foreign-born population - Other Western Asia (%)
Place of birth for the foreign-born population - Eritrea (%)
Place of birth for the foreign-born population - Ethiopia (%)
Place of birth for the foreign-born population - Kenya (%)
Place of birth for the foreign-born population - Somalia (%)
Place of birth for the foreign-born population - Uganda (%)
Place of birth for the foreign-born population - Zimbabwe (%)
Place of birth for the foreign-born population - Other Eastern Africa (%)
Place of birth for the foreign-born population - Cameroon (%)
Place of birth for the foreign-born population - Congo (%)
Place of birth for the foreign-born population - Democratic Republic of Congo (Zaire) (%)
Place of birth for the foreign-born population - Other Middle Africa (%)
Place of birth for the foreign-born population - Egypt (%)
Place of birth for the foreign-born population - Morocco (%)
Place of birth for the foreign-born population - Sudan (%)
Place of birth for the foreign-born population - Other Northern Africa (%)
Place of birth for the foreign-born population - South Africa (%)
Place of birth for the foreign-born population - Other Southern Africa (%)
Place of birth for the foreign-born population - Cabo Verde (%)
Place of birth for the foreign-born population - Ghana (%)
Place of birth for the foreign-born population - Liberia (%)
Place of birth for the foreign-born population - Nigeria (%)
Place of birth for the foreign-born population - Senegal (%)
Place of birth for the foreign-born population - Sierra Leone (%)
Place of birth for the foreign-born population - Other Western Africa (%)
Place of birth for the foreign-born population - Australia (%)
Place of birth for the foreign-born population - New Zealand (%)
Place of birth for the foreign-born population - Fiji (%)
Place of birth for the foreign-born population - Micronesia (%)
Place of birth for the foreign-born population - Bahamas (%)
Place of birth for the foreign-born population - Barbados (%)
Place of birth for the foreign-born population - Cuba (%)
Place of birth for the foreign-born population - Dominica (%)
Place of birth for the foreign-born population - Dominican Republic (%)
Place of birth for the foreign-born population - Grenada (%)
Place of birth for the foreign-born population - Haiti (%)
Place of birth for the foreign-born population - Jamaica (%)
Place of birth for the foreign-born population - St. Vincent and the Grenadines (%)
Place of birth for the foreign-born population - Trinidad and Tobago (%)
Place of birth for the foreign-born population - West Indies (%)
Place of birth for the foreign-born population - Other Caribbean (%)
Place of birth for the foreign-born population - Belize (%)
Place of birth for the foreign-born population - Costa Rica (%)
Place of birth for the foreign-born population - El Salvador (%)
Place of birth for the foreign-born population - Guatemala (%)
Place of birth for the foreign-born population - Honduras (%)
Place of birth for the foreign-born population - Mexico (%)
Place of birth for the foreign-born population - Nicaragua (%)
Place of birth for the foreign-born population - Panama (%)
Place of birth for the foreign-born population - Other Central America (%)
Place of birth for the foreign-born population - Argentina (%)
Place of birth for the foreign-born population - Bolivia (%)
Place of birth for the foreign-born population - Brazil (%)
Place of birth for the foreign-born population - Chile (%)
Place of birth for the foreign-born population - Colombia (%)
Place of birth for the foreign-born population - Ecuador (%)
Place of birth for the foreign-born population - Guyana (%)
Place of birth for the foreign-born population - Peru (%)
Place of birth for the foreign-born population - Uruguay (%)
Place of birth for the foreign-born population - Venezuela (%)
Place of birth for the foreign-born population - Other South America (%)
Place of birth for the foreign-born population - Canada (%)
Place of birth for the foreign-born population - Other Northern America (%)
Place of birth for the foreign-born population - Other (%)
Latest news about races in Atascocita, TX collected exclusively by city-data.com from local newspapers, TV, and radio stations
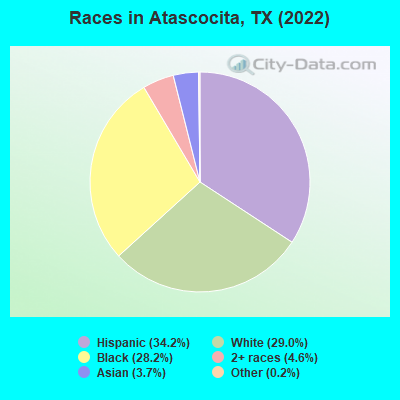
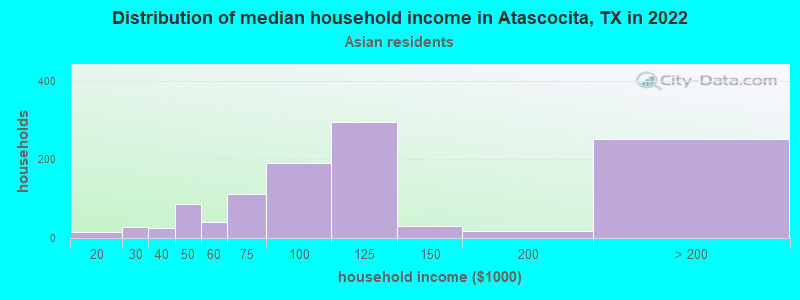
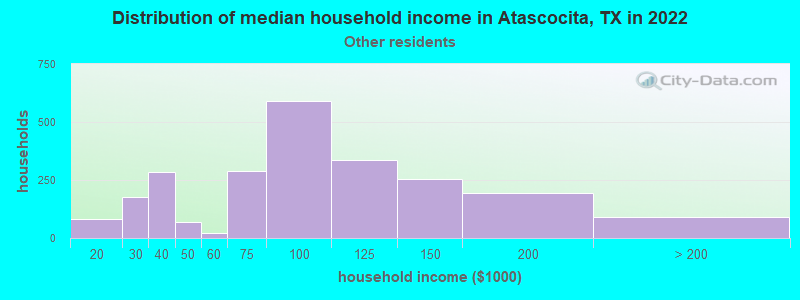
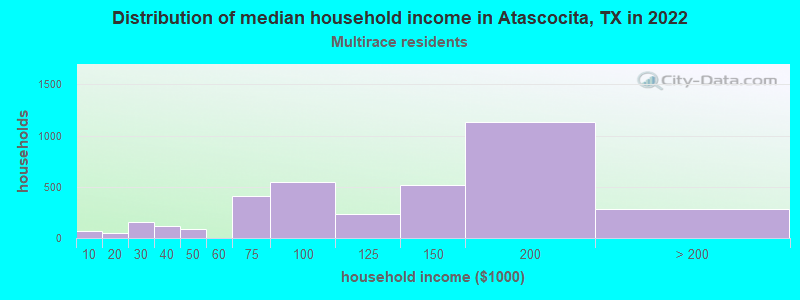
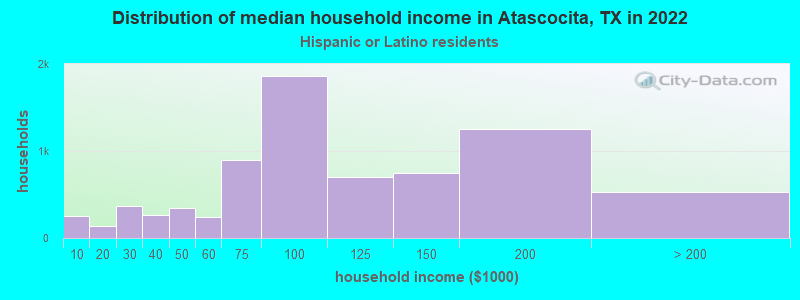
According to 2022 data, the most numerous races in Atascocita, TX are Hispanic (36,859 residents), White alone (31,201 residents), and Black alone (30,356 residents). 72.4% of Atascocita residents speak English at home. 9.8% of Atascocita, TX residents are foreign-born (5.9% born in Latin America, 2.3% born in Asia), which is 73.4% less than the foreign-born rate of 17.0% across the entire state of Texas.
Race distribution in Atascocita
2000 2022
10,933,313 52.4% White alone 6,669,666 32.0% Hispanic 2,364,255 11.3% Black alone 554,445 2.7% Asian alone 230,567 1.1% Two or more races 68,859 0.3% American Indian alone 19,958 0.10% Other race alone 10,757 0.05% Native Hawaiian and Other
12,070,642 40.2% Hispanic 11,683,430 38.9% White alone 3,508,706 11.7% Black alone 1,608,173 5.4% Asian alone 956,560 3.2% Two or more races 125,763 0.4% Other race alone 47,023 0.2% American Indian alone 29,275 0.10% Native Hawaiian and Other
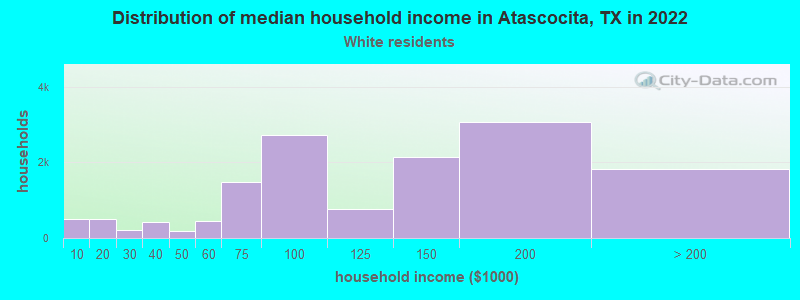
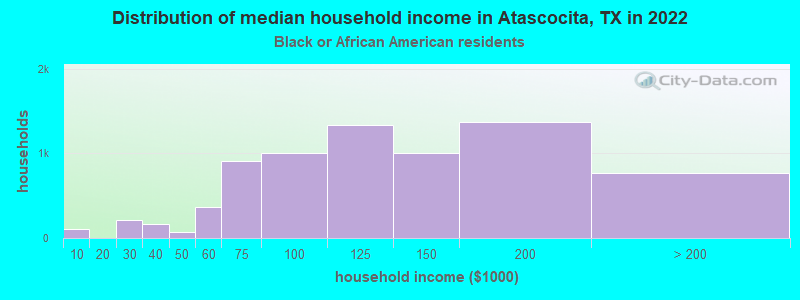
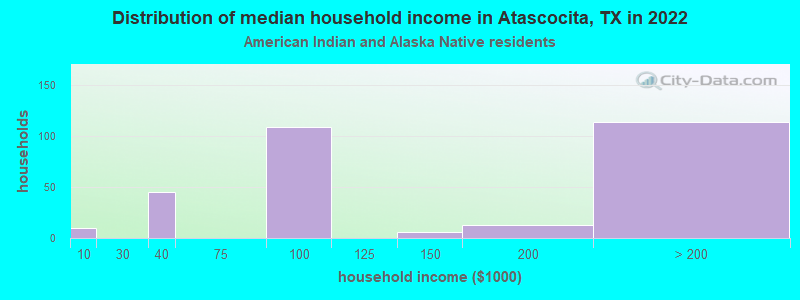
Income and house value in Atascocita Median household income in 2022 $135,775 White non-Hispanic householders$104,738 Black householders$108,793 Asian householders$78,850 Some other race householders$120,272 Two or more races householders$91,352 Hispanic or Latino race householdersMedian 2022 house value $297,147 White Non-Hispanic householders$277,629 Black or African American householders$218,302 American Indian or Alaska Native householders $317,950 Asian householders$259,137 Some other race householders$256,826 Two or more races householders$256,312 Hispanic or Latino householders
Median age by race in Atascocita
35.1 Median age for White residents38.5 29.4 35.8 Median age for Black or African American residents35.8 35.6 24.6 Median age for American Indian / Alaska Native residents32.3 21.9 43.8 Median age for Asian residents48.0 42.9 -666,666,666.0 Median age for Native Hawaiian / Pacific Islander residents-666,666,666.0 -666,666,666.0 24.7 Median age for Other race residents24.3 26.7 29.4 Median age for Two or more races residents25.8 32.1 38.9 Median age for White alone residents40.5 35.0 24.3 Median age for Hispanic or Latino residents24.5 24.2
Owner/renter occupied households by race in Atascocita
House owners and renters - White residents 11,908 83.2% Owner occupied2,406 16.8% Renter occupiedHouse owners and renters - Black or African American residents 7,729 63.9% Owner occupied4,360 36.1% Renter occupiedHouse owners and renters - American Indian / Alaska Native residents 363 87.1% Owner occupied54 12.9% Renter occupiedHouse owners and renters - Asian residents 1,018 92.8% Owner occupied79 7.2% Renter occupiedHouse owners and renters - Other race residents 2,295 70.4% Owner occupied967 29.6% Renter occupiedHouse owners and renters - Two or more races residents 2,263 83.6% Owner occupied443 16.4% Renter occupiedHouse owners and renters - White alone residents 9,956 83.0% Owner occupied2,036 17.0% Renter occupiedHouse owners and renters - Hispanic or Latino residents 6,744 82.9% Owner occupied1,389 17.1% Renter occupied
Language usage in Atascocita
English speakers - Total 72.4% of residents of Atascocita speak English at home.
22.8% of residents speak Spanish at home 16,646 73.7% Speak English very well5,945 26.3% Speak English less than very well4.8% of residents speak other language at home 3,008 63.9% Speak English very well1,699 36.1% Speak English less than very well
English speakers - Born in the United States 90.2% of residents of Atascocita speak English at home.
9.5% of residents speak Spanish at home 2,085 93.5% Speak English very well144 6.5% Speak English less than very well0.3% of residents speak other language at home 79 100.0% Speak English very well
English speakers - Native, born elsewhere 75.9% of residents of Atascocita speak English at home.
6.9% of residents speak Spanish at home 152 100.0% Speak English very well17.2% of residents speak other language at home 379 100.0% Speak English very well
English speakers - Foreign-born 8.6% of residents of Atascocita speak English at home.
66.8% of residents speak Spanish at home 4,658 49.4% Speak English very well4,775 50.6% Speak English less than very well24.6% of residents speak other language at home 2,075 59.6% Speak English very well1,406 40.4% Speak English less than very well
White (Caucasian) - Speak only English Native:
84.8% (31,224)Foreign-born:
4.3% (145)
White (Caucasian) - Speak another language Native:
15.2% (5,614)Foreign-born:
95.7% (3,222)
Black or African American - Speak only English Native:
95.4% (17,374)Foreign-born:
37.4% (430)
Black or African American - Speak another language Native:
4.6% (834)Foreign-born:
62.0% (712)
American Indian / Alaska Native - Speak another language Native:
29.6% (371)Foreign-born:
98.9% (84)
Asian - Speak only English Native:
73.3% (901)Foreign-born:
8.9% (158)
Asian - Speak another language Native:
27.2% (334)Foreign-born:
91.1% (1,609)
Other race - Speak another language Native:
59.3% (4,050)Foreign-born:
100.0% (3,797)
Two or more races - Speak only English Native:
72.7% (8,127)Foreign-born:
7.4% (205)
Two or more races - Speak another language Native:
27.3% (3,052)Foreign-born:
92.6% (2,563)
White alone - Speak only English Native:
98.2% (31,328)Foreign-born:
51.3% (490)
White alone - Speak another language Native:
1.7% (550)Foreign-born:
49.6% (474)
Hispanic or Latino - Speak only English Native:
50.5% (12,278)Foreign-born:
2.1% (205)
Hispanic or Latino - Speak another language Native:
49.5% (12,036)Foreign-born:
97.9% (9,389)
Foreign-born residents in Atascocita 8,836 residents are foreign born (5.9% Latin America , 2.3% Asia ).
This city:
9.8%Texas:
17.1%
Marital status for residents in Atascocita Marital status - White (Caucasian) population 15 years and over
Males 26.9% Never married53.1% Now married3.4% Separated0.6% Widowed16.1% DivorcedFemales 28.2% Never married45.3% Now married5.5% Separated11.8% Widowed9.2% DivorcedWomen who gave birth in the past 12 months Now married:
17.4% (106)Unmarried:
82.6% (502)
Women who did not give birth in the past 12 months Now married:
48.2% (4,246)Unmarried:
51.8% (4,559)
Marital status - Black or African American population 15 years and over
Males 44.0% Never married42.9% Now married1.1% Separated2.3% Widowed9.8% DivorcedFemales 37.4% Never married46.2% Now married0.0% Separated4.3% Widowed12.2% DivorcedWomen who gave birth in the past 12 months Now married:
37.7% (409)Unmarried:
62.3% (676)
Women who did not give birth in the past 12 months Now married:
46.3% (3,159)Unmarried:
53.7% (3,661)
Marital status - American Indian / Alaska Native population 15 years and over
Males 28.3% Never married49.4% Now married6.0% Separated13.7% Widowed2.6% DivorcedFemales 20.8% Never married57.5% Now married0.0% Separated4.7% Widowed17.0% DivorcedWomen who did not give birth in the past 12 months Now married:
61.6% (224)Unmarried:
38.4% (140)
Marital status - Asian population 15 years and over
Males 34.3% Never married63.0% Now married0.0% Separated0.7% Widowed2.0% DivorcedFemales 16.6% Never married75.4% Now married1.8% Separated4.0% Widowed2.2% DivorcedWomen who did not give birth in the past 12 months Now married:
72.3% (556)Unmarried:
27.7% (213)
Marital status - Other race population 15 years and over
Males 29.8% Never married65.7% Now married0.0% Separated0.2% Widowed4.3% DivorcedFemales 20.9% Never married57.8% Now married0.7% Separated12.5% Widowed8.1% DivorcedWomen who gave birth in the past 12 months Now married:
71.3% (119)Unmarried:
28.7% (48)
Women who did not give birth in the past 12 months Now married:
71.7% (1,494)Unmarried:
28.3% (590)
Marital status - Two or more races population 15 years and over
Males 46.5% Never married47.9% Now married0.2% Separated0.9% Widowed4.5% DivorcedFemales 32.5% Never married54.4% Now married1.7% Separated7.0% Widowed4.4% DivorcedWomen who gave birth in the past 12 months Now married:
100.0% (58)Unmarried:
0.0% (0)
Women who did not give birth in the past 12 months Now married:
52.5% (2,301)Unmarried:
47.5% (2,086)
Marital status - White alone, not Hispanic / Latino population 15 years and over
Males 26.0% Never married56.8% Now married0.0% Separated0.7% Widowed16.5% DivorcedFemales 29.2% Never married47.2% Now married0.0% Separated12.8% Widowed10.8% DivorcedWomen who gave birth in the past 12 months Now married:
17.4% (106)Unmarried:
82.6% (502)
Women who did not give birth in the past 12 months Now married:
42.5% (2,647)Unmarried:
57.5% (3,584)
Marital status - Hispanic or Latino population 15 years and over
Males 42.0% Never married51.1% Now married1.8% Separated0.1% Widowed4.9% DivorcedFemales 26.3% Never married56.7% Now married3.1% Separated7.3% Widowed6.6% DivorcedWomen who gave birth in the past 12 months Now married:
42.5% (178)Unmarried:
57.5% (241)
Women who did not give birth in the past 12 months Now married:
65.8% (5,382)Unmarried:
34.2% (2,794)
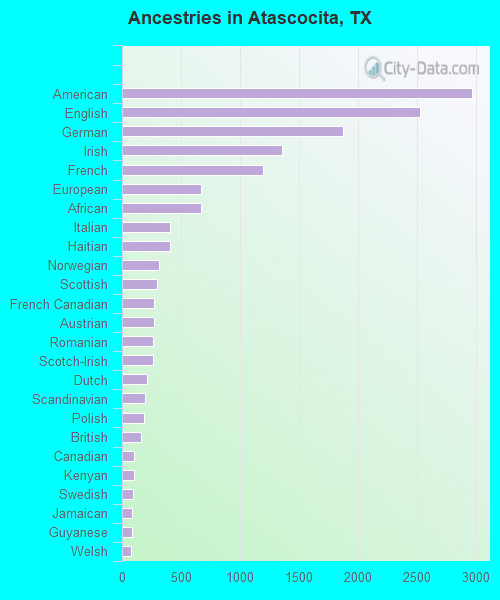
Ancestries in Atascocita
2,965 5.9% American2,526 5.0% English1,873 3.7% German1,357 2.7% Irish1,192 2.4% French669 1.3% European668 1.3% African407 0.8% Italian405 0.8% Haitian314 0.6% Norwegian297 0.6% Scottish272 0.5% French Canadian270 0.5% Austrian265 0.5% Romanian264 0.5% Scotch-Irish212 0.4% Dutch197 0.4% Scandinavian184 0.4% Polish159 0.3% British104 0.2% Canadian98 0.2% Kenyan95 0.2% Swedish86 0.2% Jamaican83 0.2% Guyanese78 0.2% Welsh63 0.1% Brazilian50 0.10% Iranian49 0.10% Cajun48 0.10% Czech46 0.09% Ghanaian41 0.08% South African29 0.06% Nigerian26 0.05% Moroccan23 0.05% Lebanese23 0.05% Hungarian20 0.04% Slovak18 0.04% West Indian17 0.03% Russian17 0.03% Greek14 0.03% Iraqi14 0.03% Luxembourger12 0.02% Barbadian11 0.02% Cypriot11 0.02% Ukrainian7 0.01% Northern European6 0.01% Czechoslovakian5 0.01% Portuguese3 0.01% Lithuanian
Geographical mobility in Atascocita Same house 1 year ago 36,982 85.4% White (Caucasian)17,349 85.3% Black or African American1,486 94.8% American Indian / Alaska Native2,748 92.2% Asian4 98.2% Native Hawaiian / Pacific Islander5,729 75.5% Other race16,264 88.5% Two or more races26,061 84.1% White alone, not Hispanic / Latino23,996 86.3% Hispanic or LatinoMoved within same county 4,409 10.2% White / Caucasian1,969 9.7% Black or African American65 4.1% American Indian / Alaska Native141 4.7% Asian1,664 21.9% Other race599 3.3% Two or more races3,028 9.8% White alone, not Hispanic / Latino2,128 7.7% Hispanic or LatinoMoved within same state 1,220 2.8% White / Caucasian304 1.5% Black or African American19 1.2% American Indian / Alaska Native4 0.1% Asian23 0.3% Other race1,289 7.0% Two or more races1,180 3.8% White alone, not Hispanic / Latino1,157 4.2% Hispanic or LatinoMoved from different state 709 1.6% White / Caucasian854 4.2% Black or African American52 1.7% Asian107 1.4% Other race93 0.5% Two or more races709 2.3% White alone, not Hispanic / Latino216 0.8% Hispanic or LatinoMoved from abroad 42 0.6% Other race145 0.8% Two or more races326 1.2% Hispanic or Latino
Children Nativity (place of birth) in Atascocita
Children under 6 years - Living with two parents Both parents native 4,016 100.0% NativeBoth parents foreign-born 478 94.3% Native29 5.7% Foreign-bornOne native, one foreign-born parent 687 100.0% NativeChildren under 6 years - Living with one parent Native parent 1,273 100.0% NativeForeign-born parent 192 100.0% NativeChildren 6 to 17 years - Living with two parents Both parents native 10,202 99.4% Native59 0.6% Foreign-bornBoth parents foreign-born 1,057 87.2% Native155 12.8% Foreign-bornOne native, one foreign-born parent 1,752 99.0% Native17 1.0% Foreign-bornChildren 6 to 17 years - Living with one parent Native parent 2,500 100.0% NativeForeign-born parent 818 51.4% Native774 48.6% Foreign-born
Grandparents responsible for own grandchildren in Atascocita
Grandparents (30 to 59 years) White / Caucasian 44 57.4% Responsible for grandchildren32 42.6% Not responsible for grandchildrenBlack or African American 230 95.9% Responsible for grandchildren10 4.1% Not responsible for grandchildrenOther race 198 67.7% Responsible for grandchildren94 32.3% Not responsible for grandchildrenWhite alone, not Hispanic / Latino 55 59.1% Responsible for grandchildren38 40.9% Not responsible for grandchildrenHispanic or Latino 162 65.8% Responsible for grandchildren84 34.2% Not responsible for grandchildrenGrandparents (60 years and over) White / Caucasian 11 5.0% Responsible for grandchildren199 95.0% Not responsible for grandchildrenBlack or African American 348 100.0% Not responsible for grandchildrenOther race 255 100.0% Not responsible for grandchildrenWhite alone, not Hispanic / Latino 15 4.8% Responsible for grandchildren290 95.2% Not responsible for grandchildrenHispanic or Latino 5 1.0% Responsible for grandchildren459 99.0% Not responsible for grandchildren