Races in Aloha, Oregon (OR) Detailed Stats
Data:
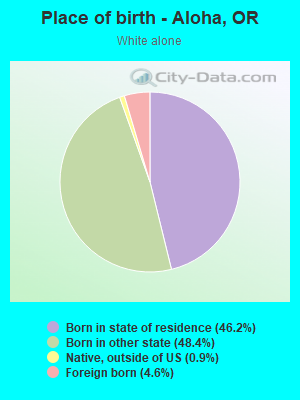
Races - White alone (%)
Races - White alone (% change since 2000)
Races - Black alone (%)
Races - Black alone (% change since 2000)
Races - American Indian alone (%)
Races - American Indian alone (% change since 2000)
Races - Asian alone (%)
Races - Asian alone (% change since 2000)
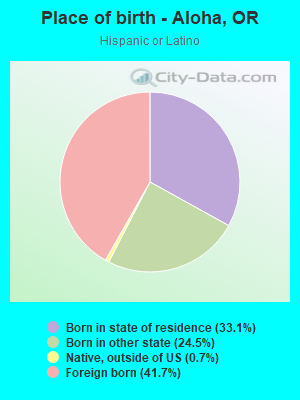
Races - Hispanic (%)
Races - Hispanic (% change since 2000)
Races - Native Hawaiian and Other Pacific Islander alone (%)
Races - Native Hawaiian and Other Pacific Islander alone (% change since 2000)
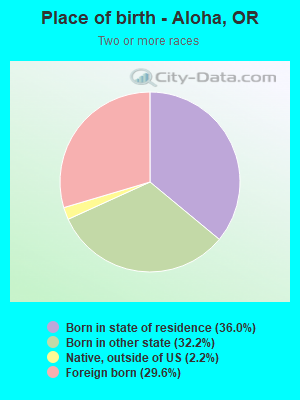
Races - Two or more races(%)
Races - Two or more races(% change since 2000)
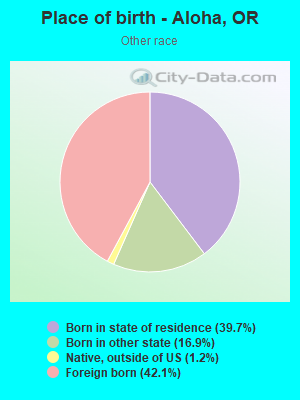
Races - Other race alone (%)
Races - Other race alone (% change since 2000)
Racial diversity
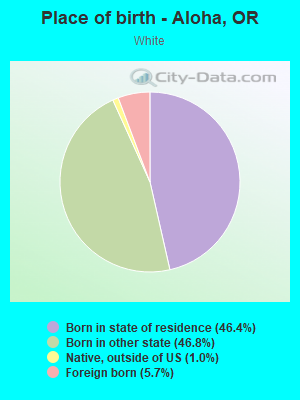
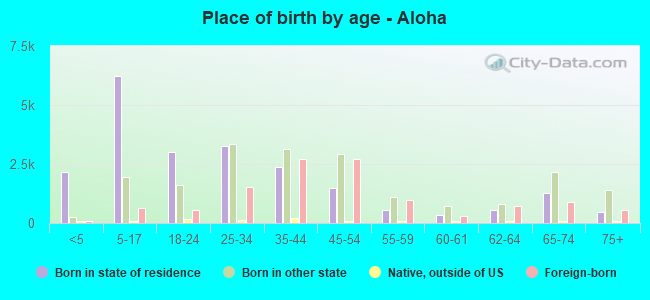
Place of birth - Born in state of residence (%)
Place of birth - Born in state of residence (%) - White
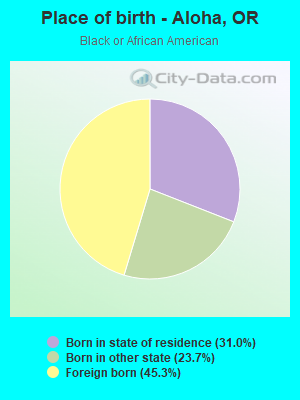
Place of birth - Born in state of residence (%) - Black or African American
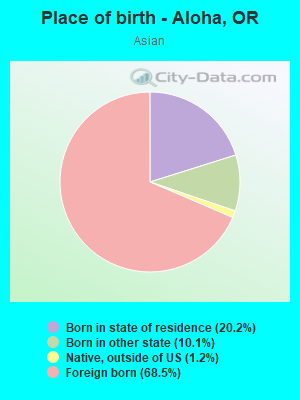
Place of birth - Born in state of residence (%) - Asian
Place of birth - Born in state of residence (%) - Hispanic or Latino
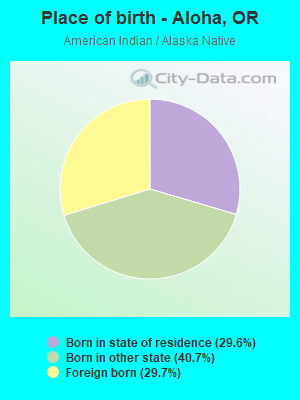
Place of birth - Born in state of residence (%) - American Indian and Alaska Native
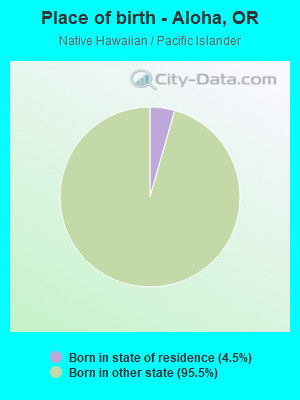
Place of birth - Born in state of residence (%) - Multirace
Place of birth - Born in state of residence (%) - Other Race
Place of birth - Born in other state (%)
Place of birth - Born in other state (%) - White
Place of birth - Born in other state (%) - Black or African American
Place of birth - Born in other state (%) - Asian
Place of birth - Born in other state (%) - Hispanic or Latino
Place of birth - Born in other state (%) - American Indian and Alaska Native
Place of birth - Born in other state (%) - Multirace
Place of birth - Born in other state (%) - Other Race
Place of birth - Native, outside of US (%)
Place of birth - Native, outside of US (%) - White
Place of birth - Native, outside of US (%) - Black or African American
Place of birth - Native, outside of US (%) - Asian
Place of birth - Native, outside of US (%) - Hispanic or Latino
Place of birth - Native, outside of US (%) - American Indian and Alaska Native
Place of birth - Native, outside of US (%) - Multirace
Place of birth - Native, outside of US (%) - Other Race
Place of birth - Foreign born (%)
Place of birth - Foreign born (%) - White
Place of birth - Foreign born (%) - Black or African American
Place of birth - Foreign born (%) - Asian
Place of birth - Foreign born (%) - Hispanic or Latino
Place of birth - Foreign born (%) - American Indian and Alaska Native
Place of birth - Foreign born (%) - Multirace
Place of birth - Foreign born (%) - Other Race
Residents speaking English at home (%)
Residents speaking English at home - Born in the United States (%)
Residents speaking English at home - Native, born elsewhere (%)
Residents speaking English at home - Foreign born (%)
Residents speaking Spanish at home (%)
Residents speaking Spanish at home - Born in the United States (%)
Residents speaking Spanish at home - Native, born elsewhere (%)
Residents speaking Spanish at home - Foreign born (%)
Residents speaking other language at home (%)
Residents speaking other language at home - Born in the United States (%)
Residents speaking other language at home - Native, born elsewhere (%)
Residents speaking other language at home - Foreign born (%)
Marital status - Never married (%)
Marital status - Now married (%)
Marital status - Separated (%)
Marital status - Widowed (%)
Marital status - Divorced (%)
Ancestries Reported - Arab (%)
Ancestries Reported - Czech (%)
Ancestries Reported - Danish (%)
Ancestries Reported - Dutch (%)
Ancestries Reported - English (%)
Ancestries Reported - French (%)
Ancestries Reported - French Canadian (%)
Ancestries Reported - German (%)
Ancestries Reported - Greek (%)
Ancestries Reported - Hungarian (%)
Ancestries Reported - Irish (%)
Ancestries Reported - Italian (%)
Ancestries Reported - Lithuanian (%)
Ancestries Reported - Norwegian (%)
Ancestries Reported - Polish (%)
Ancestries Reported - Portuguese (%)
Ancestries Reported - Russian (%)
Ancestries Reported - Scotch-Irish (%)
Ancestries Reported - Scottish (%)
Ancestries Reported - Slovak (%)
Ancestries Reported - Subsaharan African (%)
Ancestries Reported - Swedish (%)
Ancestries Reported - Swiss (%)
Ancestries Reported - Ukrainian (%)
Ancestries Reported - United States (%)
Ancestries Reported - Welsh (%)
Ancestries Reported - West Indian (%)
Ancestries Reported - Other (%)
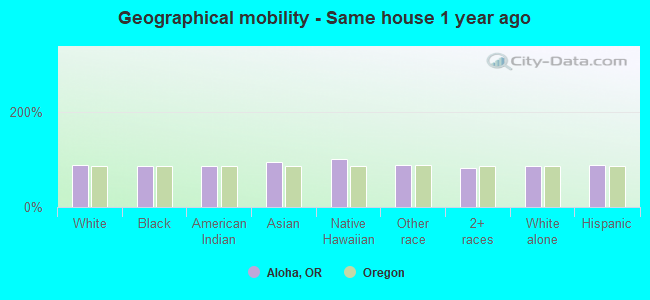
Geographical mobility - Same house 1 year ago (%)
Geographical mobility - Same house 1 year ago (%) - White
Geographical mobility - Same house 1 year ago (%) - Black or African American
Geographical mobility - Same house 1 year ago (%) - Asian
Geographical mobility - Same house 1 year ago (%) - Hispanic or Latino
Geographical mobility - Same house 1 year ago (%) - American Indian and Alaska Native
Geographical mobility - Same house 1 year ago (%) - Multirace
Geographical mobility - Same house 1 year ago (%) - Other Race
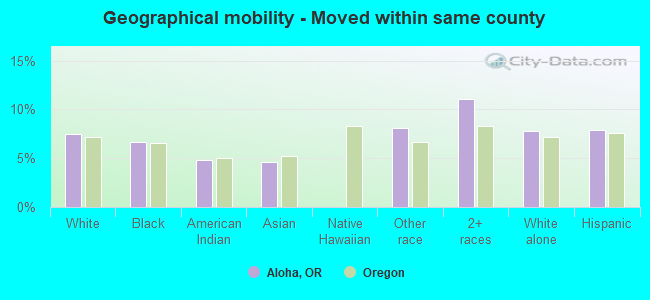
Geographical mobility - Moved within same county (%)
Geographical mobility - Moved within same county (%) - White
Geographical mobility - Moved within same county (%) - Black or African American
Geographical mobility - Moved within same county (%) - Asian
Geographical mobility - Moved within same county (%) - Hispanic or Latino
Geographical mobility - Moved within same county (%) - American Indian and Alaska Native
Geographical mobility - Moved within same county (%) - Multirace
Geographical mobility - Moved within same county (%) - Other Race
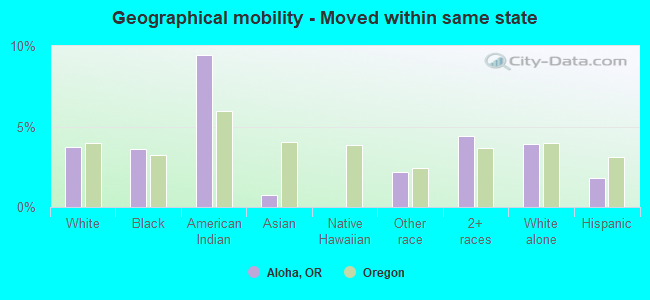
Geographical mobility - Moved from different county within same state (%)
Geographical mobility - Moved from different county within same state (%) - White
Geographical mobility - Moved from different county within same state (%) - Black or African American
Geographical mobility - Moved from different county within same state (%) - Asian
Geographical mobility - Moved from different county within same state (%) - Hispanic or Latino
Geographical mobility - Moved from different county within same state (%) - American Indian and Alaska Native
Geographical mobility - Moved from different county within same state (%) - Multirace
Geographical mobility - Moved from different county within same state (%) - Other Race
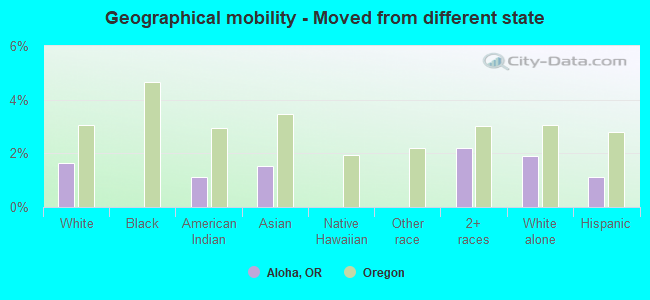
Geographical mobility - Moved from different state (%)
Geographical mobility - Moved from different state (%) - White
Geographical mobility - Moved from different state (%) - Black or African American
Geographical mobility - Moved from different state (%) - Asian
Geographical mobility - Moved from different state (%) - Hispanic or Latino
Geographical mobility - Moved from different state (%) - American Indian and Alaska Native
Geographical mobility - Moved from different state (%) - Multirace
Geographical mobility - Moved from different state (%) - Other Race
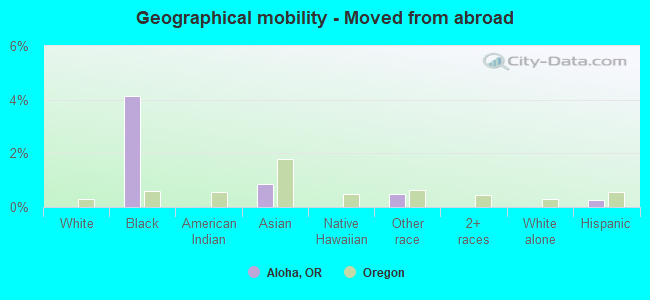
Geographical mobility - Moved from abroad (%)
Geographical mobility - Moved from abroad (%) - White
Geographical mobility - Moved from abroad (%) - Black or African American
Geographical mobility - Moved from abroad (%) - Asian
Geographical mobility - Moved from abroad (%) - Hispanic or Latino
Geographical mobility - Moved from abroad (%) - American Indian and Alaska Native
Geographical mobility - Moved from abroad (%) - Multirace
Geographical mobility - Moved from abroad (%) - Other Race
Place of birth for the foreign-born population - Ireland (%)
Place of birth for the foreign-born population - Denmark (%)
Place of birth for the foreign-born population - Norway (%)
Place of birth for the foreign-born population - Sweden (%)
Place of birth for the foreign-born population - United Kingdom (%)
Place of birth for the foreign-born population - England (%)
Place of birth for the foreign-born population - Scotland (%)
Place of birth for the foreign-born population - Other Northern Europe (%)
Place of birth for the foreign-born population - Austria (%)
Place of birth for the foreign-born population - Belgium (%)
Place of birth for the foreign-born population - France (%)
Place of birth for the foreign-born population - Germany (%)
Place of birth for the foreign-born population - Netherlands (%)
Place of birth for the foreign-born population - Switzerland (%)
Place of birth for the foreign-born population - Other Western Europe (%)
Place of birth for the foreign-born population - Greece (%)
Place of birth for the foreign-born population - Italy (%)
Place of birth for the foreign-born population - Portugal (%)
Place of birth for the foreign-born population - Spain (%)
Place of birth for the foreign-born population - Other Southern Europe (%)
Place of birth for the foreign-born population - Albania (%)
Place of birth for the foreign-born population - Belarus (%)
Place of birth for the foreign-born population - Bosnia and Herzegovina (%)
Place of birth for the foreign-born population - Bulgaria (%)
Place of birth for the foreign-born population - Croatia (%)
Place of birth for the foreign-born population - Czechoslovakia (%)
Place of birth for the foreign-born population - Hungary (%)
Place of birth for the foreign-born population - Latvia (%)
Place of birth for the foreign-born population - Lithuania (%)
Place of birth for the foreign-born population - North Macedonia (Macedonia) (%)
Place of birth for the foreign-born population - Moldova (%)
Place of birth for the foreign-born population - Poland (%)
Place of birth for the foreign-born population - Romania (%)
Place of birth for the foreign-born population - Russia (%)
Place of birth for the foreign-born population - Serbia (%)
Place of birth for the foreign-born population - Ukraine (%)
Place of birth for the foreign-born population - Other Eastern Europe (%)
Place of birth for the foreign-born population - China (%)
Place of birth for the foreign-born population - Hong Kong (%)
Place of birth for the foreign-born population - Taiwan (%)
Place of birth for the foreign-born population - Japan (%)
Place of birth for the foreign-born population - Korea (%)
Place of birth for the foreign-born population - Other Eastern Asia (%)
Place of birth for the foreign-born population - Afghanistan (%)
Place of birth for the foreign-born population - Bangladesh (%)
Place of birth for the foreign-born population - India (%)
Place of birth for the foreign-born population - Iran (%)
Place of birth for the foreign-born population - Kazakhstan (%)
Place of birth for the foreign-born population - Nepal (%)
Place of birth for the foreign-born population - Pakistan (%)
Place of birth for the foreign-born population - Sri Lanka (%)
Place of birth for the foreign-born population - Uzbekistan (%)
Place of birth for the foreign-born population - Other South Central Asia (%)
Place of birth for the foreign-born population - Burma (%)
Place of birth for the foreign-born population - Cambodia (%)
Place of birth for the foreign-born population - Indonesia (%)
Place of birth for the foreign-born population - Laos (%)
Place of birth for the foreign-born population - Malaysia (%)
Place of birth for the foreign-born population - Philippines (%)
Place of birth for the foreign-born population - Singapore (%)
Place of birth for the foreign-born population - Thailand (%)
Place of birth for the foreign-born population - Vietnam (%)
Place of birth for the foreign-born population - Other South Eastern Asia (%)
Place of birth for the foreign-born population - Armenia (%)
Place of birth for the foreign-born population - Iraq (%)
Place of birth for the foreign-born population - Israel (%)
Place of birth for the foreign-born population - Jordan (%)
Place of birth for the foreign-born population - Kuwait (%)
Place of birth for the foreign-born population - Lebanon (%)
Place of birth for the foreign-born population - Saudi Arabia (%)
Place of birth for the foreign-born population - Syria (%)
Place of birth for the foreign-born population - Turkey (%)
Place of birth for the foreign-born population - Yemen (%)
Place of birth for the foreign-born population - Other Western Asia (%)
Place of birth for the foreign-born population - Eritrea (%)
Place of birth for the foreign-born population - Ethiopia (%)
Place of birth for the foreign-born population - Kenya (%)
Place of birth for the foreign-born population - Somalia (%)
Place of birth for the foreign-born population - Uganda (%)
Place of birth for the foreign-born population - Zimbabwe (%)
Place of birth for the foreign-born population - Other Eastern Africa (%)
Place of birth for the foreign-born population - Cameroon (%)
Place of birth for the foreign-born population - Congo (%)
Place of birth for the foreign-born population - Democratic Republic of Congo (Zaire) (%)
Place of birth for the foreign-born population - Other Middle Africa (%)
Place of birth for the foreign-born population - Egypt (%)
Place of birth for the foreign-born population - Morocco (%)
Place of birth for the foreign-born population - Sudan (%)
Place of birth for the foreign-born population - Other Northern Africa (%)
Place of birth for the foreign-born population - South Africa (%)
Place of birth for the foreign-born population - Other Southern Africa (%)
Place of birth for the foreign-born population - Cabo Verde (%)
Place of birth for the foreign-born population - Ghana (%)
Place of birth for the foreign-born population - Liberia (%)
Place of birth for the foreign-born population - Nigeria (%)
Place of birth for the foreign-born population - Senegal (%)
Place of birth for the foreign-born population - Sierra Leone (%)
Place of birth for the foreign-born population - Other Western Africa (%)
Place of birth for the foreign-born population - Australia (%)
Place of birth for the foreign-born population - New Zealand (%)
Place of birth for the foreign-born population - Fiji (%)
Place of birth for the foreign-born population - Micronesia (%)
Place of birth for the foreign-born population - Bahamas (%)
Place of birth for the foreign-born population - Barbados (%)
Place of birth for the foreign-born population - Cuba (%)
Place of birth for the foreign-born population - Dominica (%)
Place of birth for the foreign-born population - Dominican Republic (%)
Place of birth for the foreign-born population - Grenada (%)
Place of birth for the foreign-born population - Haiti (%)
Place of birth for the foreign-born population - Jamaica (%)
Place of birth for the foreign-born population - St. Vincent and the Grenadines (%)
Place of birth for the foreign-born population - Trinidad and Tobago (%)
Place of birth for the foreign-born population - West Indies (%)
Place of birth for the foreign-born population - Other Caribbean (%)
Place of birth for the foreign-born population - Belize (%)
Place of birth for the foreign-born population - Costa Rica (%)
Place of birth for the foreign-born population - El Salvador (%)
Place of birth for the foreign-born population - Guatemala (%)
Place of birth for the foreign-born population - Honduras (%)
Place of birth for the foreign-born population - Mexico (%)
Place of birth for the foreign-born population - Nicaragua (%)
Place of birth for the foreign-born population - Panama (%)
Place of birth for the foreign-born population - Other Central America (%)
Place of birth for the foreign-born population - Argentina (%)
Place of birth for the foreign-born population - Bolivia (%)
Place of birth for the foreign-born population - Brazil (%)
Place of birth for the foreign-born population - Chile (%)
Place of birth for the foreign-born population - Colombia (%)
Place of birth for the foreign-born population - Ecuador (%)
Place of birth for the foreign-born population - Guyana (%)
Place of birth for the foreign-born population - Peru (%)
Place of birth for the foreign-born population - Uruguay (%)
Place of birth for the foreign-born population - Venezuela (%)
Place of birth for the foreign-born population - Other South America (%)
Place of birth for the foreign-born population - Canada (%)
Place of birth for the foreign-born population - Other Northern America (%)
Place of birth for the foreign-born population - Other (%)
Latest news about races in Aloha, OR collected exclusively by city-data.com from local newspapers, TV, and radio stations
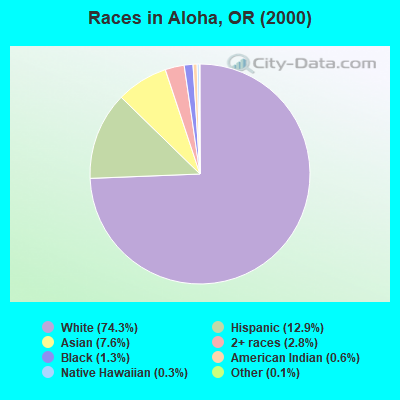
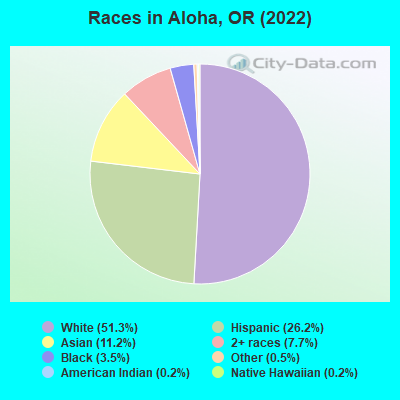
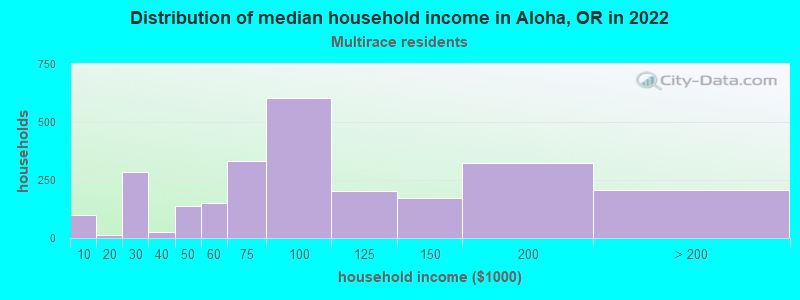
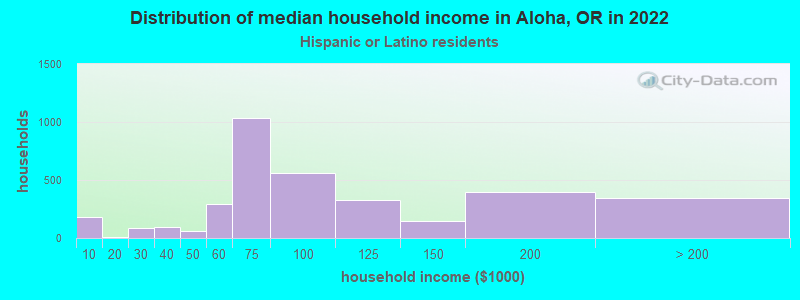
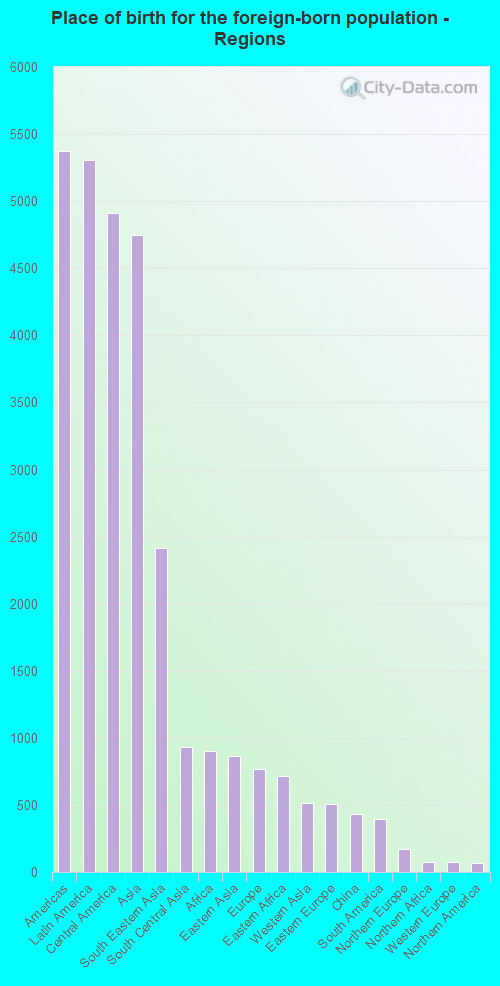
According to 2022 data, the most numerous races in Aloha, OR are White alone (27,505 residents), Hispanic (14,065 residents), and Two or more races (4,101 residents). 66.8% of Aloha residents speak English at home. 22.1% of Aloha, OR residents are foreign-born (9.7% born in Latin America, 8.7% born in Asia), which is 59.2% greater than the foreign-born rate of 9.0% across the entire state of Oregon.
Race distribution in Aloha
2000 2022
2,857,616 83.5% White alone 275,314 8.0% Hispanic 100,333 2.9% Asian alone 82,733 2.4% Two or more races 53,325 1.6% Black alone 40,130 1.2% American Indian alone 7,398 0.2% Native Hawaiian and Other 4,550 0.1% Other race alone
3,037,571 71.6% White alone 609,538 14.4% Hispanic 252,744 6.0% Two or more races 191,283 4.5% Asian alone 78,228 1.8% Black alone 29,399 0.7% American Indian alone 25,731 0.6% Other race alone 15,643 0.4% Native Hawaiian and Other
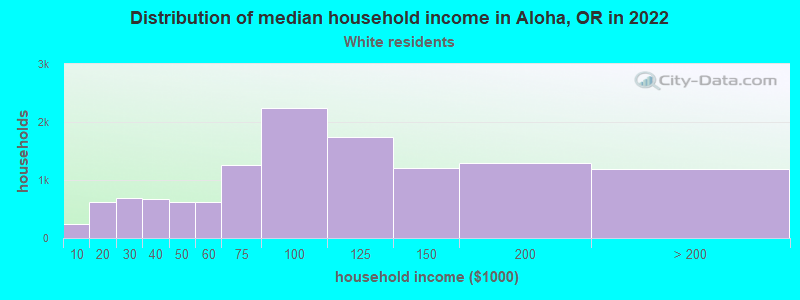
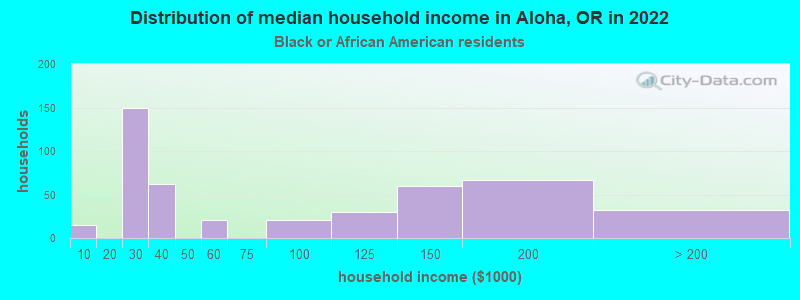
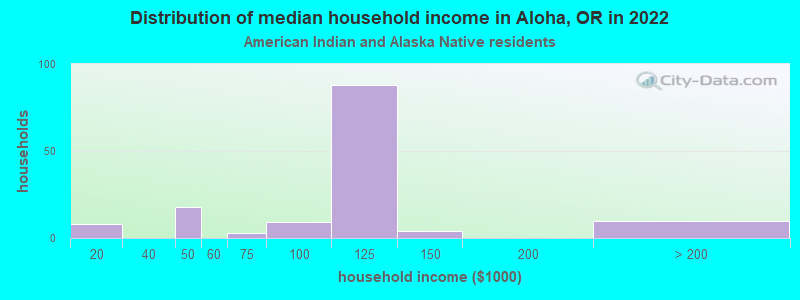
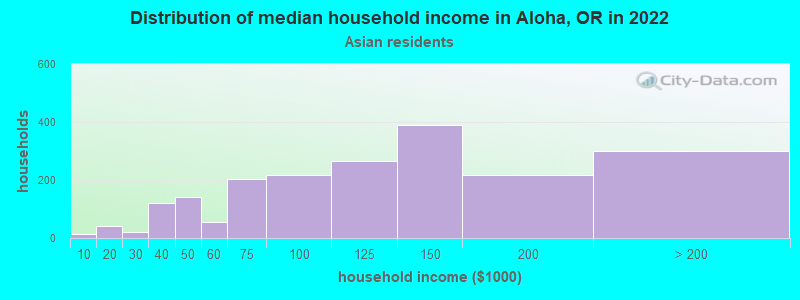
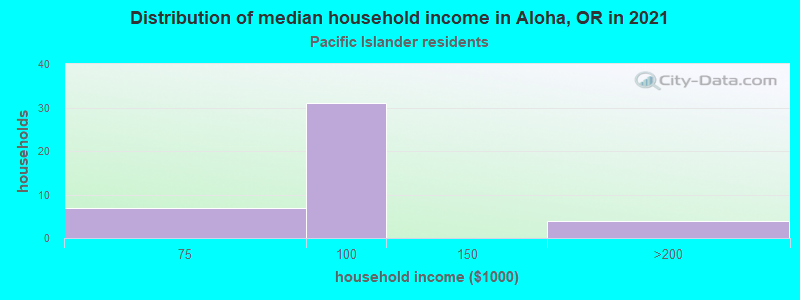
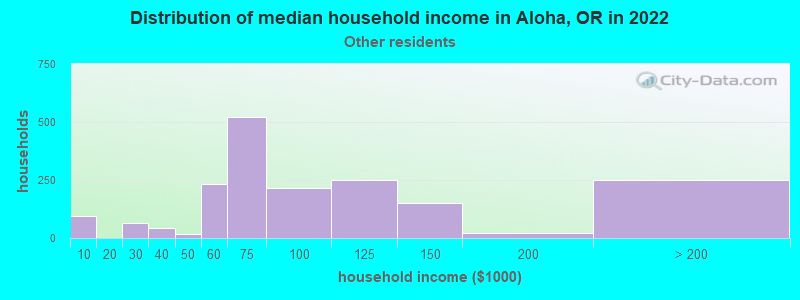
Income and house value in Aloha Median household income in 2022 $91,346 White non-Hispanic householders$50,186 Black householders$99,643 American Indian and Alaska Native householders$116,143 Asian householders$78,565 Some other race householders$83,776 Two or more races householders$79,316 Hispanic or Latino race householdersMedian 2022 house value $507,490 White Non-Hispanic householders$572,678 Black or African American householders$537,477 American Indian or Alaska Native householders $526,069 Asian householders$514,987 Some other race householders$502,275 Two or more races householders$483,044 Hispanic or Latino householders
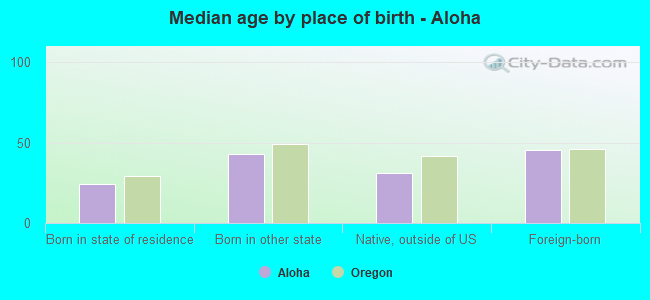
Median age by race in Aloha
40.8 Median age for White residents40.3 41.1 28.3 Median age for Black or African American residents27.7 28.0 39.2 Median age for American Indian / Alaska Native residents54.3 29.1 41.1 Median age for Asian residents37.1 43.0 57.9 Median age for Native Hawaiian / Pacific Islander residents43.6 75.7 30.0 Median age for Other race residents28.9 30.0 24.8 Median age for Two or more races residents27.7 22.4 41.8 Median age for White alone residents41.7 41.6 28.9 Median age for Hispanic or Latino residents30.0 27.2
Owner/renter occupied households by race in Aloha
House owners and renters - White residents 8,701 69.8% Owner occupied3,765 30.2% Renter occupiedHouse owners and renters - Black or African American residents 147 31.5% Owner occupied320 68.5% Renter occupiedHouse owners and renters - American Indian / Alaska Native residents 66 55.6% Owner occupied53 44.4% Renter occupiedHouse owners and renters - Asian residents 1,756 87.4% Owner occupied254 12.6% Renter occupiedHouse owners and renters - Native Hawaiian / Pacific Islander residents 48 100.0% Owner occupiedHouse owners and renters - Other race residents 762 42.3% Owner occupied1,039 57.7% Renter occupiedHouse owners and renters - Two or more races residents 1,350 53.7% Owner occupied1,163 46.3% Renter occupiedHouse owners and renters - White alone residents 8,460 70.5% Owner occupied3,546 29.5% Renter occupiedHouse owners and renters - Hispanic or Latino residents 1,737 51.6% Owner occupied1,632 48.4% Renter occupied
Language usage in Aloha
English speakers - Total 66.8% of residents of Aloha speak English at home.
19.9% of residents speak Spanish at home 7,114 70.1% Speak English very well3,040 29.9% Speak English less than very well13.9% of residents speak other language at home 4,078 57.4% Speak English very well3,025 42.6% Speak English less than very well
English speakers - Born in the United States 86.6% of residents of Aloha speak English at home.
10.8% of residents speak Spanish at home 1,906 91.5% Speak English very well178 8.5% Speak English less than very well3.2% of residents speak other language at home 568 91.3% Speak English very well54 8.7% Speak English less than very well
English speakers - Native, born elsewhere 78.1% of residents of Aloha speak English at home.
8.3% of residents speak Spanish at home 32 60.4% Speak English very well21 39.6% Speak English less than very well6.4% of residents speak other language at home 35 85.4% Speak English very well6 14.6% Speak English less than very well
English speakers - Foreign-born 10.4% of residents of Aloha speak English at home.
45.9% of residents speak Spanish at home 2,665 49.7% Speak English very well2,692 50.3% Speak English less than very well45.8% of residents speak other language at home 2,651 49.6% Speak English very well2,690 50.4% Speak English less than very well
White (Caucasian) - Speak only English Native:
94.7% (25,642)Foreign-born:
36.3% (628)
White (Caucasian) - Speak another language Native:
5.3% (1,433)Foreign-born:
65.0% (1,123)
Black or African American - Speak only English Native:
82.8% (872)Foreign-born:
5.9% (49)
Black or African American - Speak another language Native:
17.0% (179)Foreign-born:
97.5% (799)
American Indian / Alaska Native - Speak only English Native:
87.9% (191)Foreign-born:
11.1% (10)
American Indian / Alaska Native - Speak another language Native:
15.8% (34)Foreign-born:
100.0% (90)
Asian - Speak only English Native:
54.0% (884)Foreign-born:
8.6% (356)
Asian - Speak another language Native:
45.6% (746)Foreign-born:
92.1% (3,809)
Other race - Speak only English Native:
15.8% (533)Foreign-born:
3.0% (83)
Other race - Speak another language Native:
85.5% (2,893)Foreign-born:
97.5% (2,739)
Two or more races - Speak only English Native:
75.5% (4,975)Foreign-born:
1.9% (58)
Two or more races - Speak another language Native:
24.9% (1,638)Foreign-born:
98.3% (2,964)
White alone - Speak only English Native:
97.5% (24,729)Foreign-born:
27.6% (351)
White alone - Speak another language Native:
2.2% (567)Foreign-born:
72.3% (920)
Hispanic or Latino - Speak only English Native:
39.1% (2,907)Foreign-born:
8.1% (476)
Hispanic or Latino - Speak another language Native:
61.8% (4,591)Foreign-born:
91.4% (5,385)
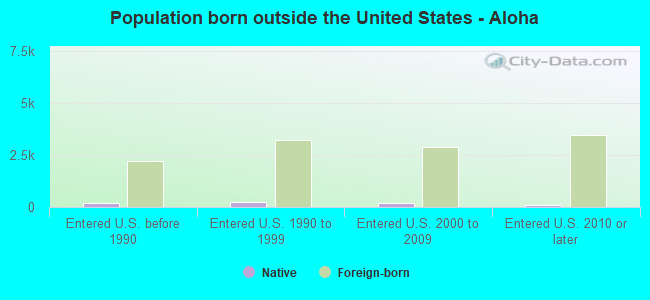
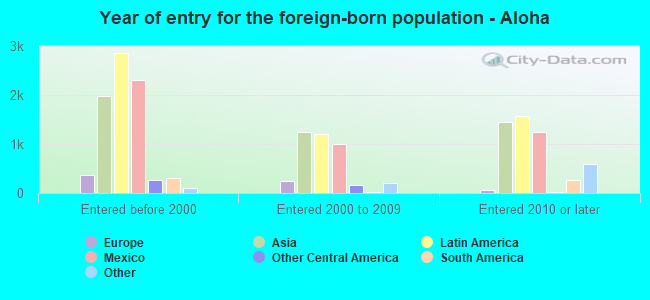
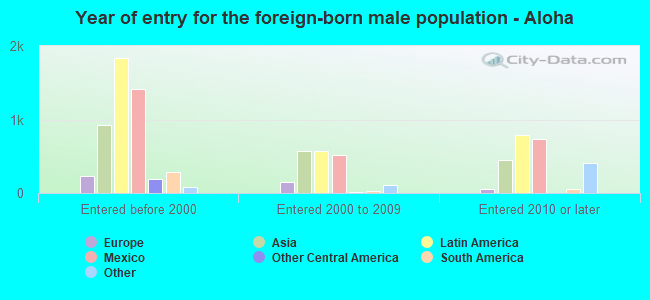
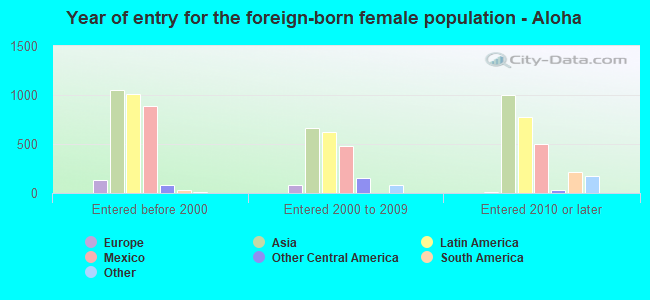
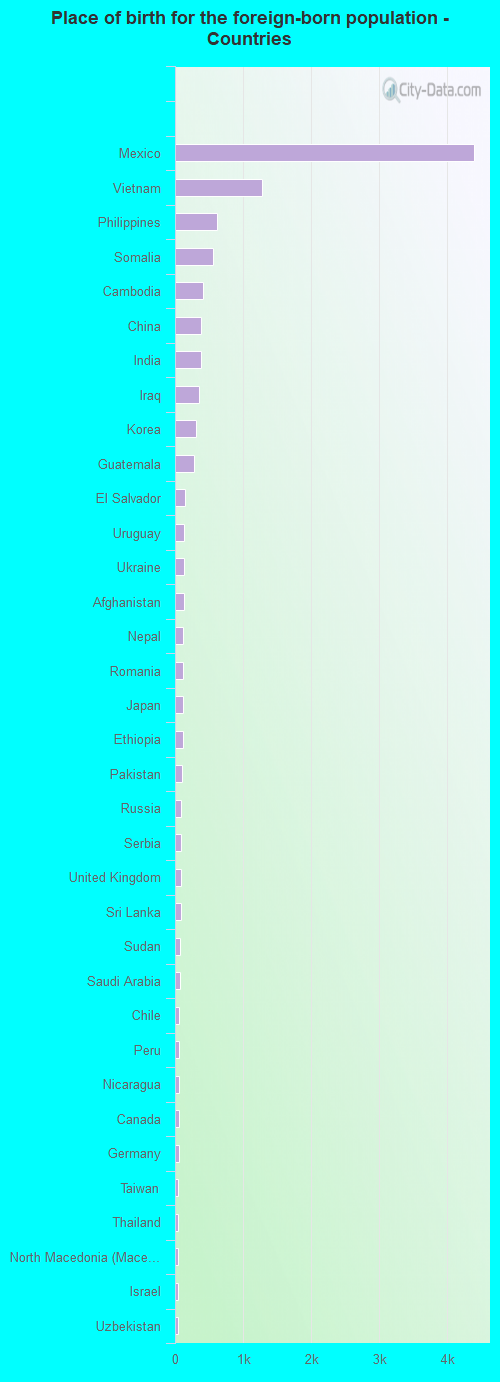
Foreign-born residents in Aloha 11,829 residents are foreign born (9.7% Latin America , 8.7% Asia ).
This city:
22.1%Oregon:
9.8%
Marital status for residents in Aloha Marital status - White (Caucasian) population 15 years and over
Males 31.7% Never married54.4% Now married0.6% Separated3.4% Widowed9.9% DivorcedFemales 27.4% Never married50.6% Now married1.1% Separated7.9% Widowed13.0% DivorcedWomen who gave birth in the past 12 months Now married:
57.0% (185)Unmarried:
43.0% (139)
Women who did not give birth in the past 12 months Now married:
49.6% (3,531)Unmarried:
50.4% (3,589)
Marital status - Black or African American population 15 years and over
Males 50.4% Never married44.8% Now married0.0% Separated1.4% Widowed3.4% DivorcedFemales 40.7% Never married48.2% Now married0.0% Separated1.2% Widowed9.8% DivorcedWomen who did not give birth in the past 12 months Now married:
36.9% (170)Unmarried:
63.1% (291)
Marital status - American Indian / Alaska Native population 15 years and over
Males 23.9% Never married65.7% Now married0.0% Separated0.0% Widowed10.3% DivorcedFemales 52.1% Never married24.8% Now married9.9% Separated0.0% Widowed13.2% DivorcedWomen who did not give birth in the past 12 months Now married:
27.8% (33)Unmarried:
72.2% (85)
Marital status - Asian population 15 years and over
Males 42.1% Never married53.3% Now married0.0% Separated0.4% Widowed4.3% DivorcedFemales 19.2% Never married61.4% Now married1.6% Separated9.3% Widowed8.6% DivorcedWomen who gave birth in the past 12 months Now married:
100.0% (133)Unmarried:
0.0% (0)
Women who did not give birth in the past 12 months Now married:
57.9% (895)Unmarried:
42.1% (651)
Marital status - Native Hawaiian / Pacific Islander population 15 years and over
Males 72.4% Never married27.6% Now married0.0% Separated0.0% Widowed0.0% DivorcedFemales 17.8% Never married82.2% Now married0.0% Separated0.0% Widowed0.0% DivorcedWomen who did not give birth in the past 12 months Now married:
42.9% (6)Unmarried:
57.1% (8)
Marital status - Other race population 15 years and over
Males 51.4% Never married42.3% Now married0.0% Separated0.3% Widowed6.0% DivorcedFemales 42.0% Never married47.5% Now married5.1% Separated0.7% Widowed4.7% DivorcedWomen who did not give birth in the past 12 months Now married:
47.1% (955)Unmarried:
52.9% (1,072)
Marital status - Two or more races population 15 years and over
Males 48.3% Never married38.5% Now married0.0% Separated2.9% Widowed10.4% DivorcedFemales 48.4% Never married41.3% Now married0.5% Separated5.2% Widowed4.7% DivorcedWomen who gave birth in the past 12 months Now married:
100.0% (29)Unmarried:
0.0% (0)
Women who did not give birth in the past 12 months Now married:
37.9% (985)Unmarried:
62.1% (1,612)
Marital status - White alone, not Hispanic / Latino population 15 years and over
Males 30.1% Never married55.3% Now married0.7% Separated3.4% Widowed10.6% DivorcedFemales 27.3% Never married49.7% Now married1.2% Separated8.3% Widowed13.6% DivorcedWomen who gave birth in the past 12 months Now married:
51.4% (156)Unmarried:
48.6% (147)
Women who did not give birth in the past 12 months Now married:
49.9% (3,413)Unmarried:
50.1% (3,432)
Marital status - Hispanic or Latino population 15 years and over
Males 50.7% Never married42.5% Now married0.0% Separated2.3% Widowed4.5% DivorcedFemales 41.9% Never married50.6% Now married0.5% Separated2.7% Widowed4.3% DivorcedWomen who gave birth in the past 12 months Now married:
100.0% (42)Unmarried:
0.0% (0)
Women who did not give birth in the past 12 months Now married:
43.6% (1,552)Unmarried:
56.4% (2,009)
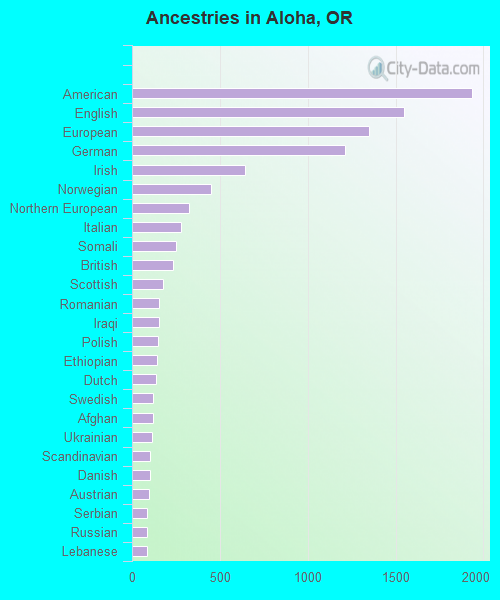
Ancestries in Aloha
1,935 7.1% American1,547 5.7% English1,348 5.0% European1,212 4.5% German645 2.4% Irish447 1.7% Norwegian322 1.2% Northern European277 1.0% Italian250 0.9% Somali231 0.9% British175 0.6% Scottish155 0.6% Romanian154 0.6% Iraqi147 0.5% Polish141 0.5% Ethiopian134 0.5% Dutch122 0.5% Swedish117 0.4% Afghan115 0.4% Ukrainian105 0.4% Scandinavian103 0.4% Danish94 0.3% Austrian88 0.3% Serbian87 0.3% Russian85 0.3% Lebanese85 0.3% Palestinian77 0.3% Scotch-Irish70 0.3% African65 0.2% French53 0.2% Eastern European52 0.2% Hungarian52 0.2% French Canadian50 0.2% Slavic40 0.1% Armenian40 0.1% Nigerian34 0.1% Israeli34 0.1% Liberian21 0.08% Swiss20 0.07% Finnish19 0.07% Welsh18 0.07% Basque18 0.07% Canadian18 0.07% Turkish16 0.06% Croatian15 0.06% Greek12 0.04% Iranian10 0.04% Macedonian9 0.03% New Zealander8 0.03% Assyrian8 0.03% Celtic8 0.03% South African8 0.03% Bulgarian6 0.02% Belgian6 0.02% Czech6 0.02% Pennsylvania German5 0.02% Slovak4 0.01% Brazilian
Geographical mobility in Aloha Same house 1 year ago 25,595 86.7% White (Caucasian)1,637 85.5% Black or African American340 85.4% American Indian / Alaska Native5,671 93.8% Asian150 100.0% Native Hawaiian / Pacific Islander5,714 89.0% Other race8,012 80.7% Two or more races23,355 85.9% White alone, not Hispanic / Latino12,351 88.2% Hispanic or LatinoMoved within same county 2,218 7.5% White / Caucasian127 6.6% Black or African American19 4.8% American Indian / Alaska Native279 4.6% Asian518 8.1% Other race1,099 11.1% Two or more races2,130 7.8% White alone, not Hispanic / Latino1,101 7.9% Hispanic or LatinoMoved within same state 1,097 3.7% White / Caucasian69 3.6% Black or African American38 9.4% American Indian / Alaska Native45 0.7% Asian139 2.2% Other race439 4.4% Two or more races1,064 3.9% White alone, not Hispanic / Latino250 1.8% Hispanic or LatinoMoved from different state 487 1.6% White / Caucasian4 1.1% American Indian / Alaska Native92 1.5% Asian217 2.2% Two or more races519 1.9% White alone, not Hispanic / Latino159 1.1% Hispanic or LatinoMoved from abroad 79 4.1% Black or African American52 0.9% Asian31 0.5% Other race35 0.2% Hispanic or Latino
Children Nativity (place of birth) in Aloha
Children under 6 years - Living with two parents Both parents native 1,203 100.0% NativeBoth parents foreign-born 415 77.8% Native118 22.2% Foreign-bornOne native, one foreign-born parent 468 100.0% NativeChildren under 6 years - Living with one parent Native parent 626 100.0% NativeForeign-born parent 65 76.7% Native20 23.3% Foreign-bornChildren 6 to 17 years - Living with two parents Both parents native 2,470 99.6% Native9 0.4% Foreign-bornBoth parents foreign-born 1,748 81.1% Native406 18.9% Foreign-bornOne native, one foreign-born parent 656 100.0% NativeChildren 6 to 17 years - Living with one parent Native parent 1,898 100.0% NativeForeign-born parent 604 62.4% Native365 37.6% Foreign-born
Grandparents responsible for own grandchildren in Aloha
Grandparents (30 to 59 years) White / Caucasian 44 20.3% Responsible for grandchildren174 79.7% Not responsible for grandchildrenBlack or African American 78 100.0% Responsible for grandchildrenAmerican Indian / Alaska Native 4 100.0% Responsible for grandchildrenAsian 8 42.6% Responsible for grandchildren10 57.4% Not responsible for grandchildrenOther race 50 100.0% Not responsible for grandchildrenTwo or more races 29 100.0% Responsible for grandchildrenWhite alone, not Hispanic / Latino 46 25.2% Responsible for grandchildren137 74.8% Not responsible for grandchildrenHispanic or Latino 102 100.0% Not responsible for grandchildrenGrandparents (60 years and over) White / Caucasian 147 17.2% Responsible for grandchildren707 82.8% Not responsible for grandchildrenAmerican Indian / Alaska Native 1 100.0% Not responsible for grandchildrenAsian 49 13.8% Responsible for grandchildren308 86.2% Not responsible for grandchildrenOther race 55 100.0% Not responsible for grandchildrenTwo or more races 84 100.0% Not responsible for grandchildrenWhite alone, not Hispanic / Latino 154 28.6% Responsible for grandchildren383 71.4% Not responsible for grandchildrenHispanic or Latino 533 100.0% Not responsible for grandchildren