West End Historic District neighborhood in Dallas, Texas (TX), 75202, 75207 detailed profile
Settings
X


Business Search - 14 Million verified businesses
Area: 0.372 square miles
Population: 2,912
Population density:
| West End Historic District: | 7,824 people per square mile |
| Dallas: | 3,794 people per square mile |

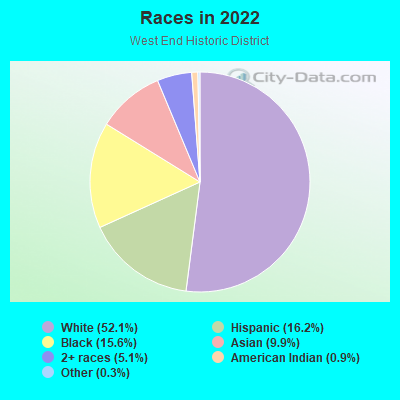
- 1,51652.1%White
- 47116.2%Hispanic or Latino
- 45315.6%Black
- 2879.9%Asian
- 1475.1%Two or more races
- 270.9%American Indian
- 80.3%Some other race
Median household income in 2022:
| West End Historic District: | $98,491 |
| Dallas: | $65,400 |
Distribution of median household income
![Distribution of median household income]()
- 138Less than $10,000
- 77$10,000 to $19,999
- 72$20,000 to $29,999
- 99$30,000 to $39,999
- 26$40,000 to $49,999
- 68$50,000 to $59,999
- 147$60,000 to $74,999
- 419$75,000 to $99,999
- 298$100,000 to $124,999
- 124$125,000 to $149,999
- 164$150,000 to $199,999
- 390$200,000 or more

Distribution of owner-occupied house/condo value
![Distribution of owner-occupied house/condo value]()
- 9Less than $50,000
- 57$1,000,000 or more

Distribution of rent paid by renters
![Distribution of rent paid by renters]()
- 33Less than $100
- 22$200 to $299
- 19$300 to $399
- 25$700 to $799
- 28$800 to $899
- 9$900 to $999
- 71$1,000 to $1,249
- 161$1,250 to $1,499
- 852$1,500 to $1,999
- 734$2,000 or more

Median rent in 2022:
| West End Historic District: | $1,858 |
| Dallas: | $1,208 |
| Males: | 1,652 |
| Females: | 1,259 |
Males:
| This neighborhood: | 32.8 years |
| Whole city: | 32.8 years |
| This neighborhood: | 33.9 years |
| Whole city: | 33.4 years |
Average household size:
| West End Historic District: | 1.4 people |
| Dallas: | 2.4 people |
Percentage of family households:
| West End Historic District: | 24.1% |
| Dallas: | 42.6% |
| Here: | 21.1% |
| Dallas: | 33.8% |
Percentage of married-couple families with children (among all households):
| West End Historic District: | 25.7% |
| Dallas: | 24.8% |
Percentage of single-mother households (among all households):
| West End Historic District: | 24.3% |
| Dallas: | 13.3% |
Percentage of never married males 15 years old and over:
Percentage of never married females 15 years old and over:
| West End Historic District: | 33.5% |
| Dallas: | 22.1% |
Percentage of never married females 15 years old and over:
| West End Historic District: | 23.6% |
| city: | 21.8% |
Percentage of people that speak English not well or not at all:
| West End Historic District: | 0.1% |
| Dallas: | 10.7% |
Percentage of people born in this state:
Percentage of people born in another U.S. state:
Percentage of native residents but born outside the U.S.:
Percentage of foreign born residents:
| Here: | 41.9% |
| Dallas: | 52.8% |
Percentage of people born in another U.S. state:
| West End Historic District: | 42.9% |
| Dallas: | 22.0% |
Percentage of native residents but born outside the U.S.:
| Here: | 2.0% |
| city: | 1.3% |
Percentage of foreign born residents:
| Here: | 13.2% |
| Dallas: | 23.9% |
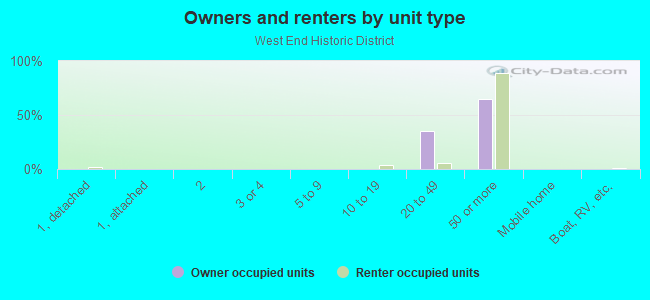
Owner-occupied
Renter-occupied

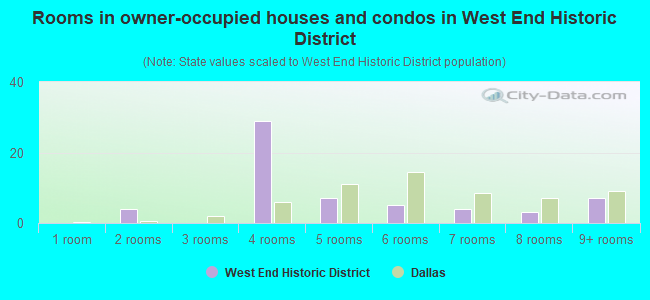
- Rooms in owner-occupied houses and condos in West End Historic District
- 01 room
- 42 rooms
- 03 rooms
- 294 rooms
- 75 rooms
- 56 rooms
- 47 rooms
- 38 rooms
- 79+ rooms
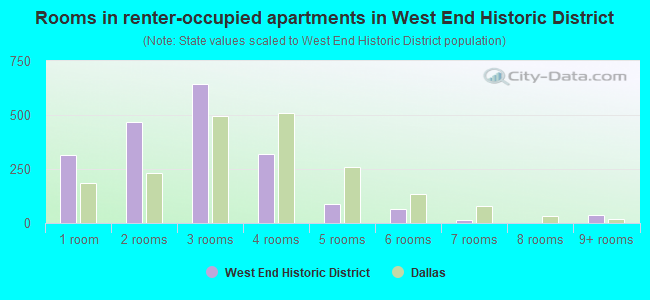
- Rooms in renter-occupied apartments in West End Historic District
- 3141 room
- 4662 rooms
- 6433 rooms
- 3184 rooms
- 885 rooms
- 656 rooms
- 147 rooms
- 08 rooms
- 379+ rooms
Owner-occupied
Renter-occupied
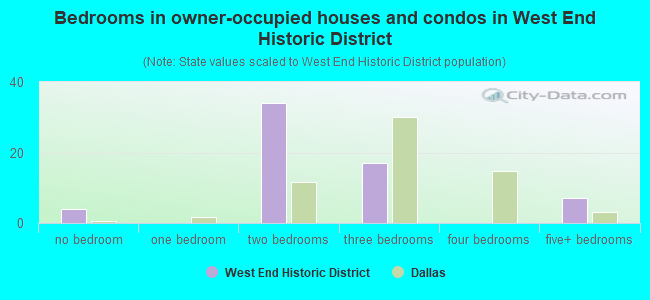
- Bedrooms in owner-occupied houses and condos in West End Historic District
- 4no bedroom
- 01 bedroom
- 342 bedrooms
- 173 bedrooms
- 04 bedrooms
- 75+ bedrooms
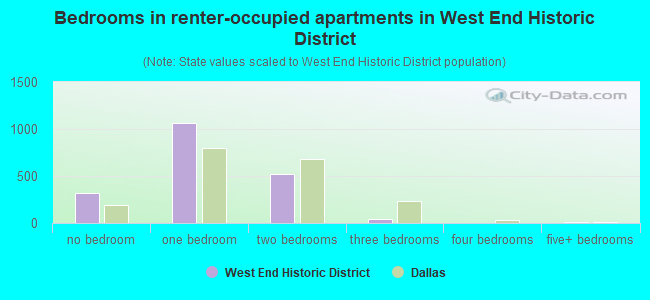
- Bedrooms in renter-occupied apartments in West End Historic District
- 314no bedroom
- 1,0681 bedroom
- 5162 bedrooms
- 383 bedrooms
- 04 bedrooms
- 125+ bedrooms
Average number of cars or other vehicles available in houses/condos:
Average number of cars or other vehicles available in apartments:
| This neighborhood: | 1.6 |
| Dallas: | 2.1 |
Average number of cars or other vehicles available in apartments:
| Here: | 1.1 |
| city: | 1.3 |
Percentage of units with a mortgage:
| West End Historic District: | 40.9% |
| Dallas: | 53.9% |
Average estimated '22 value of housing units in 5-or-more-unit structures (89.0% of all units):
| West End Historic District: | $3,142,962 |
| Dallas: | $398,482 |
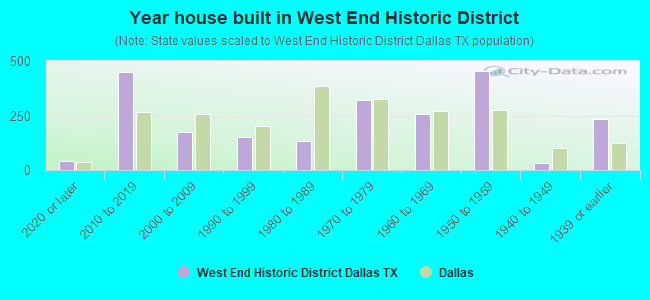
- Year house built in West End Historic District
- 412020 or later
- 4492010 to 2019
- 1752000 to 2009
- 1501990 to 1999
- 1341980 to 1989
- 3201970 to 1979
- 2591960 to 1969
- 4531950 to 1959
- 301940 to 1949
- 2341939 or earlier
City-data.com crime index for city in 2020 (higher means more crime):
| City: | 439.5 |
| U.S. average: | 219.5 |
Travel time to work (commute)
![Travel time to work (commute)]()
- 70Less than 5 minutes
- 1855 to 9 minutes
- 13010 to 14 minutes
- 14215 to 19 minutes
- 12120 to 24 minutes
- 4225 to 29 minutes
- 15130 to 34 minutes
- 4735 to 39 minutes
- 840 to 44 minutes
- 13445 to 59 minutes
- 1360 to 89 minutes
- 490 or more minutes

Means of transportation to work
![Means of transportation to work]()
- 38.6%930Drove a car alone
- 2.8%68Carpooled
- 0.6%14Bus
- 0.9%21Subway or elevated rail
- 1.0%24Long-distance train or commuter rail
- 6.2%149Light rail, streetcar or trolley
- 22.7%548Walked
- 2.3%55Other means
- 24.7%597Worked at home

Time leaving home to go to work
![Time leaving home to go to work]()
- 1012:00 a.m. to 4:59 a.m.
- 165:00 a.m. to 5:29 a.m.
- 45:30 a.m. to 5:59 a.m.
- 136:00 a.m. to 6:29 a.m.
- 836:30 a.m. to 6:59 a.m.
- 1237:00 a.m. to 7:29 a.m.
- 1437:30 a.m. to 7:59 a.m.
- 1418:00 a.m. to 8:29 a.m.
- 1708:30 a.m. to 8:59 a.m.
- 1529:00 a.m. to 9:59 a.m.
- 2610:00 a.m. to 10:59 a.m.
- 3111:00 a.m. to 11:59 a.m.
- 4612:00 p.m. to 3:59 p.m.
- 284:00 p.m. to 11:59 p.m.

Occupations of males:
- Percentage of males in management occupations (except farmers):
Here: 29.5% city: 10.9%
- Percentage of males in business and financial operations occupations:
Here: 21.4% city: 7.3%
- Percentage of males in computer and mathematical occupations:
Here: 7.4% city: 4.7%
- Percentage of males in architecture and engineering occupations:
Here: 2.9% city: 2.8%
- Percentage of males in legal occupations:
Here: 3.6% city: 1.8%
- Percentage of males in education, training, and library occupations:
Here: 1.6% city: 2.3%
- Percentage of males in arts, design, entertainment, sports, and media occupations:
Here: 4.4% city: 2.2%
- Percentage of males in healthcare practitioners and technical occupations:
Here: 3.3% city: 2.7%
- Percentage of males in service occupations:
Here: 5.1% city: 12.3%
- Percentage of males in sales and office occupations:
Here: 12.6% city: 14.9%
- Percentage of males in construction, extraction, and maintenance occupations:
Here: 2.5% city: 15.2%
- Percentage of males in production occupations:
Here: 2.0% city: 5.0%
- Percentage of males in material moving occupations:
Here: 1.2% city: 6.2%
Occupations of females:
- Percentage of females in management occupations (except farmers):
Here: 20.3% city: 9.6%
- Percentage of females in business and financial operations occupations:
Here: 18.6% city: 8.4%
- Percentage of females in computer and mathematical occupations:
Here: 5.5% city: 2.0%
- Percentage of females in community and social services occupations:
Here: 1.6% city: 1.8%
- Percentage of females in legal occupations:
Here: 3.0% city: 1.8%
- Percentage of females in education, training, and library occupations:
Here: 5.1% city: 7.1%
- Percentage of females in arts, design, entertainment, sports, and media occupations:
Here: 4.1% city: 2.9%
- Percentage of females in healthcare practitioners and technical occupations:
Here: 6.0% city: 7.7%
- Percentage of females in service occupations:
Here: 11.9% city: 20.5%
- Percentage of females in sales and office occupations:
Here: 24.0% city: 27.7%
Education in this neighborhood (subdivision or community):
- Percentage of people 3 years and older in K-12 schools:
West End Historic District: 2.5% Dallas: 17.3%
- Percentage of people 3 years and older in undergraduate colleges:
West End Historic District: 6.6% Dallas: 4.1%
- Percentage of people 3 years and older in grad. or professional schools:
West End Historic District: 2.4% Dallas: 1.7%
- Percentage of students K-12 enrolled in private schools:
West End Historic District: 14.1% Dallas: 10.8%
Percentage of population below poverty level:
| West End Historic District: | 10.2% |
| Dallas: | 17.8% |
Median year owner moved in (as recorded in 2022):
Median year renter moved in (as recorded in 2022):
| West End Historic District: | 2018 |
| Dallas: | 2010 |
Median year renter moved in (as recorded in 2022):
| West End Historic District: | 2018 |
| Dallas: | 2020 |
Percentage of married-couple families with both working:
| West End Historic District: | 100.0% |
| Dallas: | 58.3% |
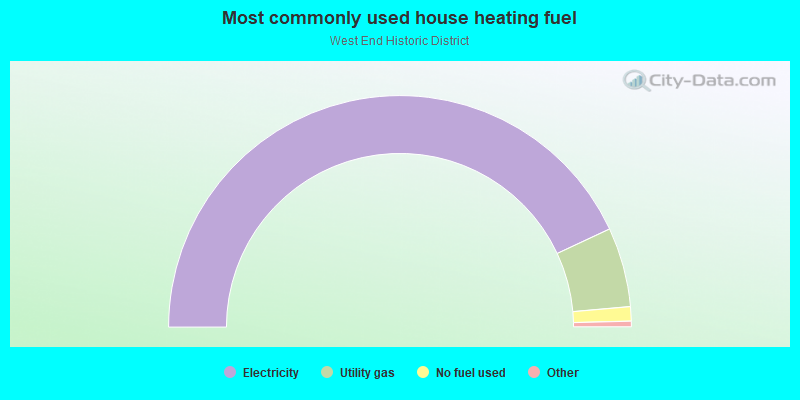
- 86.1%Electricity
- 11.1%Utility gas
- 2.0%No fuel used
Limited-access highways (interstate or state) in this neighborhood:
I- 35 (US Hwy 77, S Stemmons Fwy)
Length: 1.09 miles
Direction: N-S
Direction: N-S
Roads and streets:
Woodall Rodgers Fwy
Length: 0.97 miles
Directions: E-W, SW-NE
Address range: 400 to 1199
Directions: E-W, SW-NE
Address range: 400 to 1199
Commerce Street Viaduct (Commerce St)
Length: 0.89 miles
Directions: E-W, SE-NW, SW-NE
Address range: 274 to 1109
Directions: E-W, SE-NW, SW-NE
Address range: 274 to 1109
Ross Ave
Length: 0.57 miles
Directions: E-W, N-S, SW-NE
Address range: 500 to 1299
Directions: E-W, N-S, SW-NE
Address range: 500 to 1299
Elm St
Length: 0.53 miles
Directions: E-W, SW-NE
Address range: 400 to 1115
Directions: E-W, SW-NE
Address range: 400 to 1115
N Lamar St
Length: 0.52 miles
Directions: N-S, SE-NW
Address range: 100 to 2299
Directions: N-S, SE-NW
Address range: 100 to 2299
Main St
Length: 0.52 miles
Direction: E-W
Address range: 300 to 1109
Direction: E-W
Address range: 300 to 1109
N Griffin St
Length: 0.44 miles
Directions: N-S, SE-NW
Address range: 100 to 2199
Directions: N-S, SE-NW
Address range: 100 to 2199
Continental Ave
Length: 0.44 miles
Direction: E-W
Address range: 250 to 799
Direction: E-W
Address range: 250 to 799
N Record St
Length: 0.38 miles
Directions: N-S, SW-NE
Address range: 100 to 1999
Directions: N-S, SW-NE
Address range: 100 to 1999
Pacific Ave
Length: 0.36 miles
Direction: E-W
Address range: 500 to 1115
Direction: E-W
Address range: 500 to 1115
Jackson St
Length: 0.34 miles
Direction: E-W
Address range: 500 to 1115
Direction: E-W
Address range: 500 to 1115
N Houston St
Length: 0.32 miles
Directions: E-W, N-S, SE-NW, SW-NE
Address range: 100 to 2499
Directions: E-W, N-S, SE-NW, SW-NE
Address range: 100 to 2499
Corbin St
Length: 0.30 miles
Directions: E-W, SW-NE
Address range: 600 to 1299
Directions: E-W, SW-NE
Address range: 600 to 1299
Laws St
Length: 0.28 miles
Directions: N-S, SE-NW, SW-NE
Address range: 1700 to 2199
Directions: N-S, SE-NW, SW-NE
Address range: 1700 to 2199
N Market St
Length: 0.27 miles
Directions: N-S, SE-NW
Address range: 100 to 1899
Directions: N-S, SE-NW
Address range: 100 to 1899
Hord St
Length: 0.22 miles
Direction: SW-NE
Address range: 800 to 1299
Direction: SW-NE
Address range: 800 to 1299
Munger Ave
Length: 0.20 miles
Directions: E-W, SW-NE
Address range: 600 to 1099
Directions: E-W, SW-NE
Address range: 600 to 1099
N Austin St
Length: 0.17 miles
Direction: N-S
Address range: 100 to 399
Direction: N-S
Address range: 100 to 399
Broom St
Length: 0.16 miles
Direction: SW-NE
Address range: 900 to 1299
Direction: SW-NE
Address range: 900 to 1299
Reunion Blvd
Length: 0.13 miles
Directions: E-W, SE-NW
Address range: 116 to 187
Directions: E-W, SE-NW
Address range: 116 to 187
S Houston St
Length: 0.12 miles
Directions: N-S, SE-NW
Address range: 100 to 327
Directions: N-S, SE-NW
Address range: 100 to 327
S Record St
Length: 0.11 miles
Direction: N-S
Address range: 100 to 299
Direction: N-S
Address range: 100 to 299
S Austin St
Length: 0.11 miles
Direction: N-S
Address range: 100 to 299
Direction: N-S
Address range: 100 to 299
S Market St
Length: 0.11 miles
Direction: N-S
Address range: 100 to 299
Direction: N-S
Address range: 100 to 299
S Lamar St
Length: 0.11 miles
Direction: N-S
Address range: 100 to 299
Direction: N-S
Address range: 100 to 299
San Jacinto St
Length: 0.10 miles
Direction: SW-NE
Address range: 900 to 1119
Direction: SW-NE
Address range: 900 to 1119
S Griffin Blvd
Length: 0.10 miles
Direction: N-S
Direction: N-S
Griffin St W
Length: 0.10 miles
Direction: N-S
Address range: 100 to 299
Direction: N-S
Address range: 100 to 299
N Stemmons Fwy
Length: 0.09 miles
Direction: N-S
Address range: 601 to 721
Direction: N-S
Address range: 601 to 721
McKinney Ave
Length: 0.09 miles
Direction: SW-NE
Address range: 1000 to 1099
Direction: SW-NE
Address range: 1000 to 1099
Magnolia St
Length: 0.06 miles
Direction: N-S
Address range: 1700 to 1799
Direction: N-S
Address range: 1700 to 1799
S Poydras St
Length: 0.05 miles
Direction: N-S
Address range: 200 to 299
Direction: N-S
Address range: 200 to 299
Slocum St
Length: 0.05 miles
Direction: SE-NW
Address range: 800 to 856
Direction: SE-NW
Address range: 800 to 856
Wesley Aly
Length: 0.02 miles
Directions: N-S, SE-NW
Address range: 2100 to 2129
Directions: N-S, SE-NW
Address range: 2100 to 2129
Railroad features:
Missouri-Kansas-Texas RR
Length: 1.21 miles
Directions: N-S, SE-NW, SW-NE
Directions: N-S, SE-NW, SW-NE
Cottonbelt RR
Length: 0.25 miles
Direction: N-S
Direction: N-S
M K T RR
Length: 0.22 miles
Directions: E-W, N-S, SE-NW, SW-NE
Directions: E-W, N-S, SE-NW, SW-NE
Texas and Pacific Rlwy
Length: 0.21 miles
Directions: E-W, SE-NW
Directions: E-W, SE-NW
T and P RR
Length: 0.14 miles
Directions: E-W, SW-NE
Directions: E-W, SW-NE
Railroad Spur
Length: 0.02 miles
Direction: SE-NW
Direction: SE-NW