South Clifton Park neighborhood in Baltimore, Maryland (MD), 21213 detailed profile
Settings
X

Business Search - 14 Million verified businesses
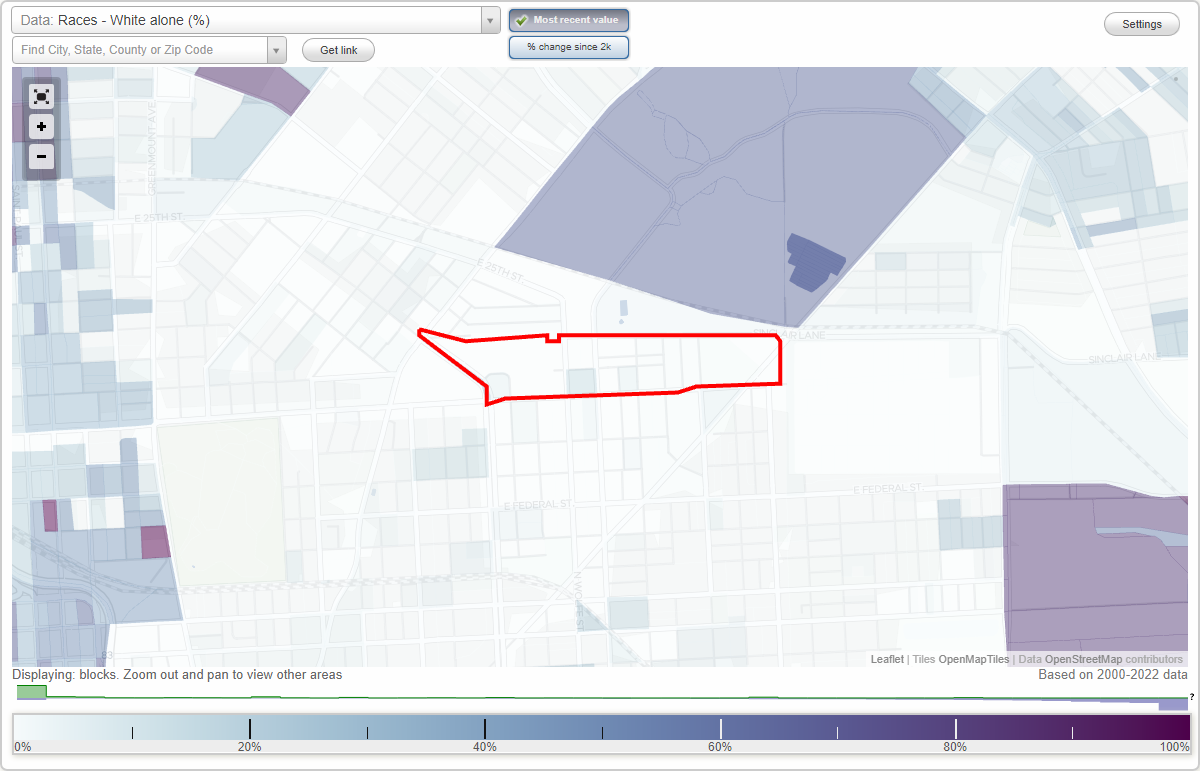
Area: 0.096 square miles
Population: 442
Population density:
| South Clifton Park: | 4,614 people per square mile |
| Baltimore: | 7,053 people per square mile |

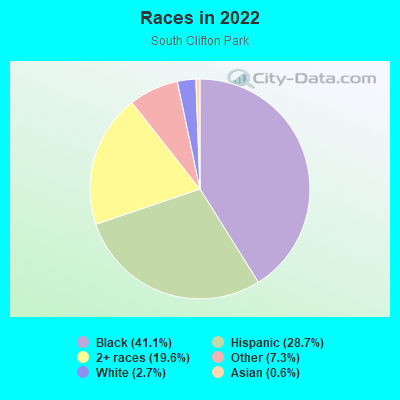
- 41341.1%Black
- 28928.7%Hispanic or Latino
- 19719.6%Two or more races
- 737.3%Some other race
- 272.7%White
- 60.6%Asian
- 10.10%American Indian
Distribution of median household income
![Distribution of median household income]()
- 37Less than $10,000
- 67$10,000 to $19,999
- 82$20,000 to $29,999
- 21$30,000 to $39,999
- 39$40,000 to $49,999
- 20$50,000 to $59,999
- 61$60,000 to $74,999
- 11$75,000 to $99,999
- 33$100,000 to $124,999
- 1$125,000 to $149,999
- 52$150,000 to $199,999
- 18$200,000 or more

Distribution of owner-occupied house/condo value
![Distribution of owner-occupied house/condo value]()
- 248Less than $50,000
- 130$50,000 to $99,999
- 149$100,000 to $149,999
- 55$150,000 to $199,999
- 47$200,000 to $249,999
- 91$300,000 to $399,999
- 2$750,000 to $999,999

Distribution of rent paid by renters
![Distribution of rent paid by renters]()
- 6Less than $100
- 8$100 to $199
- 44$200 to $299
- 2$300 to $399
- 78$400 to $499
- 24$500 to $599
- 149$600 to $699
- 35$700 to $799
- 81$800 to $899
- 47$900 to $999
- 73$1,000 to $1,249
- 6$1,250 to $1,499
- 47$1,500 to $1,999

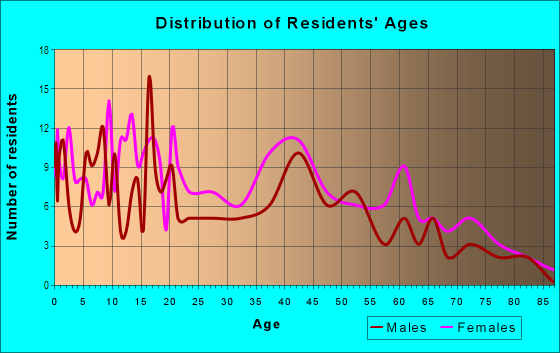
| Males: | 178 |
| Females: | 263 |
Males:
| This neighborhood: | 32.3 years |
| Whole city: | 35.0 years |
| This neighborhood: | 51.7 years |
| Whole city: | 38.2 years |
Average household size:
| South Clifton Park: | 2.4 people |
| Baltimore: | 2.2 people |
Percentage of family households:
| South Clifton Park: | 46.1% |
| Baltimore: | 34.2% |
| Here: | 3.6% |
| Baltimore: | 23.3% |
Percentage of married-couple families with children (among all households):
| South Clifton Park: | 0.3% |
| Baltimore: | 22.4% |
Percentage of single-mother households (among all households):
| South Clifton Park: | 27.9% |
| Baltimore: | 18.7% |
Percentage of never married males 15 years old and over:
Percentage of never married females 15 years old and over:
| South Clifton Park: | 32.2% |
| Baltimore: | 25.1% |
Percentage of never married females 15 years old and over:
| South Clifton Park: | 45.8% |
| city: | 27.5% |
Percentage of people that speak English not well or not at all:
| South Clifton Park: | 0.0% |
| Baltimore: | 2.3% |
Percentage of people born in this state:
Percentage of people born in another U.S. state:
Percentage of native residents but born outside the U.S.:
Percentage of foreign born residents:
| Here: | 92.5% |
| Baltimore: | 64.4% |
Percentage of people born in another U.S. state:
| South Clifton Park: | 7.5% |
| Baltimore: | 25.0% |
Percentage of native residents but born outside the U.S.:
| Here: | 0.0% |
| city: | 0.9% |
Percentage of foreign born residents:
| Here: | 12.0% |
| Baltimore: | 9.7% |
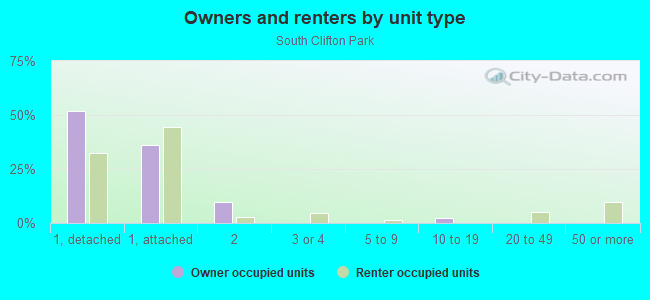
Owner-occupied
Renter-occupied

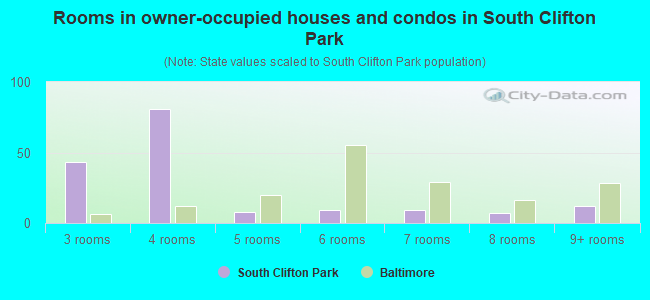
- Rooms in owner-occupied houses and condos in South Clifton Park
- 01 room
- 02 rooms
- 433 rooms
- 814 rooms
- 85 rooms
- 96 rooms
- 97 rooms
- 78 rooms
- 129+ rooms
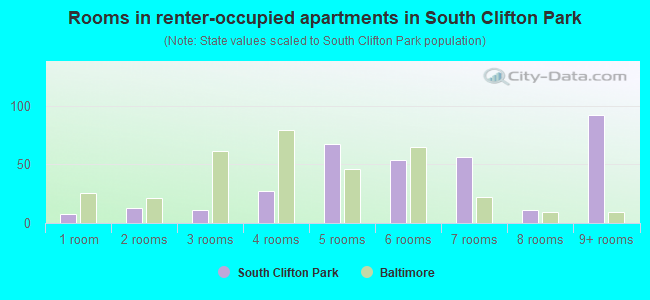
- Rooms in renter-occupied apartments in South Clifton Park
- 81 room
- 132 rooms
- 113 rooms
- 274 rooms
- 675 rooms
- 546 rooms
- 567 rooms
- 118 rooms
- 929+ rooms
Owner-occupied
Renter-occupied

- Bedrooms in owner-occupied houses and condos in South Clifton Park
- 0no bedroom
- 11 bedroom
- 242 bedrooms
- 253 bedrooms
- 74 bedrooms
- 515+ bedrooms
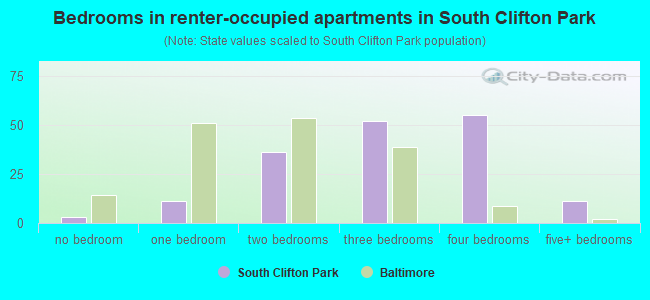
- Bedrooms in renter-occupied apartments in South Clifton Park
- 3no bedroom
- 111 bedroom
- 362 bedrooms
- 523 bedrooms
- 554 bedrooms
- 115+ bedrooms
Average number of cars or other vehicles available in houses/condos:
Average number of cars or other vehicles available in apartments:
| This neighborhood: | 11.6 |
| Baltimore: | 1.5 |
Average number of cars or other vehicles available in apartments:
| Here: | |
| city: |
Percentage of units with a mortgage:
| South Clifton Park: | 68.4% |
| Baltimore: | 64.3% |
Average estimated value of townhouses or other attached units in 2022 (89.3% of all units):
| This neighborhood: | $63,365 |
| city: | $206,258 |
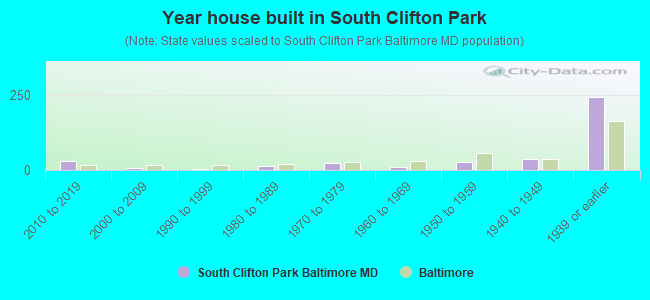
- Year house built in South Clifton Park
- 02020 or later
- 312010 to 2019
- 62000 to 2009
- 31990 to 1999
- 121980 to 1989
- 221970 to 1979
- 101960 to 1969
- 271950 to 1959
- 361940 to 1949
- 2411939 or earlier
Travel time to work (commute)
![Travel time to work (commute)]()
- 3Less than 5 minutes
- 15 to 9 minutes
- 910 to 14 minutes
- 2415 to 19 minutes
- 3920 to 24 minutes
- 1125 to 29 minutes
- 930 to 34 minutes
- 535 to 39 minutes
- 240 to 44 minutes
- 11245 to 59 minutes
- 760 to 89 minutes
- 190 or more minutes

Means of transportation to work
![Means of transportation to work]()
- 51.7%71Drove a car alone
- 61.1%84Carpooled
- 40.8%56Bus
- 2.2%3Taxi
- 2.2%3Bicycle
- 2.2%3Walked
- 85.2%117Other means
- 7.3%10Worked at home

Time leaving home to go to work
![Time leaving home to go to work]()
- 1112:00 a.m. to 4:59 a.m.
- 15:00 a.m. to 5:29 a.m.
- 155:30 a.m. to 5:59 a.m.
- 156:00 a.m. to 6:29 a.m.
- 106:30 a.m. to 6:59 a.m.
- 37:00 a.m. to 7:29 a.m.
- 167:30 a.m. to 7:59 a.m.
- 108:00 a.m. to 8:29 a.m.
- 58:30 a.m. to 8:59 a.m.
- 139:00 a.m. to 9:59 a.m.
- 110:00 a.m. to 10:59 a.m.
- 511:00 a.m. to 11:59 a.m.
- 812:00 p.m. to 3:59 p.m.

Occupations of males:
- Percentage of males in computer and mathematical occupations:
Here: 4.9% city: 6.1%
- Percentage of males in community and social services occupations:
Here: 3.3% city: 1.6%
- Percentage of males in education, training, and library occupations:
Here: 4.1% city: 5.4%
- Percentage of males in healthcare practitioners and technical occupations:
Here: 2.9% city: 4.0%
- Percentage of males in service occupations:
Here: 29.2% city: 14.7%
- Percentage of males in sales and office occupations:
Here: 8.5% city: 14.2%
- Percentage of males in construction, extraction, and maintenance occupations:
Here: 4.2% city: 5.6%
- Percentage of males in production occupations:
Here: 3.5% city: 4.2%
- Percentage of males in transportation occupations:
Here: 23.0% city: 6.8%
- Percentage of males in material moving occupations:
Here: 15.8% city: 7.0%
Occupations of females:
- Percentage of females in business and financial operations occupations:
Here: 6.6% city: 6.6%
- Percentage of females in service occupations:
Here: 40.5% city: 20.4%
- Percentage of females in sales and office occupations:
Here: 51.4% city: 22.3%
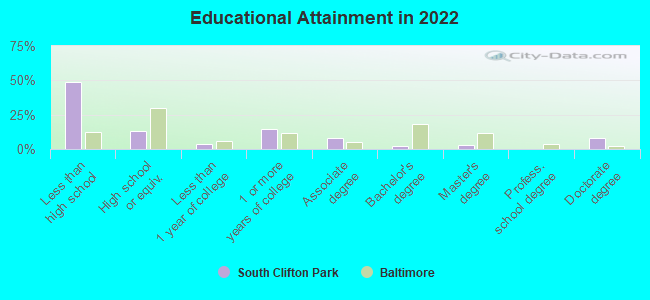
Education in this neighborhood (subdivision or community):
- Percentage of people 3 years and older in K-12 schools:
South Clifton Park: 151.7% Baltimore: 14.7%
- Percentage of people 3 years and older in undergraduate colleges:
South Clifton Park: 12.8% Baltimore: 6.0%
- Percentage of people 3 years and older in grad. or professional schools:
South Clifton Park: 16.6% Baltimore: 2.8%
- Percentage of students K-12 enrolled in private schools:
South Clifton Park: 10.2% Baltimore: 12.7%
Percentage of population below poverty level:
| South Clifton Park: | 42.8% |
| Baltimore: | 18.5% |
Median year owner moved in (as recorded in 2022):
| South Clifton Park: | 1994 |
| Baltimore: | 2009 |
Percentage of married-couple families with both working:
| South Clifton Park: | 97.5% |
| Baltimore: | 79.2% |
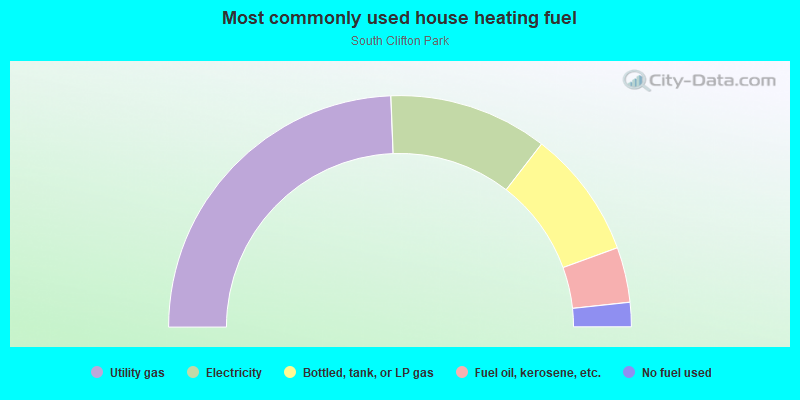
- 48.7%Utility gas
- 22.2%Electricity
- 17.9%Bottled, tank, or LP gas
- 7.7%Fuel oil, kerosene, etc.
- 3.4%No fuel used
Highways in this neighborhood:
US Hwy 1 (E North Ave)
Length: 0.60 miles
Direction: E-W
Address range: 1705 to 2267
Direction: E-W
Address range: 1705 to 2267
US Hwy 1 (Belair Rd)
Length: 0.06 miles
Direction: SW-NE
Address range: 1900 to 1934
Direction: SW-NE
Address range: 1900 to 1934
Roads and streets:
E 20th St
Length: 0.32 miles
Direction: E-W
Address range: 1900 to 2199
Direction: E-W
Address range: 1900 to 2199
N Broadway
Length: 0.20 miles
Direction: SE-NW
Direction: SE-NW
Cliftwood Ave
Length: 0.20 miles
Direction: E-W
Address range: 2000 to 2199
Direction: E-W
Address range: 2000 to 2199
N Wolfe St
Length: 0.13 miles
Direction: N-S
Address range: 1900 to 2017
Direction: N-S
Address range: 1900 to 2017
N Collington Ave
Length: 0.09 miles
Direction: N-S
Address range: 1900 to 1964
Direction: N-S
Address range: 1900 to 1964
N Washington St
Length: 0.08 miles
Direction: N-S
Address range: 1901 to 2009
Direction: N-S
Address range: 1901 to 2009
N Chester St
Length: 0.08 miles
Direction: N-S
Address range: 1900 to 2019
Direction: N-S
Address range: 1900 to 2019
N Castle St
Length: 0.06 miles
Direction: N-S
Address range: 1900 to 1999
Direction: N-S
Address range: 1900 to 1999
Mc Donogh St
Length: 0.04 miles
Direction: N-S
Address range: 1900 to 1999
Direction: N-S
Address range: 1900 to 1999