Sabin-Irvington neighborhood in Portland, Oregon (OR), 97212 detailed profile
Settings
X


Business Search - 14 Million verified businesses
Area: 0.105 square miles
Population: 1,373
Population density:
| Sabin-Irvington: | 13,068 people per square mile |
| Portland: | 4,730 people per square mile |

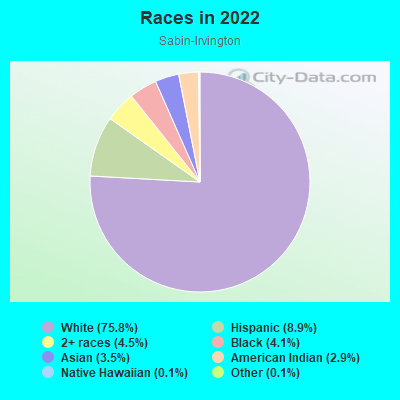
- 1,07375.8%White
- 1268.9%Hispanic or Latino
- 644.5%Two or more races
- 584.1%Black
- 503.5%Asian
- 412.9%American Indian
- 20.1%Native Hawaiian and Other
Pacific Islander - 20.1%Some other race
Median household income in 2022:
| Sabin-Irvington: | $178,514 |
| Portland: | $81,119 |
Distribution of median household income
![Distribution of median household income]()
- 14Less than $10,000
- 24$10,000 to $19,999
- 12$20,000 to $29,999
- 41$30,000 to $39,999
- 19$40,000 to $49,999
- 35$50,000 to $59,999
- 45$60,000 to $74,999
- 37$75,000 to $99,999
- 47$100,000 to $124,999
- 34$125,000 to $149,999
- 127$150,000 to $199,999
- 246$200,000 or more

Distribution of owner-occupied house/condo value
![Distribution of owner-occupied house/condo value]()
- 7Less than $50,000
- 11$50,000 to $99,999
- 103$100,000 to $149,999
- 1$200,000 to $249,999
- 15$300,000 to $399,999
- 14$400,000 to $499,999
- 132$500,000 to $749,999
- 195$750,000 to $999,999
- 99$1,000,000 or more

Distribution of rent paid by renters
![Distribution of rent paid by renters]()
- 16$100 to $199
- 3$300 to $399
- 3$600 to $699
- 29$700 to $799
- 10$1,000 to $1,249
- 11$1,250 to $1,499
- 112$1,500 to $1,999
- 102$2,000 or more

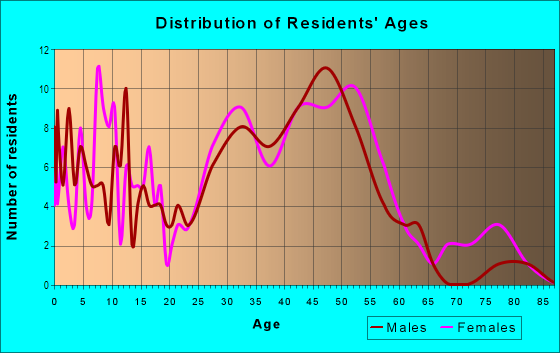
| Males: | 640 |
| Females: | 733 |
Males:
| This neighborhood: | 38.2 years |
| Whole city: | 38.3 years |
| This neighborhood: | 42.2 years |
| Whole city: | 38.6 years |
Average household size:
| Sabin-Irvington: | 2.6 people |
| Portland: | 2.2 people |
Percentage of family households:
| Sabin-Irvington: | 57.3% |
| Portland: | 35.3% |
| Here: | 57.2% |
| Portland: | 33.5% |
Percentage of married-couple families with children (among all households):
| Sabin-Irvington: | 31.7% |
| Portland: | 31.0% |
Percentage of single-mother households (among all households):
| Sabin-Irvington: | 6.1% |
| Portland: | 9.4% |
Percentage of never married males 15 years old and over:
Percentage of never married females 15 years old and over:
| Sabin-Irvington: | 12.2% |
| Portland: | 24.3% |
Percentage of never married females 15 years old and over:
| Sabin-Irvington: | 16.9% |
| city: | 20.5% |
Percentage of people that speak English not well or not at all:
| Sabin-Irvington: | 2.5% |
| Portland: | 3.6% |
Percentage of people born in this state:
Percentage of people born in another U.S. state:
Percentage of native residents but born outside the U.S.:
Percentage of foreign born residents:
| Here: | 34.9% |
| Portland: | 38.1% |
Percentage of people born in another U.S. state:
| Sabin-Irvington: | 54.8% |
| Portland: | 48.2% |
Percentage of native residents but born outside the U.S.:
| Here: | 1.7% |
| city: | 1.5% |
Percentage of foreign born residents:
| Here: | 8.6% |
| Portland: | 12.2% |
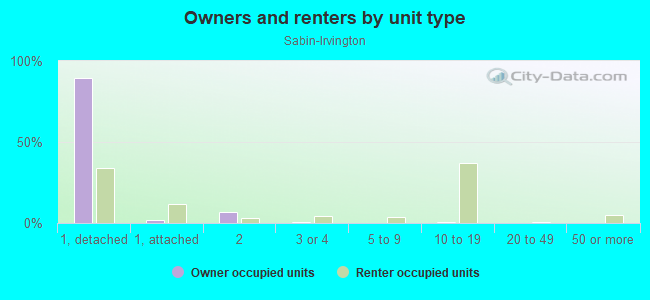
Owner-occupied
Renter-occupied


- Rooms in owner-occupied houses and condos in Sabin-Irvington
- 761 room
- 92 rooms
- 13 rooms
- 94 rooms
- 95 rooms
- 1726 rooms
- 767 rooms
- 1098 rooms
- 1239+ rooms

- Rooms in renter-occupied apartments in Sabin-Irvington
- 91 room
- 52 rooms
- 663 rooms
- 454 rooms
- 55 rooms
- 346 rooms
- 797 rooms
- 208 rooms
- 09+ rooms
Owner-occupied
Renter-occupied

- Bedrooms in owner-occupied houses and condos in Sabin-Irvington
- 86no bedroom
- 81 bedroom
- 502 bedrooms
- 2403 bedrooms
- 1864 bedrooms
- 235+ bedrooms
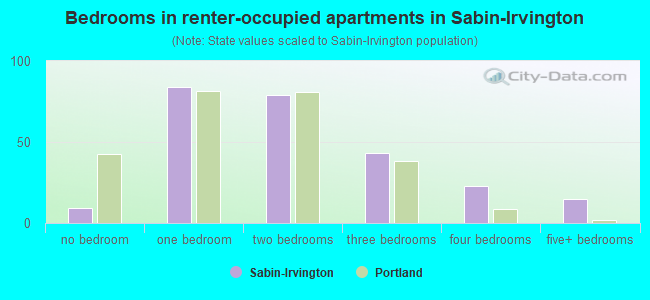
- Bedrooms in renter-occupied apartments in Sabin-Irvington
- 9no bedroom
- 841 bedroom
- 792 bedrooms
- 433 bedrooms
- 234 bedrooms
- 155+ bedrooms
Average number of cars or other vehicles available in houses/condos:
Average number of cars or other vehicles available in apartments:
| This neighborhood: | 2.1 |
| Portland: | 1.8 |
Average number of cars or other vehicles available in apartments:
| Here: | 2.3 |
| city: | 1.1 |
Percentage of units with a mortgage:
| Sabin-Irvington: | 64.3% |
| Portland: | 73.0% |
Average estimated value of detached houses in 2022 (99.3% of all units):
| Sabin-Irvington: | $785,141 |
| Portland: | $616,638 |
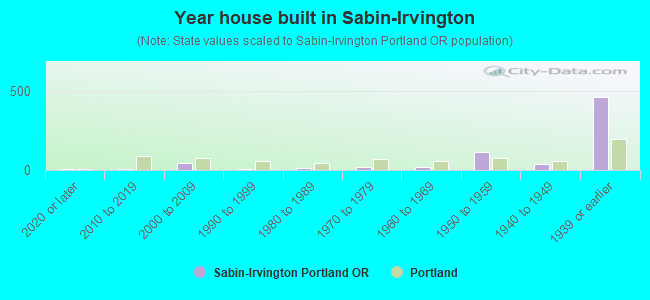
- Year house built in Sabin-Irvington
- 92020 or later
- 92010 to 2019
- 412000 to 2009
- 71990 to 1999
- 131980 to 1989
- 181970 to 1979
- 171960 to 1969
- 1121950 to 1959
- 361940 to 1949
- 4581939 or earlier
City-data.com crime index for city in 2020 (higher means more crime):
| City: | 399.8 |
| U.S. average: | 219.5 |
Travel time to work (commute)
![Travel time to work (commute)]()
- 9Less than 5 minutes
- 225 to 9 minutes
- 4210 to 14 minutes
- 10415 to 19 minutes
- 10320 to 24 minutes
- 7825 to 29 minutes
- 5630 to 34 minutes
- 1335 to 39 minutes
- 740 to 44 minutes
- 4245 to 59 minutes
- 2460 to 89 minutes
- 2490 or more minutes

Means of transportation to work
![Means of transportation to work]()
- 33.3%273Drove a car alone
- 5.1%42Carpooled
- 9.9%81Bus
- 1.1%9Light rail, streetcar or trolley
- 18.8%154Bicycle
- 2.4%20Walked
- 6.4%52Other means
- 36.9%302Worked at home

Time leaving home to go to work
![Time leaving home to go to work]()
- 512:00 a.m. to 4:59 a.m.
- 255:00 a.m. to 5:29 a.m.
- 145:30 a.m. to 5:59 a.m.
- 276:00 a.m. to 6:29 a.m.
- 466:30 a.m. to 6:59 a.m.
- 837:00 a.m. to 7:29 a.m.
- 757:30 a.m. to 7:59 a.m.
- 788:00 a.m. to 8:29 a.m.
- 648:30 a.m. to 8:59 a.m.
- 369:00 a.m. to 9:59 a.m.
- 410:00 a.m. to 10:59 a.m.
- 311:00 a.m. to 11:59 a.m.
- 2112:00 p.m. to 3:59 p.m.
- 244:00 p.m. to 11:59 p.m.

Occupations of males:
- Percentage of males in management occupations (except farmers):
Here: 33.2% city: 13.5%
- Percentage of males in business and financial operations occupations:
Here: 4.3% city: 6.8%
- Percentage of males in computer and mathematical occupations:
Here: 8.3% city: 7.2%
- Percentage of males in architecture and engineering occupations:
Here: 1.4% city: 5.0%
- Percentage of males in legal occupations:
Here: 2.5% city: 1.8%
- Percentage of males in education, training, and library occupations:
Here: 5.8% city: 3.6%
- Percentage of males in arts, design, entertainment, sports, and media occupations:
Here: 10.0% city: 5.2%
- Percentage of males in healthcare practitioners and technical occupations:
Here: 4.8% city: 4.4%
- Percentage of males in service occupations:
Here: 5.8% city: 11.9%
- Percentage of males in sales and office occupations:
Here: 11.6% city: 14.7%
- Percentage of males in construction, extraction, and maintenance occupations:
Here: 3.2% city: 5.2%
- Percentage of males in transportation occupations:
Here: 1.3% city: 4.3%
- Percentage of males in material moving occupations:
Here: 3.6% city: 4.0%
Occupations of females:
- Percentage of females in management occupations (except farmers):
Here: 9.6% city: 12.8%
- Percentage of females in business and financial operations occupations:
Here: 3.7% city: 8.1%
- Percentage of females in computer and mathematical occupations:
Here: 6.1% city: 2.5%
- Percentage of females in architecture and engineering occupations:
Here: 2.2% city: 1.6%
- Percentage of females in life, physical, and social science occupations:
Here: 7.0% city: 2.0%
- Percentage of females in community and social services occupations:
Here: 4.9% city: 3.4%
- Percentage of females in legal occupations:
Here: 5.1% city: 2.4%
- Percentage of females in education, training, and library occupations:
Here: 5.9% city: 8.4%
- Percentage of females in arts, design, entertainment, sports, and media occupations:
Here: 3.7% city: 5.1%
- Percentage of females in healthcare practitioners and technical occupations:
Here: 19.0% city: 10.3%
- Percentage of females in service occupations:
Here: 4.9% city: 17.8%
- Percentage of females in sales and office occupations:
Here: 27.0% city: 20.0%
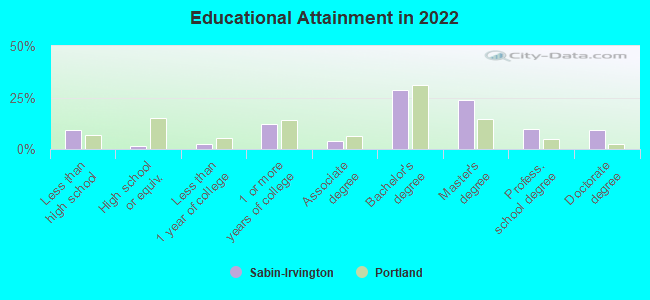
Education in this neighborhood (subdivision or community):
- Percentage of people 3 years and older in K-12 schools:
Sabin-Irvington: 16.9% Portland: 12.2%
- Percentage of people 3 years and older in undergraduate colleges:
Sabin-Irvington: 2.2% Portland: 4.8%
- Percentage of people 3 years and older in grad. or professional schools:
Sabin-Irvington: 3.0% Portland: 2.0%
- Percentage of students K-12 enrolled in private schools:
Sabin-Irvington: 43.6% Portland: 12.7%
Percentage of population below poverty level:
| Sabin-Irvington: | 2.2% |
| Portland: | 12.7% |
Median year owner moved in (as recorded in 2022):
| Sabin-Irvington: | 2011 |
| Portland: | 2012 |
Percentage of married-couple families with both working:
| Sabin-Irvington: | 100.2% |
| Portland: | 78.7% |
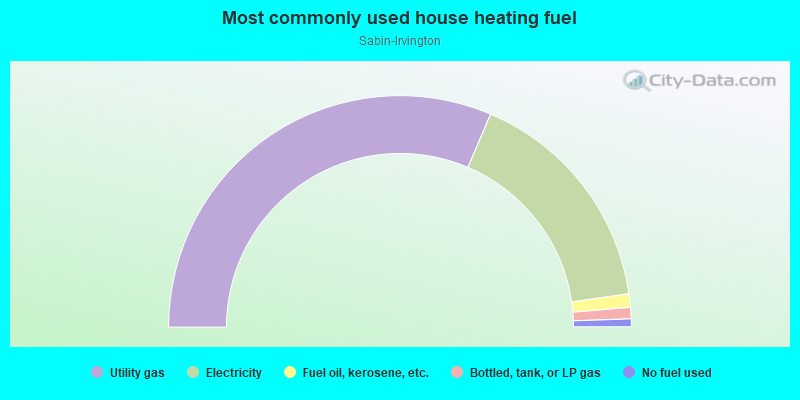
- 62.9%Utility gas
- 32.6%Electricity
- 1.9%Fuel oil, kerosene, etc.
- 1.6%Bottled, tank, or LP gas
- 1.1%No fuel used
Roads and streets:
NE Siskiyou St
Length: 0.64 miles
Direction: E-W
Address range: 1200 to 2099
Direction: E-W
Address range: 1200 to 2099
NE Klickitat St
Length: 0.64 miles
Direction: E-W
Address range: 1200 to 2099
Direction: E-W
Address range: 1200 to 2099
NE 17th St (NE 17th Ave)
Length: 0.11 miles
Direction: N-S
Address range: 3100 to 3299
Direction: N-S
Address range: 3100 to 3299
NE 18th Ave
Length: 0.11 miles
Direction: N-S
Address range: 3100 to 3299
Direction: N-S
Address range: 3100 to 3299
NE 19th Ave
Length: 0.11 miles
Direction: N-S
Address range: 3100 to 3299
Direction: N-S
Address range: 3100 to 3299
NE 20th Ave
Length: 0.11 miles
Direction: N-S
Address range: 3100 to 3299
Direction: N-S
Address range: 3100 to 3299
NE 16th Ave
Length: 0.11 miles
Direction: N-S
Address range: 3100 to 3299
Direction: N-S
Address range: 3100 to 3299
NE 21st Ave
Length: 0.11 miles
Direction: N-S
Address range: 3100 to 3299
Direction: N-S
Address range: 3100 to 3299
NE 13th Ave
Length: 0.11 miles
Direction: N-S
Address range: 3100 to 3299
Direction: N-S
Address range: 3100 to 3299
NE 12th Ave
Length: 0.11 miles
Direction: N-S
Address range: 3100 to 3299
Direction: N-S
Address range: 3100 to 3299
NE 14th Ave
Length: 0.11 miles
Direction: N-S
Address range: 3100 to 3299
Direction: N-S
Address range: 3100 to 3299
NE 15th Ave
Length: 0.11 miles
Direction: N-S
Address range: 3100 to 3299
Direction: N-S
Address range: 3100 to 3299