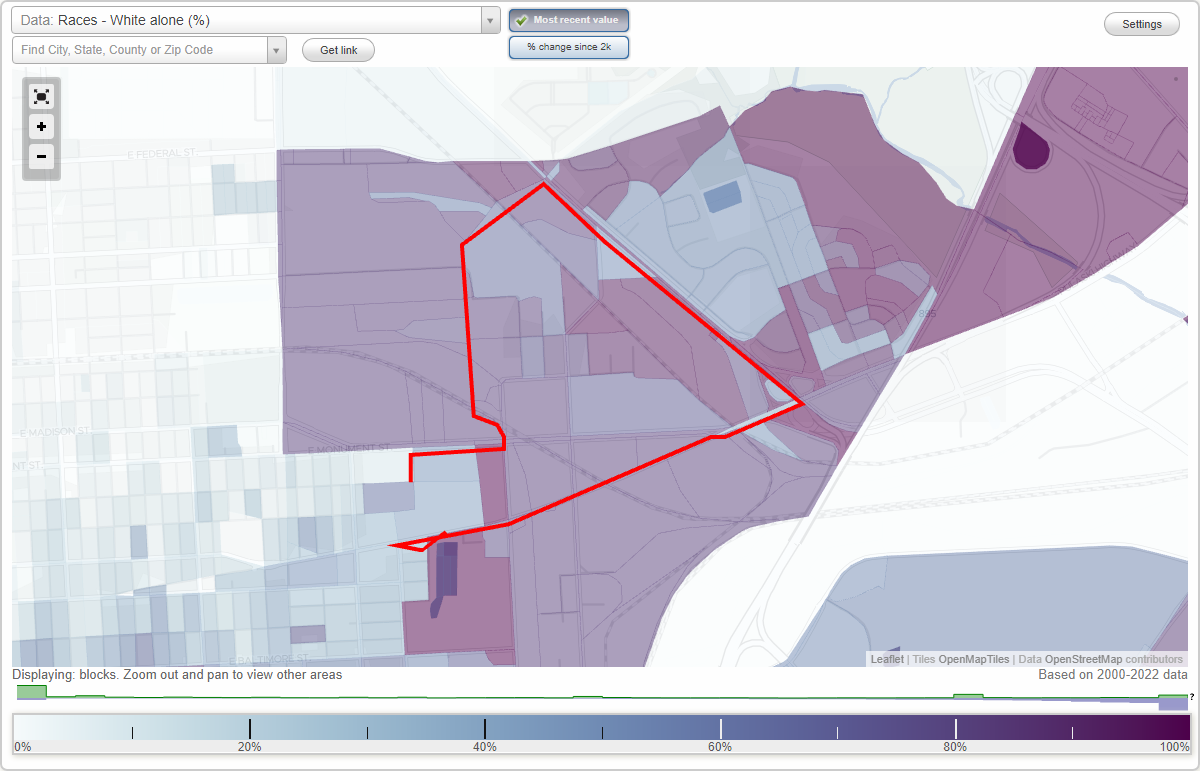
Orangeville neighborhood in Baltimore, Maryland (MD), 21224, 21205 detailed profile
Settings
X

Business Search - 14 Million verified businesses
Area: 0.362 square miles
Population: 638
Population density:
| Orangeville: | 1,761 people per square mile |
| Baltimore: | 7,053 people per square mile |

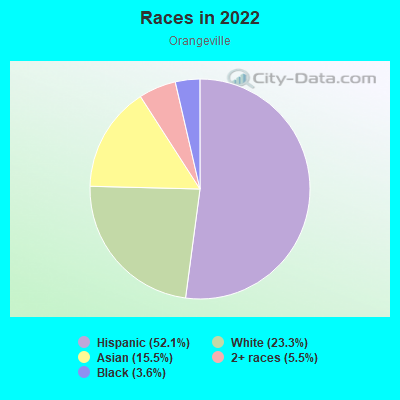
- 66852.1%Hispanic or Latino
- 29823.3%White
- 19815.5%Asian
- 715.5%Two or more races
- 463.6%Black
Median household income in 2022:
| Orangeville: | $29,079 |
| Baltimore: | $55,198 |
Distribution of median household income
![Distribution of median household income]()
- 55Less than $10,000
- 111$10,000 to $19,999
- 63$20,000 to $29,999
- 9$30,000 to $39,999
- 80$40,000 to $49,999
- 16$50,000 to $59,999
- 22$60,000 to $74,999
- 31$75,000 to $99,999
- 37$100,000 to $124,999
- 40$125,000 to $149,999

Distribution of owner-occupied house/condo value
![Distribution of owner-occupied house/condo value]()
- 181Less than $50,000
- 87$50,000 to $99,999
- 19$100,000 to $149,999
- 40$150,000 to $199,999
- 20$200,000 to $249,999
- 19$250,000 to $299,999
- 8$300,000 to $399,999

Distribution of rent paid by renters
![Distribution of rent paid by renters]()
- 43$400 to $499
- 172$500 to $599
- 11$600 to $699
- 34$800 to $899
- 72$900 to $999
- 54$1,000 to $1,249
- 58$1,250 to $1,499
- 53$1,500 to $1,999

Median rent in 2022:
| Orangeville: | $834 |
| Baltimore: | $1,043 |
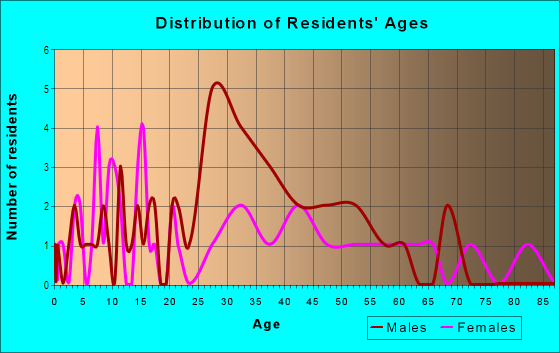
| Males: | 312 |
| Females: | 326 |
Males:
| This neighborhood: | 46.9 years |
| Whole city: | 35.0 years |
| This neighborhood: | 40.7 years |
| Whole city: | 38.2 years |
Average household size:
| Orangeville: | 2.6 people |
| Baltimore: | 2.2 people |
Percentage of family households:
| Orangeville: | 34.4% |
| Baltimore: | 34.2% |
| Here: | 32.2% |
| Baltimore: | 23.3% |
Percentage of married-couple families with children (among all households):
| Orangeville: | 31.7% |
| Baltimore: | 22.4% |
Percentage of single-mother households (among all households):
| Orangeville: | 10.8% |
| Baltimore: | 18.7% |
Percentage of never married males 15 years old and over:
Percentage of never married females 15 years old and over:
| Orangeville: | 21.1% |
| Baltimore: | 25.1% |
Percentage of never married females 15 years old and over:
| Orangeville: | 17.8% |
| city: | 27.5% |
Percentage of people that speak English not well or not at all:
| Orangeville: | 9.1% |
| Baltimore: | 2.3% |
Percentage of people born in this state:
Percentage of people born in another U.S. state:
Percentage of native residents but born outside the U.S.:
Percentage of foreign born residents:
| Here: | 48.6% |
| Baltimore: | 64.4% |
Percentage of people born in another U.S. state:
| Orangeville: | 17.2% |
| Baltimore: | 25.0% |
Percentage of native residents but born outside the U.S.:
| Here: | 0.0% |
| city: | 0.9% |
Percentage of foreign born residents:
| Here: | 34.2% |
| Baltimore: | 9.7% |
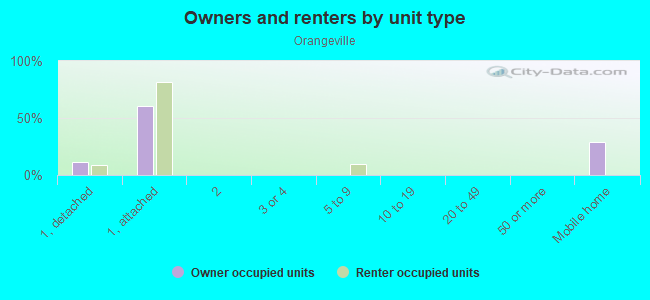
Owner-occupied
Renter-occupied

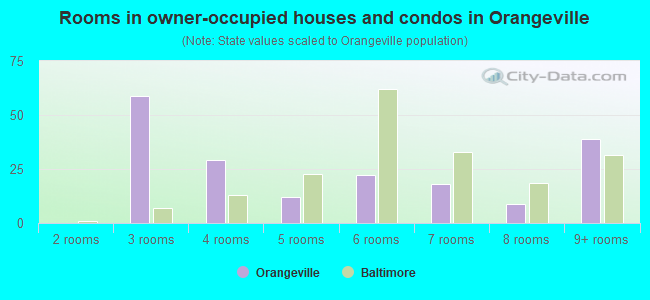
- Rooms in owner-occupied houses and condos in Orangeville
- 01 room
- 02 rooms
- 593 rooms
- 294 rooms
- 125 rooms
- 226 rooms
- 187 rooms
- 98 rooms
- 399+ rooms
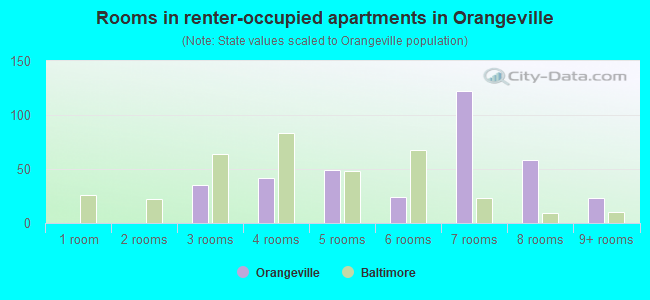
- Rooms in renter-occupied apartments in Orangeville
- 01 room
- 02 rooms
- 353 rooms
- 424 rooms
- 495 rooms
- 246 rooms
- 1227 rooms
- 588 rooms
- 239+ rooms
Owner-occupied
Renter-occupied
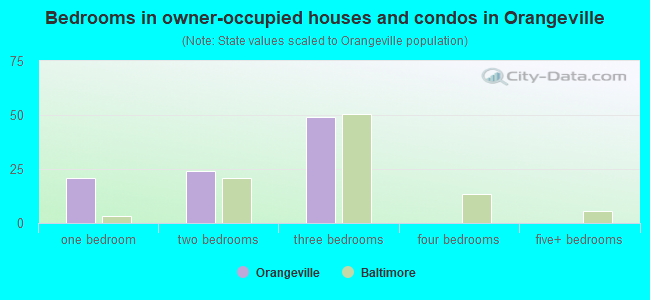
- Bedrooms in owner-occupied houses and condos in Orangeville
- 0no bedroom
- 211 bedroom
- 242 bedrooms
- 493 bedrooms
- 04 bedrooms
- 05+ bedrooms
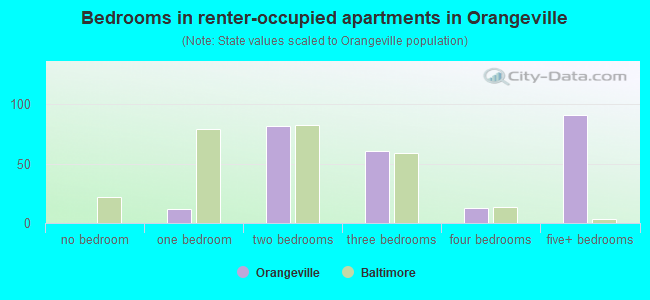
- Bedrooms in renter-occupied apartments in Orangeville
- 0no bedroom
- 121 bedroom
- 822 bedrooms
- 613 bedrooms
- 134 bedrooms
- 915+ bedrooms
Average number of cars or other vehicles available in houses/condos:
Average number of cars or other vehicles available in apartments:
| This neighborhood: | 2.0 |
| Baltimore: | 1.5 |
Average number of cars or other vehicles available in apartments:
| Here: | 2.5 |
| city: | 0.8 |
Percentage of units with a mortgage:
| Orangeville: | 37.7% |
| Baltimore: | 64.3% |
Average estimated value of townhouses or other attached units in 2022 (88.0% of all units):
| This neighborhood: | $116,578 |
| city: | $206,258 |
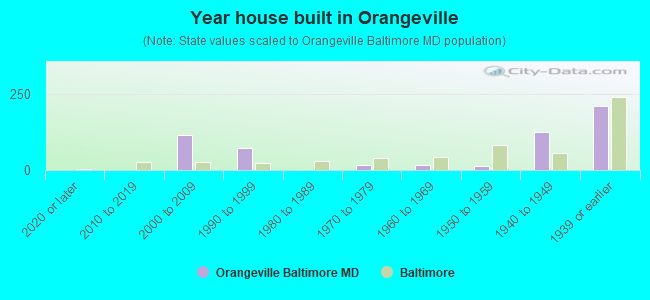
- Year house built in Orangeville
- 02020 or later
- 02010 to 2019
- 1162000 to 2009
- 741990 to 1999
- 01980 to 1989
- 151970 to 1979
- 171960 to 1969
- 121950 to 1959
- 1251940 to 1949
- 2121939 or earlier
Travel time to work (commute)
![Travel time to work (commute)]()
- 1Less than 5 minutes
- 225 to 9 minutes
- 2410 to 14 minutes
- 4615 to 19 minutes
- 3720 to 24 minutes
- 425 to 29 minutes
- 4030 to 34 minutes
- 5035 to 39 minutes
- 540 to 44 minutes
- 2345 to 59 minutes
- 1360 to 89 minutes
- 1190 or more minutes

Means of transportation to work
![Means of transportation to work]()
- 39.9%62Drove a car alone
- 13.5%21Carpooled
- 169.3%263Bus
- 6.4%10Taxi
- 25.1%39Bicycle
- 5.8%9Walked
- 12.2%19Other means
- 110.7%172Worked at home

Time leaving home to go to work
![Time leaving home to go to work]()
- 8212:00 a.m. to 4:59 a.m.
- 235:00 a.m. to 5:29 a.m.
- 85:30 a.m. to 5:59 a.m.
- 336:00 a.m. to 6:29 a.m.
- 506:30 a.m. to 6:59 a.m.
- 1017:00 a.m. to 7:29 a.m.
- 187:30 a.m. to 7:59 a.m.
- 68:00 a.m. to 8:29 a.m.
- 358:30 a.m. to 8:59 a.m.
- 119:00 a.m. to 9:59 a.m.
- 210:00 a.m. to 10:59 a.m.
- 411:00 a.m. to 11:59 a.m.
- 3912:00 p.m. to 3:59 p.m.
- 64:00 p.m. to 11:59 p.m.

Occupations of males:
- Percentage of males in management occupations (except farmers):
Here: 14.2% city: 10.7%
- Percentage of males in business and financial operations occupations:
Here: 4.7% city: 5.9%
- Percentage of males in computer and mathematical occupations:
Here: 4.8% city: 6.1%
- Percentage of males in healthcare practitioners and technical occupations:
Here: 3.1% city: 4.0%
- Percentage of males in service occupations:
Here: 6.5% city: 14.7%
- Percentage of males in sales and office occupations:
Here: 3.2% city: 14.2%
- Percentage of males in construction, extraction, and maintenance occupations:
Here: 36.1% city: 5.6%
- Percentage of males in production occupations:
Here: 6.9% city: 4.2%
- Percentage of males in transportation occupations:
Here: 8.4% city: 6.8%
- Percentage of males in material moving occupations:
Here: 17.6% city: 7.0%
Occupations of females:
- Percentage of females in education, training, and library occupations:
Here: 15.0% city: 10.7%
- Percentage of females in arts, design, entertainment, sports, and media occupations:
Here: 14.5% city: 2.4%
- Percentage of females in service occupations:
Here: 58.0% city: 20.4%
- Percentage of females in sales and office occupations:
Here: 13.4% city: 22.3%
- Percentage of females in construction, extraction, and maintenance occupations:
Here: 4.8% city: 0.4%
- Percentage of females in production occupations:
Here: 9.3% city: 2.3%
- Percentage of females in material moving occupations:
Here: 14.4% city: 1.9%
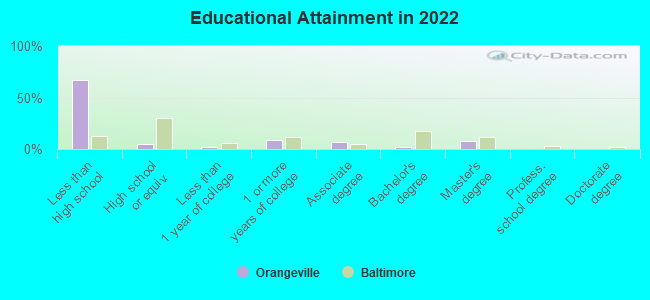
Education in this neighborhood (subdivision or community):
- Percentage of people 3 years and older in K-12 schools:
Orangeville: 74.5% Baltimore: 14.7%
- Percentage of people 3 years and older in undergraduate colleges:
Orangeville: 10.6% Baltimore: 6.0%
- Percentage of people 3 years and older in grad. or professional schools:
Orangeville: 6.7% Baltimore: 2.8%
- Percentage of students K-12 enrolled in private schools:
Orangeville: 22.9% Baltimore: 12.7%
Percentage of population below poverty level:
| Orangeville: | 30.0% |
| Baltimore: | 18.5% |
Median year owner moved in (as recorded in 2022):
Median year renter moved in (as recorded in 2022):
| Orangeville: | 1996 |
| Baltimore: | 2009 |
Median year renter moved in (as recorded in 2022):
| Orangeville: | 2015 |
| Baltimore: | 2019 |
Percentage of married-couple families with both working:
| Orangeville: | 39.5% |
| Baltimore: | 79.2% |
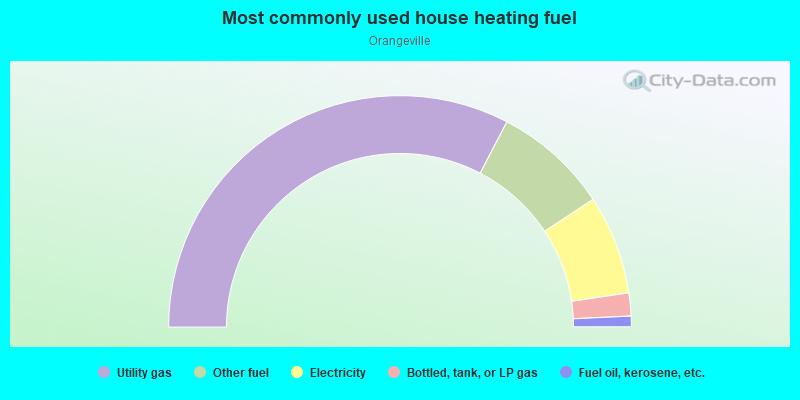
- 65.3%Utility gas
- 16.1%Other fuel
- 13.9%Electricity
- 3.2%Bottled, tank, or LP gas
- 1.5%Fuel oil, kerosene, etc.
Highways in this neighborhood:
US Hwy 40 (Pulaski Hwy)
Length: 1.32 miles
Direction: E-W
Address range: 3700 to 5520
Direction: E-W
Address range: 3700 to 5520
Roads and streets:
E Monument St
Length: 1.25 miles
Directions: E-W, SE-NW
Address range: 4200 to 5099
Directions: E-W, SE-NW
Address range: 4200 to 5099
N Kresson St
Length: 0.45 miles
Direction: N-S
Address range: 500 to 1099
Direction: N-S
Address range: 500 to 1099
Ashland Ave
Length: 0.39 miles
Directions: E-W, SW-NE
Address range: 4101 to 4699
Directions: E-W, SW-NE
Address range: 4101 to 4699
E Eager St
Length: 0.36 miles
Direction: E-W
Address range: 4100 to 4699
Direction: E-W
Address range: 4100 to 4699
E Chase St
Length: 0.27 miles
Directions: E-W, N-S, SE-NW
Address range: 4024 to 4299
Directions: E-W, N-S, SE-NW
Address range: 4024 to 4299
N Macon St
Length: 0.22 miles
Directions: N-S, SW-NE
Address range: 900 to 1199
Directions: N-S, SW-NE
Address range: 900 to 1199
N Newkirk St
Length: 0.19 miles
Directions: E-W, N-S, SE-NW
Address range: 800 to 999
Directions: E-W, N-S, SE-NW
Address range: 800 to 999
N Janney St
Length: 0.18 miles
Direction: N-S
Address range: 900 to 1099
Direction: N-S
Address range: 900 to 1099
Iris Ave
Length: 0.18 miles
Direction: N-S
Address range: 900 to 1099
Direction: N-S
Address range: 900 to 1099
Lyon St
Length: 0.12 miles
Direction: SW-NE
Address range: 4400 to 4495
Direction: SW-NE
Address range: 4400 to 4495
N Haven St
Length: 0.11 miles
Direction: N-S
Address range: 707 to 898
Direction: N-S
Address range: 707 to 898
N Lehigh St
Length: 0.10 miles
Direction: N-S
Address range: 900 to 1099
Direction: N-S
Address range: 900 to 1099
N Dean St
Length: 0.06 miles
Direction: N-S
Address range: 500 to 599
Direction: N-S
Address range: 500 to 599
Mc Elderry St
Length: 0.04 miles
Direction: E-W
Address range: 3700 to 3799
Direction: E-W
Address range: 3700 to 3799
Railroad features:
Baltimore and Ohio RR
Length: 0.79 miles
Direction: SE-NW
Direction: SE-NW
Penn Central RR
Length: 0.68 miles
Directions: N-S, SE-NW
Directions: N-S, SE-NW