Northwood Forest neighborhood in Silver Spring, Maryland (MD), 20901, 20902 detailed profile
Settings
X


Business Search - 14 Million verified businesses
Area: 0.421 square miles
Population: 2,710
Population density:
| Northwood Forest: | 6,429 people per square mile |
| Silver Spring: | 7,993 people per square mile |

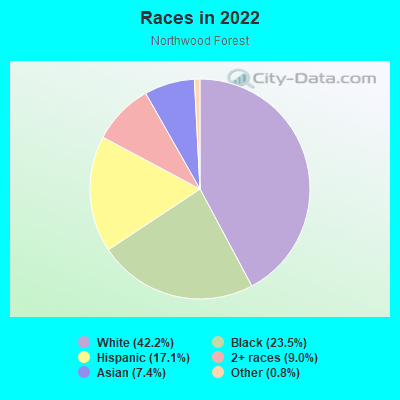
- 1,36242.2%White
- 75923.5%Black
- 55317.1%Hispanic or Latino
- 2899.0%Two or more races
- 2387.4%Asian
- 260.8%Some other race
- 10.03%American Indian
Median household income in 2022:
| Northwood Forest: | $130,432 |
| Silver Spring: | $81,557 |
Distribution of median household income
![Distribution of median household income]()
- 18Less than $10,000
- 128$10,000 to $19,999
- 54$20,000 to $29,999
- 16$30,000 to $39,999
- 46$40,000 to $49,999
- 63$50,000 to $59,999
- 29$60,000 to $74,999
- 61$75,000 to $99,999
- 104$100,000 to $124,999
- 67$125,000 to $149,999
- 140$150,000 to $199,999
- 332$200,000 or more

Distribution of owner-occupied house/condo value
![Distribution of owner-occupied house/condo value]()
- 69Less than $50,000
- 107$50,000 to $99,999
- 253$100,000 to $149,999
- 186$150,000 to $199,999
- 17$200,000 to $249,999
- 25$250,000 to $299,999
- 116$300,000 to $399,999
- 230$400,000 to $499,999
- 411$500,000 to $749,999
- 39$750,000 to $999,999
- 45$1,000,000 or more

Distribution of rent paid by renters
![Distribution of rent paid by renters]()
- 32$100 to $199
- 51$200 to $299
- 108$300 to $399
- 14$900 to $999
- 11$1,000 to $1,249
- 82$1,250 to $1,499
- 16$1,500 to $1,999
- 74$2,000 or more

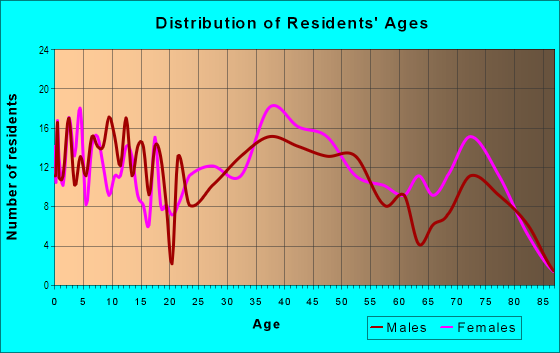
| Males: | 1,434 |
| Females: | 1,275 |
Males:
| This neighborhood: | 36.9 years |
| Whole city: | 36.7 years |
| This neighborhood: | 39.9 years |
| Whole city: | 36.5 years |
Average household size:
| Northwood Forest: | 9.2 people |
| Silver Spring: | 2.2 people |
Percentage of family households:
| Northwood Forest: | 54.2% |
| Silver Spring: | 38.8% |
| Here: | 67.2% |
| Silver Spring: | 32.5% |
Percentage of married-couple families with children (among all households):
| Northwood Forest: | 28.5% |
| Silver Spring: | 34.5% |
Percentage of single-mother households (among all households):
| Northwood Forest: | 4.8% |
| Silver Spring: | 6.6% |
Percentage of never married males 15 years old and over:
Percentage of never married females 15 years old and over:
| Northwood Forest: | 15.8% |
| Silver Spring: | 22.2% |
Percentage of never married females 15 years old and over:
| Northwood Forest: | 12.2% |
| place: | 24.3% |
Percentage of people that speak English not well or not at all:
| Northwood Forest: | 4.8% |
| Silver Spring: | 9.9% |
Percentage of people born in this state:
Percentage of people born in another U.S. state:
Percentage of native residents but born outside the U.S.:
Percentage of foreign born residents:
| Here: | 25.3% |
| Silver Spring: | 19.7% |
Percentage of people born in another U.S. state:
| Northwood Forest: | 43.9% |
| Silver Spring: | 45.9% |
Percentage of native residents but born outside the U.S.:
| Here: | 4.5% |
| place: | 2.4% |
Percentage of foreign born residents:
| Here: | 26.4% |
| Silver Spring: | 32.0% |
Owner-occupied
Renter-occupied

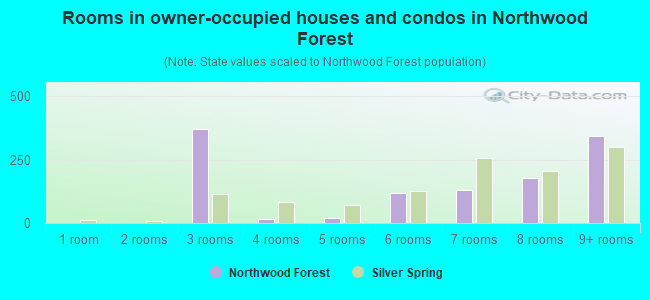
- Rooms in owner-occupied houses and condos in Northwood Forest
- 01 room
- 02 rooms
- 3713 rooms
- 164 rooms
- 205 rooms
- 1176 rooms
- 1317 rooms
- 1778 rooms
- 3449+ rooms
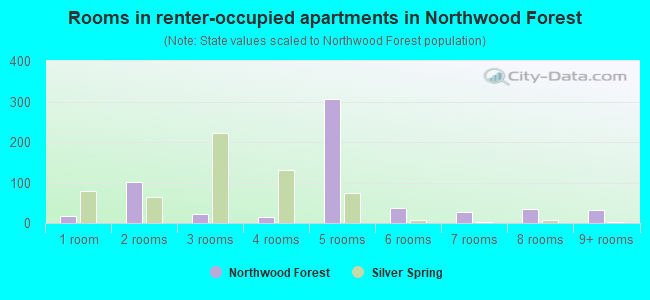
- Rooms in renter-occupied apartments in Northwood Forest
- 171 room
- 1022 rooms
- 223 rooms
- 154 rooms
- 3075 rooms
- 366 rooms
- 267 rooms
- 358 rooms
- 319+ rooms
Owner-occupied
Renter-occupied
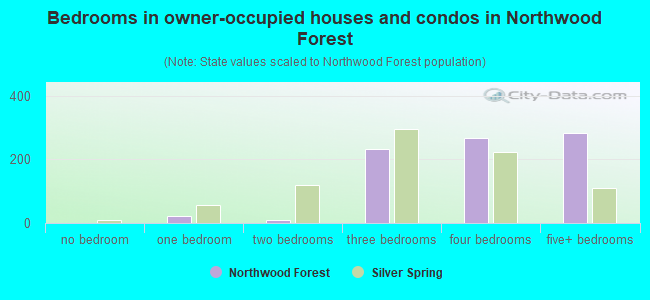
- Bedrooms in owner-occupied houses and condos in Northwood Forest
- 0no bedroom
- 221 bedroom
- 102 bedrooms
- 2333 bedrooms
- 2674 bedrooms
- 2825+ bedrooms
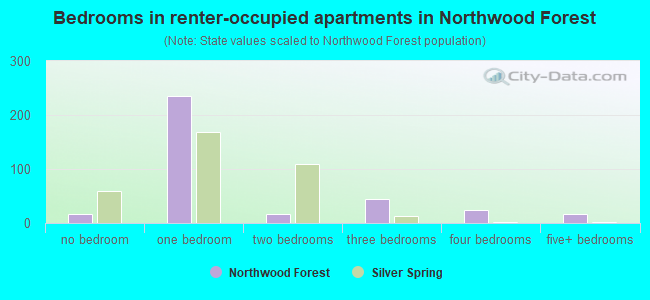
- Bedrooms in renter-occupied apartments in Northwood Forest
- 17no bedroom
- 2351 bedroom
- 162 bedrooms
- 443 bedrooms
- 244 bedrooms
- 175+ bedrooms
Average number of cars or other vehicles available in houses/condos:
Average number of cars or other vehicles available in apartments:
| This neighborhood: | 2.1 |
| Silver Spring: | 1.7 |
Average number of cars or other vehicles available in apartments:
| Here: | 1.6 |
| place: | 0.9 |
Percentage of units with a mortgage:
| Northwood Forest: | 75.3% |
| Silver Spring: | 76.3% |
Average estimated value of detached houses in 2022 (96.0% of all units):
| Northwood Forest: | $570,182 |
| Maryland: | $526,819 |
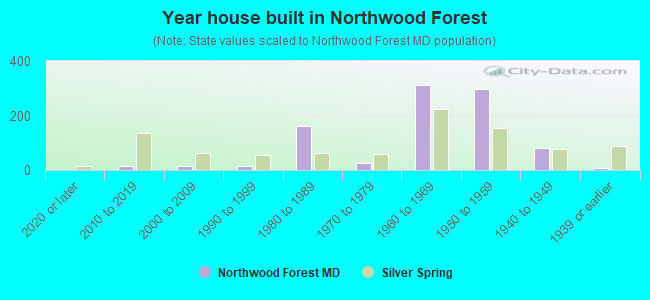
- Year house built in Northwood Forest
- 12020 or later
- 132010 to 2019
- 142000 to 2009
- 131990 to 1999
- 1631980 to 1989
- 241970 to 1979
- 3121960 to 1969
- 2981950 to 1959
- 801940 to 1949
- 91939 or earlier

Travel time to work (commute)
![Travel time to work (commute)]()
- 6Less than 5 minutes
- 75 to 9 minutes
- 6410 to 14 minutes
- 9915 to 19 minutes
- 13120 to 24 minutes
- 4025 to 29 minutes
- 17830 to 34 minutes
- 3835 to 39 minutes
- 7740 to 44 minutes
- 17745 to 59 minutes
- 15360 to 89 minutes
- 2390 or more minutes

Means of transportation to work
![Means of transportation to work]()
- 56.8%803Drove a car alone
- 10.5%149Carpooled
- 6.0%85Bus
- 4.7%67Subway or elevated rail
- 0.5%7Long-distance train or commuter rail
- 0.8%11Bicycle
- 0.8%12Walked
- 1.7%24Other means
- 21.6%305Worked at home

Time leaving home to go to work
![Time leaving home to go to work]()
- 1912:00 a.m. to 4:59 a.m.
- 175:00 a.m. to 5:29 a.m.
- 395:30 a.m. to 5:59 a.m.
- 866:00 a.m. to 6:29 a.m.
- 606:30 a.m. to 6:59 a.m.
- 1367:00 a.m. to 7:29 a.m.
- 1177:30 a.m. to 7:59 a.m.
- 1768:00 a.m. to 8:29 a.m.
- 1488:30 a.m. to 8:59 a.m.
- 759:00 a.m. to 9:59 a.m.
- 6110:00 a.m. to 10:59 a.m.
- 2011:00 a.m. to 11:59 a.m.
- 2712:00 p.m. to 3:59 p.m.
- 184:00 p.m. to 11:59 p.m.

Occupations of males:
- Percentage of males in management occupations (except farmers):
Here: 18.7% place: 11.4%
- Percentage of males in business and financial operations occupations:
Here: 3.8% place: 6.8%
- Percentage of males in computer and mathematical occupations:
Here: 10.9% place: 9.4%
- Percentage of males in architecture and engineering occupations:
Here: 3.4% place: 4.5%
- Percentage of males in life, physical, and social science occupations:
Here: 3.3% place: 5.3%
- Percentage of males in legal occupations:
Here: 3.5% place: 3.6%
- Percentage of males in education, training, and library occupations:
Here: 4.7% place: 6.2%
- Percentage of males in arts, design, entertainment, sports, and media occupations:
Here: 1.3% place: 3.9%
- Percentage of males in healthcare practitioners and technical occupations:
Here: 5.5% place: 2.5%
- Percentage of males in service occupations:
Here: 6.0% place: 10.9%
- Percentage of males in sales and office occupations:
Here: 26.0% place: 9.6%
- Percentage of males in construction, extraction, and maintenance occupations:
Here: 3.3% place: 11.6%
- Percentage of males in transportation occupations:
Here: 5.4% place: 6.4%
- Percentage of males in material moving occupations:
Here: 3.3% place: 2.2%
Occupations of females:
- Percentage of females in management occupations (except farmers):
Here: 14.2% place: 13.0%
- Percentage of females in business and financial operations occupations:
Here: 11.5% place: 8.9%
- Percentage of females in computer and mathematical occupations:
Here: 1.5% place: 5.0%
- Percentage of females in life, physical, and social science occupations:
Here: 4.4% place: 3.4%
- Percentage of females in community and social services occupations:
Here: 2.3% place: 2.9%
- Percentage of females in legal occupations:
Here: 1.3% place: 4.2%
- Percentage of females in education, training, and library occupations:
Here: 13.5% place: 11.2%
- Percentage of females in arts, design, entertainment, sports, and media occupations:
Here: 1.8% place: 4.5%
- Percentage of females in healthcare practitioners and technical occupations:
Here: 7.6% place: 5.3%
- Percentage of females in service occupations:
Here: 25.2% place: 20.4%
- Percentage of females in sales and office occupations:
Here: 16.1% place: 16.7%
Percentage of people 16-64 in Armed Forces:
| Northwood Forest: | 0.2% |
| Silver Spring: | 0.4% |
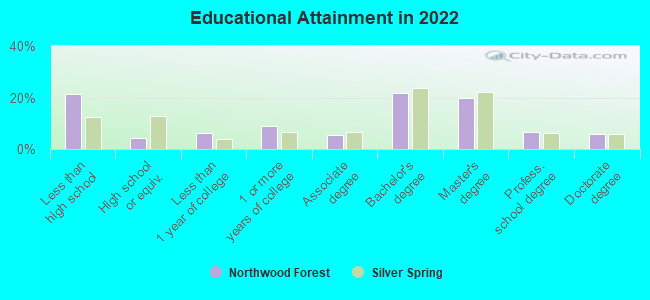
Education in this neighborhood (subdivision or community):
- Percentage of people 3 years and older in K-12 schools:
Northwood Forest: 18.7% Silver Spring: 14.1%
- Percentage of people 3 years and older in undergraduate colleges:
Northwood Forest: 6.1% Silver Spring: 3.4%
- Percentage of people 3 years and older in grad. or professional schools:
Northwood Forest: 4.6% Silver Spring: 2.0%
- Percentage of students K-12 enrolled in private schools:
Northwood Forest: 73.6% Silver Spring: 12.6%
Percentage of population below poverty level:
| Northwood Forest: | 4.0% |
| Silver Spring: | 11.0% |
Median year owner moved in (as recorded in 2022):
| Northwood Forest: | 2008 |
| Silver Spring: | 2011 |
Percentage of married-couple families with both working:
| Northwood Forest: | 94.0% |
| Silver Spring: | 80.2% |
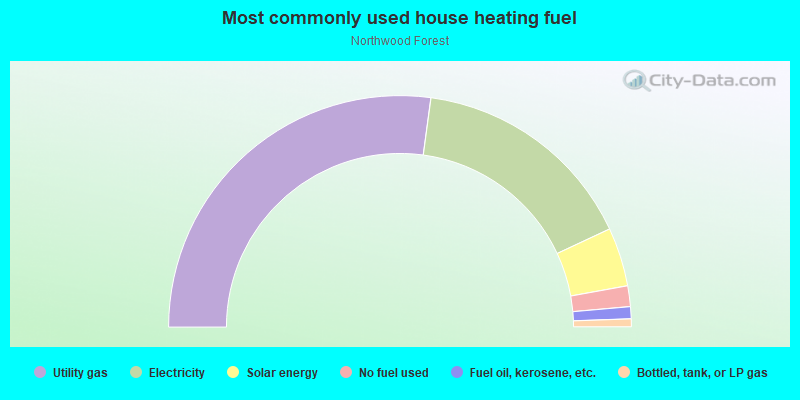
- 54.3%Utility gas
- 31.8%Electricity
- 8.2%Solar energy
- 2.9%No fuel used
- 1.7%Fuel oil, kerosene, etc.
- 1.1%Bottled, tank, or LP gas
Highways in this neighborhood:
University Blvd W (State Hwy 193)
Length: 0.69 miles
Directions: E-W, SE-NW
Address range: 800 to 1199
Directions: E-W, SE-NW
Address range: 800 to 1199
Roads and streets:
Loxford Ter
Length: 1.11 miles
Directions: E-W, N-S, SE-NW, SW-NE
Address range: 800 to 1198
Directions: E-W, N-S, SE-NW, SW-NE
Address range: 800 to 1198
Caddington Ave
Length: 0.79 miles
Directions: E-W, N-S, SW-NE
Address range: 800 to 1499
Directions: E-W, N-S, SW-NE
Address range: 800 to 1499
Hannes St
Length: 0.78 miles
Directions: E-W, SW-NE
Address range: 100 to 499
Directions: E-W, SW-NE
Address range: 100 to 499
Malta Ln
Length: 0.40 miles
Direction: E-W
Address range: 800 to 999
Direction: E-W
Address range: 800 to 999
Breewood Rd
Length: 0.35 miles
Directions: E-W, N-S, SE-NW
Address range: 10800 to 10999
Directions: E-W, N-S, SE-NW
Address range: 10800 to 10999
Gabel St
Length: 0.35 miles
Directions: E-W, SE-NW, SW-NE
Address range: 800 to 1099
Directions: E-W, SE-NW, SW-NE
Address range: 800 to 1099
Tenbrook Dr
Length: 0.33 miles
Directions: N-S, SE-NW
Address range: 10613 to 10899
Directions: N-S, SE-NW
Address range: 10613 to 10899
Chiswell Ln
Length: 0.33 miles
Directions: E-W, N-S, SE-NW, SW-NE
Address range: 1000 to 1199
Directions: E-W, N-S, SE-NW, SW-NE
Address range: 1000 to 1199
Playford Ln
Length: 0.31 miles
Directions: E-W, N-S, SE-NW, SW-NE
Address range: 901 to 1199
Directions: E-W, N-S, SE-NW, SW-NE
Address range: 901 to 1199
Snure Rd
Length: 0.21 miles
Direction: E-W
Address range: 900 to 999
Direction: E-W
Address range: 900 to 999
Gregory St
Length: 0.13 miles
Directions: N-S, SW-NE
Address range: 10700 to 10799
Directions: N-S, SW-NE
Address range: 10700 to 10799
Fiesta Rd
Length: 0.10 miles
Directions: N-S, SE-NW, SW-NE
Address range: 10900 to 10923
Directions: N-S, SE-NW, SW-NE
Address range: 10900 to 10923
Foxglove Ln
Length: 0.10 miles
Directions: N-S, SE-NW
Address range: 11100 to 11199
Directions: N-S, SE-NW
Address range: 11100 to 11199
Whittington Ter
Length: 0.10 miles
Direction: SE-NW
Address range: 800 to 899
Direction: SE-NW
Address range: 800 to 899
S Leisure World Blvd
Length: 0.07 miles
Direction: SE-NW
Address range: 10914 to 10999
Direction: SE-NW
Address range: 10914 to 10999
Hannes Ct
Length: 0.07 miles
Directions: N-S, SE-NW, SW-NE
Address range: 10900 to 10999
Directions: N-S, SE-NW, SW-NE
Address range: 10900 to 10999
Cavalier Dr
Length: 0.07 miles
Direction: SE-NW
Address range: 10900 to 10999
Direction: SE-NW
Address range: 10900 to 10999
Tenbrook Ct
Length: 0.05 miles
Direction: E-W
Address range: 10800 to 10899
Direction: E-W
Address range: 10800 to 10899
Breewood Ct
Length: 0.04 miles
Directions: N-S, SW-NE
Address range: 10900 to 10999
Directions: N-S, SW-NE
Address range: 10900 to 10999
Gabel Ct
Length: 0.03 miles
Directions: N-S, SW-NE
Address range: 900 to 999
Directions: N-S, SW-NE
Address range: 900 to 999
Eastwood Ave
Length: 0.03 miles
Direction: SE-NW
Address range: 10800 to 10899
Direction: SE-NW
Address range: 10800 to 10899