Northmoor Knolls neighborhood in Peoria, Illinois (IL), 61614 detailed profile
Settings
X


Business Search - 14 Million verified businesses
Area: 0.208 square miles
Population: 302
Population density:
| Northmoor Knolls: | 1,451 people per square mile |
| Peoria: | 2,460 people per square mile |

- 26671.3%White
- 4010.7%Two or more races
- 195.1%Black
- 195.1%Hispanic or Latino
- 164.3%Asian
- 133.5%Some other race

Median household income in 2022:
| Northmoor Knolls: | $77,171 |
| Peoria: | $55,955 |
Distribution of median household income
![Distribution of median household income]()
- 20Less than $10,000
- 43$10,000 to $19,999
- 63$20,000 to $29,999
- 35$30,000 to $39,999
- 31$40,000 to $49,999
- 11$50,000 to $59,999
- 23$60,000 to $74,999
- 85$75,000 to $99,999
- 47$100,000 to $124,999
- 16$125,000 to $149,999
- 10$150,000 to $199,999
- 14$200,000 or more

Distribution of owner-occupied house/condo value
![Distribution of owner-occupied house/condo value]()
- 22$50,000 to $99,999
- 4$100,000 to $149,999
- 53$150,000 to $199,999
- 49$200,000 to $249,999
- 25$250,000 to $299,999
- 7$300,000 to $399,999
- 1$400,000 to $499,999

Distribution of rent paid by renters
![Distribution of rent paid by renters]()
- 16$300 to $399
- 5$400 to $499
- 74$600 to $699
- 31$700 to $799
- 10$800 to $899
- 18$900 to $999
- 29$1,000 to $1,249
- 10$1,250 to $1,499
- 21$2,000 or more

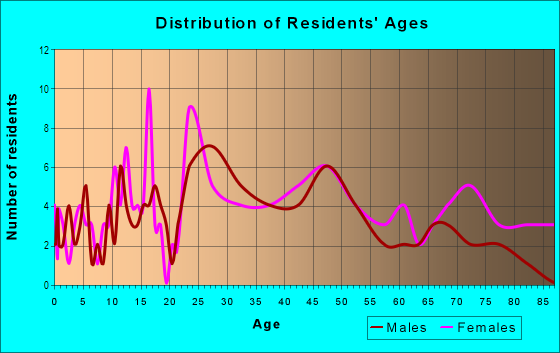
| Males: | 135 |
| Females: | 167 |
Males:
| This neighborhood: | 48.0 years |
| Whole city: | 33.8 years |
| This neighborhood: | 44.0 years |
| Whole city: | 36.0 years |
Average household size:
| Northmoor Knolls: | 1.8 people |
| Peoria: | 2.2 people |
Percentage of family households:
| Northmoor Knolls: | 25.6% |
| Peoria: | 41.0% |
| Here: | 31.5% |
| Peoria: | 33.8% |
Percentage of married-couple families with children (among all households):
| Northmoor Knolls: | 26.5% |
| Peoria: | 22.1% |
Percentage of single-mother households (among all households):
| Northmoor Knolls: | 29.0% |
| Peoria: | 16.8% |
Percentage of never married males 15 years old and over:
Percentage of never married females 15 years old and over:
| Northmoor Knolls: | 23.0% |
| Peoria: | 19.6% |
Percentage of never married females 15 years old and over:
| Northmoor Knolls: | 11.2% |
| city: | 19.0% |
Percentage of people that speak English not well or not at all:
| Northmoor Knolls: | 4.3% |
| Peoria: | 1.6% |
Percentage of people born in this state:
Percentage of people born in another U.S. state:
Percentage of native residents but born outside the U.S.:
Percentage of foreign born residents:
| Here: | 61.7% |
| Peoria: | 72.0% |
Percentage of people born in another U.S. state:
| Northmoor Knolls: | 23.7% |
| Peoria: | 18.8% |
Percentage of native residents but born outside the U.S.:
| Here: | 2.4% |
| city: | 1.4% |
Percentage of foreign born residents:
| Here: | 12.2% |
| Peoria: | 7.8% |

Owner-occupied
Renter-occupied


- Rooms in owner-occupied houses and condos in Northmoor Knolls
- 01 room
- 02 rooms
- 53 rooms
- 34 rooms
- 255 rooms
- 536 rooms
- 367 rooms
- 328 rooms
- 159+ rooms

- Rooms in renter-occupied apartments in Northmoor Knolls
- 141 room
- 102 rooms
- 813 rooms
- 534 rooms
- 465 rooms
- 76 rooms
- 77 rooms
- 08 rooms
- 09+ rooms
Owner-occupied
Renter-occupied

- Bedrooms in owner-occupied houses and condos in Northmoor Knolls
- 0no bedroom
- 51 bedroom
- 342 bedrooms
- 753 bedrooms
- 384 bedrooms
- 45+ bedrooms

- Bedrooms in renter-occupied apartments in Northmoor Knolls
- 14no bedroom
- 981 bedroom
- 172 bedrooms
- 363 bedrooms
- 04 bedrooms
- 05+ bedrooms
Average number of cars or other vehicles available in houses/condos:
Average number of cars or other vehicles available in apartments:
| This neighborhood: | 1.9 |
| Peoria: | 1.8 |
Average number of cars or other vehicles available in apartments:
| Here: | 1.0 |
| city: | 1.1 |
Percentage of units with a mortgage:
| Northmoor Knolls: | 41.5% |
| Peoria: | 63.0% |
Average estimated value of detached houses in 2022 (100.0% of all units):
| Northmoor Knolls: | $184,734 |
| Peoria: | $191,429 |

- Year house built in Northmoor Knolls
- 02020 or later
- 02010 to 2019
- 332000 to 2009
- 431990 to 1999
- 361980 to 1989
- 291970 to 1979
- 1181960 to 1969
- 191950 to 1959
- 01940 to 1949
- 21939 or earlier

City-data.com crime index for city in 2020 (higher means more crime):
| City: | 443.5 |
| U.S. average: | 219.5 |
Travel time to work (commute)
![Travel time to work (commute)]()
- 29Less than 5 minutes
- 475 to 9 minutes
- 6910 to 14 minutes
- 8915 to 19 minutes
- 5620 to 24 minutes
- 825 to 29 minutes
- 230 to 34 minutes
- 1335 to 39 minutes
- 240 to 44 minutes
- 845 to 59 minutes
- 860 to 89 minutes

Means of transportation to work
![Means of transportation to work]()
- 92.7%175Drove a car alone
- 11.1%21Carpooled
- 6.9%13Worked at home

Time leaving home to go to work
![Time leaving home to go to work]()
- 512:00 a.m. to 4:59 a.m.
- 25:00 a.m. to 5:29 a.m.
- 65:30 a.m. to 5:59 a.m.
- 216:00 a.m. to 6:29 a.m.
- 596:30 a.m. to 6:59 a.m.
- 357:00 a.m. to 7:29 a.m.
- 647:30 a.m. to 7:59 a.m.
- 518:00 a.m. to 8:29 a.m.
- 98:30 a.m. to 8:59 a.m.
- 69:00 a.m. to 9:59 a.m.
- 210:00 a.m. to 10:59 a.m.
- 2211:00 a.m. to 11:59 a.m.
- 2112:00 p.m. to 3:59 p.m.
- 314:00 p.m. to 11:59 p.m.

Occupations of males:
- Percentage of males in management occupations (except farmers):
Here: 39.9% city: 11.1%
- Percentage of males in business and financial operations occupations:
Here: 4.6% city: 4.5%
- Percentage of males in computer and mathematical occupations:
Here: 23.7% city: 6.1%
- Percentage of males in architecture and engineering occupations:
Here: 7.0% city: 9.0%
- Percentage of males in community and social services occupations:
Here: 3.9% city: 1.3%
- Percentage of males in legal occupations:
Here: 4.6% city: 1.2%
- Percentage of males in education, training, and library occupations:
Here: 13.6% city: 3.7%
- Percentage of males in arts, design, entertainment, sports, and media occupations:
Here: 9.1% city: 1.9%
- Percentage of males in healthcare practitioners and technical occupations:
Here: 3.5% city: 4.7%
- Percentage of males in service occupations:
Here: 47.4% city: 15.9%
- Percentage of males in sales and office occupations:
Here: 2.2% city: 12.1%
- Percentage of males in farming, fishing, and forestry occupations:
Here: 9.6% city: 1.0%
- Percentage of males in construction, extraction, and maintenance occupations:
Here: 7.0% city: 5.4%
- Percentage of males in production occupations:
Here: 9.3% city: 7.6%
- Percentage of males in transportation occupations:
Here: 11.3% city: 5.1%
- Percentage of males in material moving occupations:
Here: 14.1% city: 6.4%
Occupations of females:
- Percentage of females in management occupations (except farmers):
Here: 23.2% city: 8.2%
- Percentage of females in business and financial operations occupations:
Here: 7.3% city: 3.9%
- Percentage of females in community and social services occupations:
Here: 2.0% city: 3.4%
- Percentage of females in education, training, and library occupations:
Here: 10.9% city: 9.3%
- Percentage of females in arts, design, entertainment, sports, and media occupations:
Here: 22.0% city: 1.8%
- Percentage of females in healthcare practitioners and technical occupations:
Here: 46.0% city: 14.9%
- Percentage of females in service occupations:
Here: 44.1% city: 24.2%
- Percentage of females in sales and office occupations:
Here: 25.4% city: 23.2%
- Percentage of females in production occupations:
Here: 8.5% city: 2.4%
- Percentage of females in transportation occupations:
Here: 2.8% city: 0.4%
Education in this neighborhood (subdivision or community):
- Percentage of people 3 years and older in K-12 schools:
Northmoor Knolls: 37.4% Peoria: 17.8%
- Percentage of people 3 years and older in undergraduate colleges:
Northmoor Knolls: 18.5% Peoria: 7.5%
- Percentage of people 3 years and older in grad. or professional schools:
Northmoor Knolls: 3.0% Peoria: 2.5%
- Percentage of students K-12 enrolled in private schools:
Northmoor Knolls: 14.2% Peoria: 16.0%
Percentage of population below poverty level:
| Northmoor Knolls: | 7.3% |
| Peoria: | 17.4% |
Median year owner moved in (as recorded in 2022):
Median year renter moved in (as recorded in 2022):
| Northmoor Knolls: | 2003 |
| Peoria: | 2013 |
Median year renter moved in (as recorded in 2022):
| Northmoor Knolls: | 2011 |
| Peoria: | 2020 |
Percentage of married-couple families with both working:
| Northmoor Knolls: | 254.4% |
| Peoria: | 71.4% |

- 59.1%Utility gas
- 29.0%Electricity
- 6.3%Bottled, tank, or LP gas
- 5.6%No fuel used
Roads and streets:
N St Marys Rd
Length: 0.25 miles
Direction: N-S
Address range: 6118 to 6440
Direction: N-S
Address range: 6118 to 6440
W Broadmoor St
Length: 0.24 miles
Direction: E-W
Address range: 700 to 999
Direction: E-W
Address range: 700 to 999
W Kellar Pkwy
Length: 0.21 miles
Directions: E-W, SE-NW
Address range: 500 to 699
Directions: E-W, SE-NW
Address range: 500 to 699
W Sheridan Ct
Length: 0.18 miles
Direction: E-W
Address range: 500 to 699
Direction: E-W
Address range: 500 to 699
W Cordell Ave
Length: 0.16 miles
Direction: E-W
Address range: 1000 to 1199
Direction: E-W
Address range: 1000 to 1199
W Shermoor St
Length: 0.16 miles
Directions: E-W, SW-NE
Address range: 700 to 999
Directions: E-W, SW-NE
Address range: 700 to 999
W Bellehaven Ln
Length: 0.14 miles
Direction: E-W
Address range: 1000 to 1099
Direction: E-W
Address range: 1000 to 1099
W Laclaire Ln
Length: 0.10 miles
Directions: E-W, N-S, SE-NW
Address range: 600 to 699
Directions: E-W, N-S, SE-NW
Address range: 600 to 699
N Lexington Dr
Length: 0.09 miles
Direction: N-S
Address range: 6125 to 6299
Direction: N-S
Address range: 6125 to 6299
N Sheridan Rd
Length: 0.07 miles
Direction: N-S
Address range: 6227 to 6319
Direction: N-S
Address range: 6227 to 6319
N Burnley St
Length: 0.06 miles
Directions: N-S, SW-NE
Address range: 6100 to 6299
Directions: N-S, SW-NE
Address range: 6100 to 6299
W Pine Hill Ln
Length: 0.04 miles
Direction: E-W
Address range: 800 to 814
Direction: E-W
Address range: 800 to 814
N Neal Ave
Length: 0.02 miles
Direction: N-S
Address range: 6200 to 6299
Direction: N-S
Address range: 6200 to 6299