Little Italy neighborhood in Baltimore, Maryland (MD), 21231, 21202 detailed profile
Settings
X

Business Search - 14 Million verified businesses
Area: 0.055 square miles
Population: 2,384
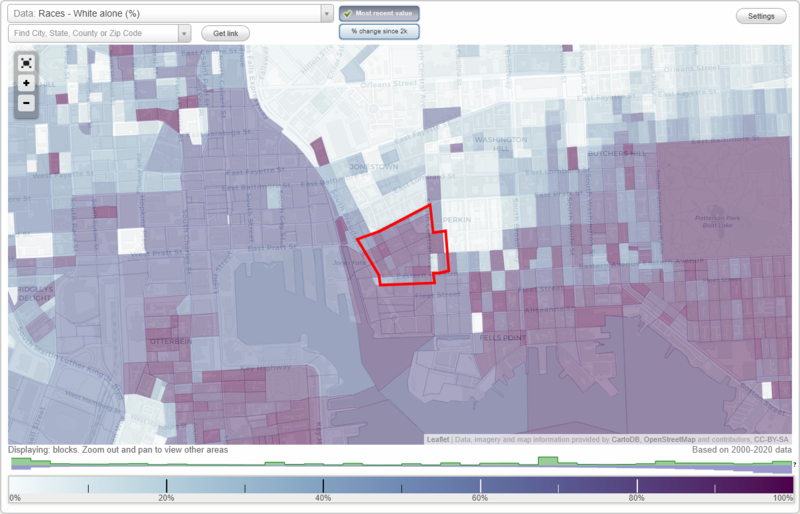
Population density:
| Little Italy: | 43,551 people per square mile |
| Baltimore: | 7,053 people per square mile |

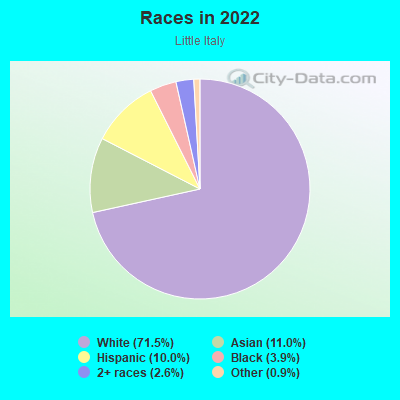
- 1,70971.5%White
- 26411.0%Asian
- 24010.0%Hispanic or Latino
- 933.9%Black
- 632.6%Two or more races
- 220.9%Some other race
Median household income in 2022:
| Little Italy: | $122,152 |
| Baltimore: | $55,198 |
Distribution of median household income
![Distribution of median household income]()
- 93Less than $10,000
- 69$10,000 to $19,999
- 32$20,000 to $29,999
- 78$30,000 to $39,999
- 13$40,000 to $49,999
- 20$50,000 to $59,999
- 14$60,000 to $74,999
- 266$75,000 to $99,999
- 84$100,000 to $124,999
- 121$125,000 to $149,999
- 114$150,000 to $199,999
- 515$200,000 or more

Distribution of owner-occupied house/condo value
![Distribution of owner-occupied house/condo value]()
- 15Less than $50,000
- 5$50,000 to $99,999
- 13$100,000 to $149,999
- 3$150,000 to $199,999
- 63$200,000 to $249,999
- 45$250,000 to $299,999
- 132$300,000 to $399,999
- 186$400,000 to $499,999
- 104$500,000 to $749,999
- 63$750,000 to $999,999
- 94$1,000,000 or more

Distribution of rent paid by renters
![Distribution of rent paid by renters]()
- 12Less than $100
- 39$100 to $199
- 54$200 to $299
- 4$300 to $399
- 30$400 to $499
- 4$500 to $599
- 17$700 to $799
- 20$900 to $999
- 6$1,000 to $1,249
- 32$1,250 to $1,499
- 369$1,500 to $1,999
- 260$2,000 or more

Median rent in 2022:
| Little Italy: | $1,891 |
| Baltimore: | $1,043 |
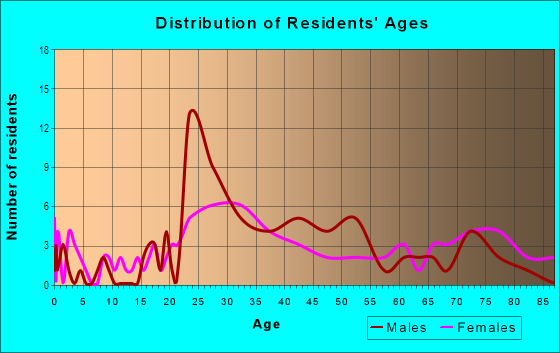
| Males: | 1,214 |
| Females: | 1,170 |
Males:
| This neighborhood: | 34.8 years |
| Whole city: | 35.0 years |
| This neighborhood: | 37.0 years |
| Whole city: | 38.2 years |
Average household size:
| Little Italy: | 1.6 people |
| Baltimore: | 2.2 people |
Percentage of family households:
| Little Italy: | 30.1% |
| Baltimore: | 34.2% |
| Here: | 36.3% |
| Baltimore: | 23.3% |
Percentage of married-couple families with children (among all households):
| Little Italy: | 14.6% |
| Baltimore: | 22.4% |
Percentage of single-mother households (among all households):
| Little Italy: | 41.5% |
| Baltimore: | 18.7% |
Percentage of never married males 15 years old and over:
Percentage of never married females 15 years old and over:
| Little Italy: | 24.0% |
| Baltimore: | 25.1% |
Percentage of never married females 15 years old and over:
| Little Italy: | 16.2% |
| city: | 27.5% |
Percentage of people that speak English not well or not at all:
| Little Italy: | 0.2% |
| Baltimore: | 2.3% |
Percentage of people born in this state:
Percentage of people born in another U.S. state:
Percentage of native residents but born outside the U.S.:
Percentage of foreign born residents:
| Here: | 46.2% |
| Baltimore: | 64.4% |
Percentage of people born in another U.S. state:
| Little Italy: | 41.6% |
| Baltimore: | 25.0% |
Percentage of native residents but born outside the U.S.:
| Here: | 3.9% |
| city: | 0.9% |
Percentage of foreign born residents:
| Here: | 8.2% |
| Baltimore: | 9.7% |
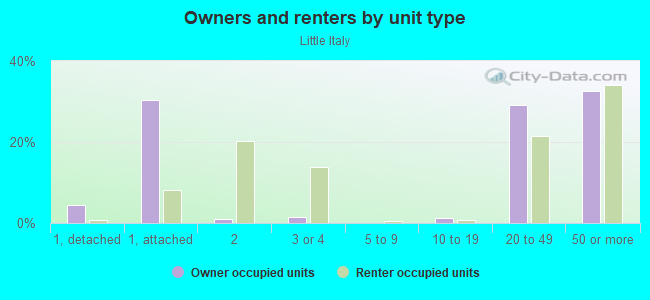
Owner-occupied
Renter-occupied

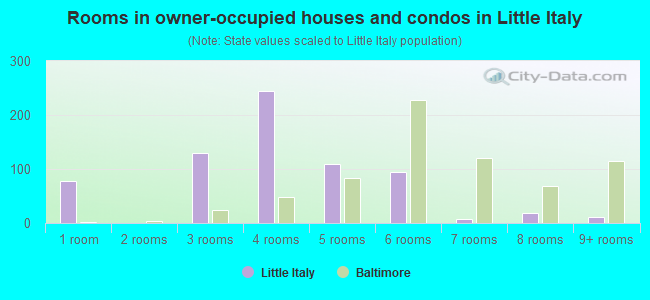
- Rooms in owner-occupied houses and condos in Little Italy
- 771 room
- 02 rooms
- 1293 rooms
- 2454 rooms
- 1095 rooms
- 946 rooms
- 77 rooms
- 188 rooms
- 129+ rooms
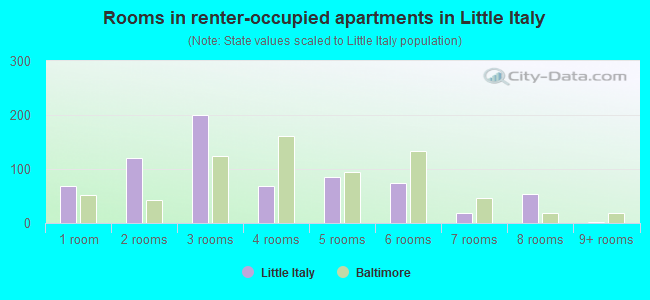
- Rooms in renter-occupied apartments in Little Italy
- 681 room
- 1212 rooms
- 2003 rooms
- 694 rooms
- 865 rooms
- 756 rooms
- 187 rooms
- 538 rooms
- 29+ rooms
Owner-occupied
Renter-occupied
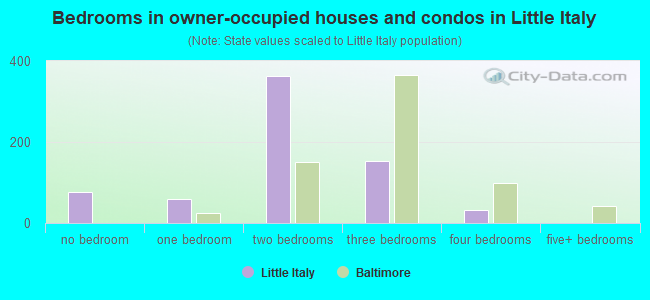
- Bedrooms in owner-occupied houses and condos in Little Italy
- 77no bedroom
- 601 bedroom
- 3622 bedrooms
- 1523 bedrooms
- 324 bedrooms
- 05+ bedrooms
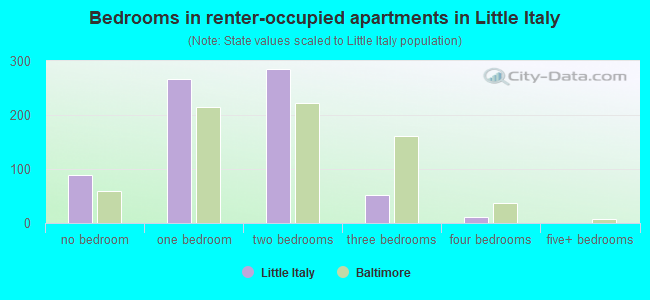
- Bedrooms in renter-occupied apartments in Little Italy
- 89no bedroom
- 2661 bedroom
- 2852 bedrooms
- 513 bedrooms
- 114 bedrooms
- 05+ bedrooms
Average number of cars or other vehicles available in houses/condos:
Average number of cars or other vehicles available in apartments:
| This neighborhood: | 1.5 |
| Baltimore: | 1.5 |
Average number of cars or other vehicles available in apartments:
| Here: | 1.2 |
| city: | 0.8 |
Percentage of units with a mortgage:
| Little Italy: | 61.7% |
| Baltimore: | 64.3% |
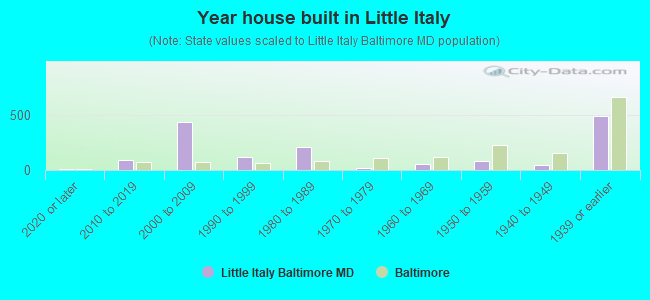
- Year house built in Little Italy
- 132020 or later
- 942010 to 2019
- 4392000 to 2009
- 1231990 to 1999
- 2141980 to 1989
- 191970 to 1979
- 571960 to 1969
- 821950 to 1959
- 431940 to 1949
- 4951939 or earlier
Travel time to work (commute)
![Travel time to work (commute)]()
- 14Less than 5 minutes
- 675 to 9 minutes
- 3610 to 14 minutes
- 5615 to 19 minutes
- 7820 to 24 minutes
- 725 to 29 minutes
- 6230 to 34 minutes
- 2335 to 39 minutes
- 1145 to 59 minutes
- 2460 to 89 minutes
- 1090 or more minutes

Means of transportation to work
![Means of transportation to work]()
- 50.3%868Drove a car alone
- 8.3%143Carpooled
- 1.1%19Bus
- 0.5%9Subway or elevated rail
- 0.1%2Long-distance train or commuter rail
- 0.2%3Ferryboat
- 0.7%12Bicycle
- 13.0%224Walked
- 0.3%5Other means
- 26.5%457Worked at home

Time leaving home to go to work
![Time leaving home to go to work]()
- 1112:00 a.m. to 4:59 a.m.
- 95:00 a.m. to 5:29 a.m.
- 195:30 a.m. to 5:59 a.m.
- 706:00 a.m. to 6:29 a.m.
- 236:30 a.m. to 6:59 a.m.
- 667:00 a.m. to 7:29 a.m.
- 457:30 a.m. to 7:59 a.m.
- 568:00 a.m. to 8:29 a.m.
- 168:30 a.m. to 8:59 a.m.
- 419:00 a.m. to 9:59 a.m.
- 1610:00 a.m. to 10:59 a.m.
- 911:00 a.m. to 11:59 a.m.
- 1312:00 p.m. to 3:59 p.m.
- 114:00 p.m. to 11:59 p.m.

Occupations of males:
- Percentage of males in management occupations (except farmers):
Here: 18.2% city: 10.7%
- Percentage of males in business and financial operations occupations:
Here: 12.9% city: 5.9%
- Percentage of males in computer and mathematical occupations:
Here: 14.4% city: 6.1%
- Percentage of males in architecture and engineering occupations:
Here: 4.2% city: 2.9%
- Percentage of males in life, physical, and social science occupations:
Here: 3.3% city: 2.3%
- Percentage of males in legal occupations:
Here: 3.4% city: 1.8%
- Percentage of males in education, training, and library occupations:
Here: 11.9% city: 5.4%
- Percentage of males in arts, design, entertainment, sports, and media occupations:
Here: 4.4% city: 2.8%
- Percentage of males in healthcare practitioners and technical occupations:
Here: 11.7% city: 4.0%
- Percentage of males in service occupations:
Here: 8.7% city: 14.7%
- Percentage of males in sales and office occupations:
Here: 10.7% city: 14.2%
- Percentage of males in construction, extraction, and maintenance occupations:
Here: 4.8% city: 5.6%
Occupations of females:
- Percentage of females in management occupations (except farmers):
Here: 20.0% city: 10.1%
- Percentage of females in business and financial operations occupations:
Here: 13.4% city: 6.6%
- Percentage of females in computer and mathematical occupations:
Here: 3.1% city: 2.4%
- Percentage of females in education, training, and library occupations:
Here: 14.1% city: 10.7%
- Percentage of females in arts, design, entertainment, sports, and media occupations:
Here: 3.6% city: 2.4%
- Percentage of females in healthcare practitioners and technical occupations:
Here: 28.2% city: 9.8%
- Percentage of females in service occupations:
Here: 10.1% city: 20.4%
- Percentage of females in sales and office occupations:
Here: 6.6% city: 22.3%
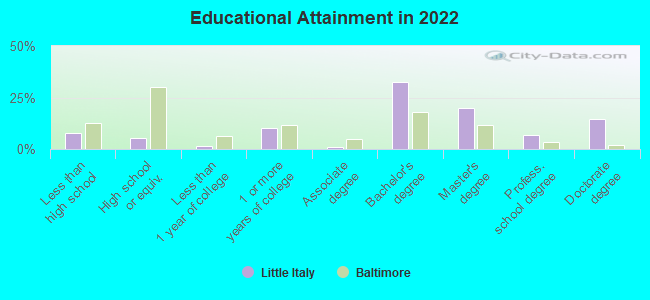
Education in this neighborhood (subdivision or community):
- Percentage of people 3 years and older in K-12 schools:
Little Italy: 8.9% Baltimore: 14.7%
- Percentage of people 3 years and older in undergraduate colleges:
Little Italy: 4.5% Baltimore: 6.0%
- Percentage of people 3 years and older in grad. or professional schools:
Little Italy: 2.7% Baltimore: 2.8%
- Percentage of students K-12 enrolled in private schools:
Little Italy: 57.5% Baltimore: 12.7%
Percentage of population below poverty level:
| Little Italy: | 21.0% |
| Baltimore: | 18.5% |
Median year owner moved in (as recorded in 2022):
| Little Italy: | 2013 |
| Baltimore: | 2009 |
Percentage of married-couple families with both working:
| Little Italy: | 69.9% |
| Baltimore: | 79.2% |
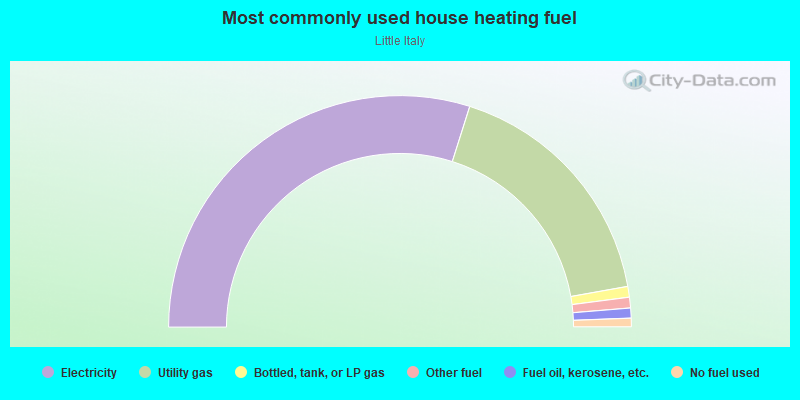
- 59.7%Electricity
- 34.6%Utility gas
- 1.5%Bottled, tank, or LP gas
- 1.5%Other fuel
- 1.4%Fuel oil, kerosene, etc.
- 1.2%No fuel used
Roads and streets:
Fawn St
Length: 0.25 miles
Direction: E-W
Address range: 809 to 1099
Direction: E-W
Address range: 809 to 1099
S Central Ave
Length: 0.24 miles
Direction: N-S
Address range: 200 to 509
Direction: N-S
Address range: 200 to 509
S Exeter St
Length: 0.21 miles
Directions: N-S, SE-NW
Address range: 213 to 518
Directions: N-S, SE-NW
Address range: 213 to 518
Eastern Ave
Length: 0.21 miles
Direction: E-W
Address range: 823 to 1099
Direction: E-W
Address range: 823 to 1099
Stiles St
Length: 0.20 miles
Direction: E-W
Address range: 809 to 1099
Direction: E-W
Address range: 809 to 1099
Duker Ct
Length: 0.17 miles
Direction: E-W
Address range: 900 to 1099
Direction: E-W
Address range: 900 to 1099
Albemarle St
Length: 0.15 miles
Directions: N-S, SE-NW
Address range: 224 to 519
Directions: N-S, SE-NW
Address range: 224 to 519
Bank St
Length: 0.15 miles
Direction: E-W
Address range: 1200 to 1399
Direction: E-W
Address range: 1200 to 1399
Allen Aly
Length: 0.14 miles
Direction: E-W
Address range: 1000 to 1199
Direction: E-W
Address range: 1000 to 1199
S High St
Length: 0.14 miles
Direction: SE-NW
Address range: 224 to 499
Direction: SE-NW
Address range: 224 to 499
Gough St
Length: 0.12 miles
Directions: E-W, SE-NW
Address range: 1200 to 1399
Directions: E-W, SE-NW
Address range: 1200 to 1399
Mince Aly
Length: 0.11 miles
Direction: E-W
Address range: 900 to 1099
Direction: E-W
Address range: 900 to 1099
Slemmers Aly
Length: 0.11 miles
Direction: SE-NW
Address range: 219 to 399
Direction: SE-NW
Address range: 219 to 399
Trinity St
Length: 0.11 miles
Direction: E-W
Address range: 800 to 999
Direction: E-W
Address range: 800 to 999
S Eden St
Length: 0.07 miles
Direction: N-S
Address range: 300 to 399
Direction: N-S
Address range: 300 to 399
Lloyd St
Length: 0.05 miles
Direction: SE-NW
Address range: 200 to 299
Direction: SE-NW
Address range: 200 to 299
Geigan Aly
Length: 0.04 miles
Direction: N-S
Address range: 400 to 431
Direction: N-S
Address range: 400 to 431
Trine Aly
Length: 0.03 miles
Direction: N-S
Address range: 400 to 499
Direction: N-S
Address range: 400 to 499