Kernewood neighborhood in Baltimore, Maryland (MD), 21212 detailed profile
Settings
X

Business Search - 14 Million verified businesses
Area: 0.075 square miles
Population: 615
Population density:
| Kernewood: | 8,249 people per square mile |
| Baltimore: | 7,053 people per square mile |

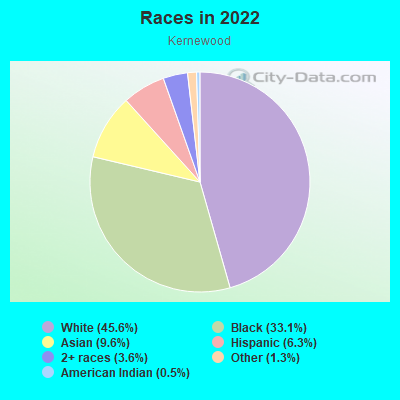
- 28945.6%White
- 21033.1%Black
- 619.6%Asian
- 406.3%Hispanic or Latino
- 233.6%Two or more races
- 81.3%Some other race
- 30.5%American Indian
Distribution of median household income
![Distribution of median household income]()
- 25Less than $10,000
- 17$10,000 to $19,999
- 19$20,000 to $29,999
- 7$30,000 to $39,999
- 14$40,000 to $49,999
- 9$50,000 to $59,999
- 23$60,000 to $74,999
- 14$75,000 to $99,999
- 16$100,000 to $124,999
- 4$125,000 to $149,999
- 12$150,000 to $199,999
- 8$200,000 or more

Distribution of owner-occupied house/condo value
![Distribution of owner-occupied house/condo value]()
- 12Less than $50,000
- 100$50,000 to $99,999
- 8$100,000 to $149,999
- 14$150,000 to $199,999
- 15$200,000 to $249,999
- 13$250,000 to $299,999
- 16$300,000 to $399,999
- 3$400,000 to $499,999
- 3$500,000 to $749,999
- 2$750,000 to $999,999
- 13$1,000,000 or more

Distribution of rent paid by renters
![Distribution of rent paid by renters]()
- 15Less than $100
- 34$100 to $199
- 16$200 to $299
- 15$300 to $399
- 11$400 to $499
- 2$500 to $599
- 9$600 to $699
- 27$700 to $799
- 6$800 to $899
- 18$900 to $999
- 15$1,000 to $1,249
- 14$1,250 to $1,499
- 13$1,500 to $1,999
- 6$2,000 or more

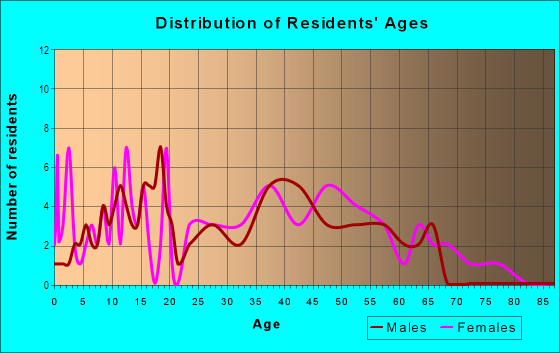
| Males: | 241 |
| Females: | 373 |
Males:
| This neighborhood: | |
| Whole city: |
| This neighborhood: | 33.8 years |
| Whole city: | 38.2 years |
Average household size:
| Kernewood: | 2.3 people |
| Baltimore: | 2.2 people |
Percentage of family households:
| Kernewood: | 31.6% |
| Baltimore: | 34.2% |
| Here: | 26.2% |
| Baltimore: | 23.3% |
Percentage of married-couple families with children (among all households):
| Kernewood: | 7.1% |
| Baltimore: | 22.4% |
Percentage of single-mother households (among all households):
| Kernewood: | 6.2% |
| Baltimore: | 18.7% |
Percentage of never married males 15 years old and over:
Percentage of never married females 15 years old and over:
| Kernewood: | 34.7% |
| Baltimore: | 25.1% |
Percentage of never married females 15 years old and over:
| Kernewood: | 55.8% |
| city: | 27.5% |
Percentage of people that speak English not well or not at all:
| Kernewood: | 0.7% |
| Baltimore: | 2.3% |
Percentage of people born in this state:
Percentage of people born in another U.S. state:
Percentage of native residents but born outside the U.S.:
Percentage of foreign born residents:
| Here: | 35.8% |
| Baltimore: | 64.4% |
Percentage of people born in another U.S. state:
| Kernewood: | 50.9% |
| Baltimore: | 25.0% |
Percentage of native residents but born outside the U.S.:
| Here: | 2.7% |
| city: | 0.9% |
Percentage of foreign born residents:
| Here: | 10.6% |
| Baltimore: | 9.7% |
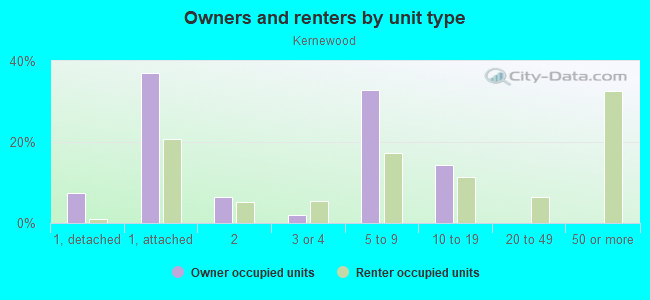
Owner-occupied
Renter-occupied

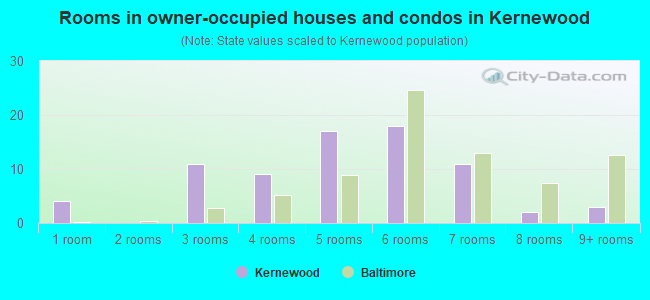
- Rooms in owner-occupied houses and condos in Kernewood
- 41 room
- 02 rooms
- 113 rooms
- 94 rooms
- 175 rooms
- 186 rooms
- 117 rooms
- 28 rooms
- 39+ rooms
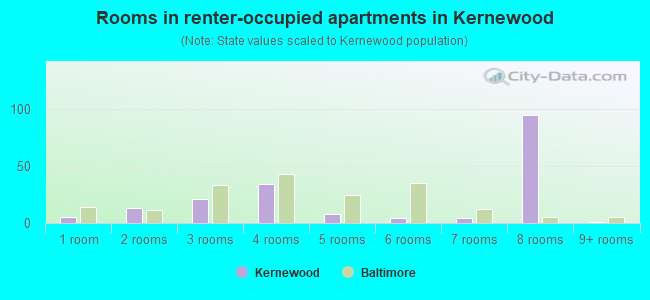
- Rooms in renter-occupied apartments in Kernewood
- 51 room
- 132 rooms
- 213 rooms
- 344 rooms
- 85 rooms
- 46 rooms
- 47 rooms
- 958 rooms
- 19+ rooms
Owner-occupied
Renter-occupied
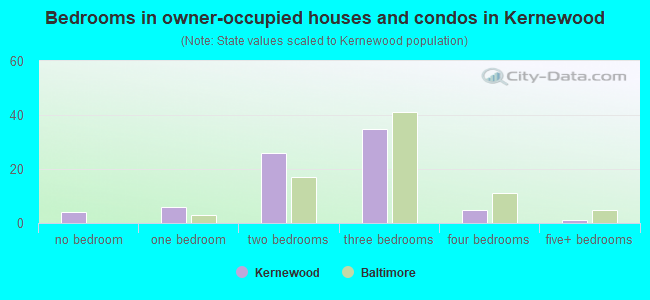
- Bedrooms in owner-occupied houses and condos in Kernewood
- 4no bedroom
- 61 bedroom
- 262 bedrooms
- 353 bedrooms
- 54 bedrooms
- 15+ bedrooms
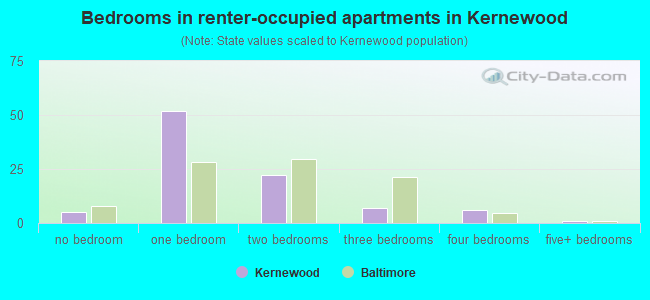
- Bedrooms in renter-occupied apartments in Kernewood
- 5no bedroom
- 521 bedroom
- 222 bedrooms
- 73 bedrooms
- 64 bedrooms
- 15+ bedrooms
Average number of cars or other vehicles available in houses/condos:
Average number of cars or other vehicles available in apartments:
| This neighborhood: | 3.3 |
| Baltimore: | 1.5 |
Average number of cars or other vehicles available in apartments:
| Here: | 0.7 |
| city: | 0.8 |
Percentage of units with a mortgage:
| Kernewood: | 33.5% |
| Baltimore: | 64.3% |
Housing prices:
- Average estimated value of detached houses in 2022 (5.7% of all units):
Kernewood: $295,244 Baltimore: $350,815
- Average estimated value of townhouses or other attached units in 2022 (54.3% of all units):
This neighborhood: $121,447 city: $206,258
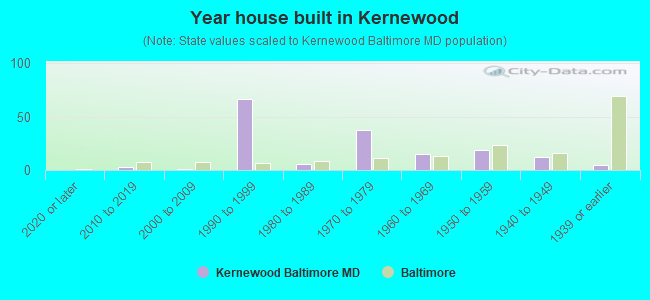
- Year house built in Kernewood
- 02020 or later
- 32010 to 2019
- 12000 to 2009
- 661990 to 1999
- 61980 to 1989
- 371970 to 1979
- 151960 to 1969
- 191950 to 1959
- 121940 to 1949
- 51939 or earlier
Travel time to work (commute)
![Travel time to work (commute)]()
- 2Less than 5 minutes
- 105 to 9 minutes
- 1910 to 14 minutes
- 2615 to 19 minutes
- 1120 to 24 minutes
- 1125 to 29 minutes
- 1530 to 34 minutes
- 235 to 39 minutes
- 440 to 44 minutes
- 1145 to 59 minutes
- 460 to 89 minutes
- 390 or more minutes

Means of transportation to work
![Means of transportation to work]()
- 45.2%97Drove a car alone
- 11.2%24Carpooled
- 8.4%18Bus
- 0.5%1Subway or elevated rail
- 0.9%2Long-distance train or commuter rail
- 0.5%1Taxi
- 3.7%8Motorcycle
- 0.5%1Bicycle
- 38.2%82Walked
- 1.9%4Other means
- 24.7%53Worked at home

Time leaving home to go to work
![Time leaving home to go to work]()
- 412:00 a.m. to 4:59 a.m.
- 25:30 a.m. to 5:59 a.m.
- 36:00 a.m. to 6:29 a.m.
- 86:30 a.m. to 6:59 a.m.
- 67:00 a.m. to 7:29 a.m.
- 207:30 a.m. to 7:59 a.m.
- 118:00 a.m. to 8:29 a.m.
- 58:30 a.m. to 8:59 a.m.
- 209:00 a.m. to 9:59 a.m.
- 810:00 a.m. to 10:59 a.m.
- 411:00 a.m. to 11:59 a.m.
- 2012:00 p.m. to 3:59 p.m.
- 94:00 p.m. to 11:59 p.m.

Occupations of males:
- Percentage of males in management occupations (except farmers):
Here: 10.3% city: 10.7%
- Percentage of males in business and financial operations occupations:
Here: 4.6% city: 5.9%
- Percentage of males in computer and mathematical occupations:
Here: 2.5% city: 6.1%
- Percentage of males in architecture and engineering occupations:
Here: 1.1% city: 2.9%
- Percentage of males in life, physical, and social science occupations:
Here: 4.7% city: 2.3%
- Percentage of males in community and social services occupations:
Here: 2.5% city: 1.6%
- Percentage of males in education, training, and library occupations:
Here: 11.2% city: 5.4%
- Percentage of males in arts, design, entertainment, sports, and media occupations:
Here: 4.5% city: 2.8%
- Percentage of males in healthcare practitioners and technical occupations:
Here: 1.7% city: 4.0%
- Percentage of males in service occupations:
Here: 19.1% city: 14.7%
- Percentage of males in sales and office occupations:
Here: 21.4% city: 14.2%
- Percentage of males in farming, fishing, and forestry occupations:
Here: 1.6% city: 0.1%
- Percentage of males in production occupations:
Here: 1.2% city: 4.2%
- Percentage of males in transportation occupations:
Here: 9.1% city: 6.8%
- Percentage of males in material moving occupations:
Here: 1.5% city: 7.0%
Occupations of females:
- Percentage of females in management occupations (except farmers):
Here: 11.0% city: 10.1%
- Percentage of females in business and financial operations occupations:
Here: 7.9% city: 6.6%
- Percentage of females in computer and mathematical occupations:
Here: 2.6% city: 2.4%
- Percentage of females in architecture and engineering occupations:
Here: 2.8% city: 0.9%
- Percentage of females in life, physical, and social science occupations:
Here: 1.3% city: 2.5%
- Percentage of females in community and social services occupations:
Here: 2.8% city: 3.6%
- Percentage of females in education, training, and library occupations:
Here: 19.8% city: 10.7%
- Percentage of females in healthcare practitioners and technical occupations:
Here: 9.0% city: 9.8%
- Percentage of females in service occupations:
Here: 25.1% city: 20.4%
- Percentage of females in sales and office occupations:
Here: 15.5% city: 22.3%
Percentage of people 16-64 in Armed Forces:
| Kernewood: | 0.1% |
| Baltimore: | 0.4% |
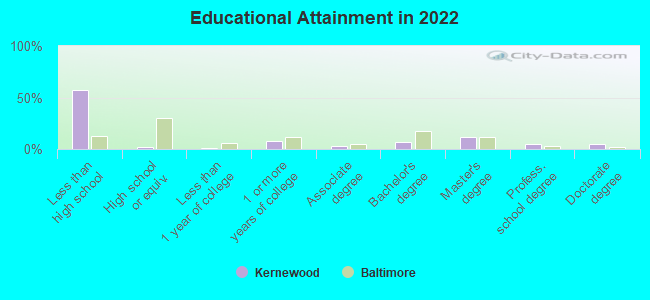
Education in this neighborhood (subdivision or community):
- Percentage of people 3 years and older in K-12 schools:
Kernewood: 14.4% Baltimore: 14.7%
- Percentage of people 3 years and older in undergraduate colleges:
Kernewood: 89.7% Baltimore: 6.0%
- Percentage of people 3 years and older in grad. or professional schools:
Kernewood: 5.2% Baltimore: 2.8%
- Percentage of students K-12 enrolled in private schools:
Kernewood: 73.9% Baltimore: 12.7%
Percentage of population below poverty level:
| Kernewood: | 17.9% |
| Baltimore: | 18.5% |
Percentage of married-couple families with both working:
| Kernewood: | 76.3% |
| Baltimore: | 79.2% |
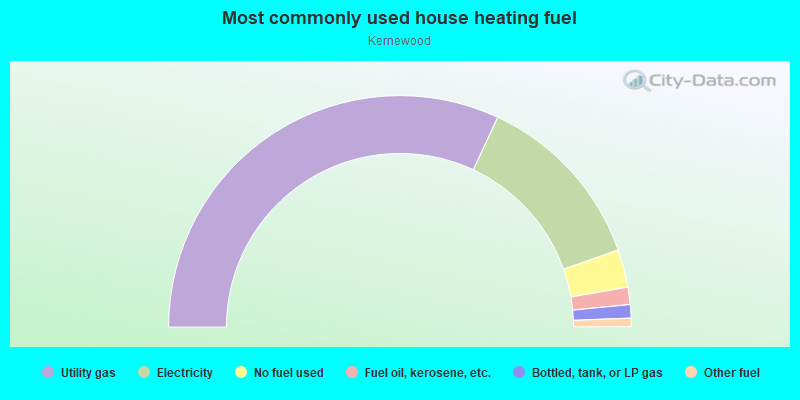
- 63.9%Utility gas
- 25.3%Electricity
- 5.3%No fuel used
- 2.4%Fuel oil, kerosene, etc.
- 1.9%Bottled, tank, or LP gas
- 1.2%Other fuel
Highways in this neighborhood:
State Hwy 45 (York Rd)
Length: 0.17 miles
Direction: N-S
Address range: 4640 to 4798
Direction: N-S
Address range: 4640 to 4798
Roads and streets:
E Cold Spring Ln
Length: 0.53 miles
Direction: E-W
Address range: 200 to 499
Direction: E-W
Address range: 200 to 499
E Old Coldspring Ln
Length: 0.40 miles
Directions: E-W, SE-NW
Address range: 200 to 441
Directions: E-W, SE-NW
Address range: 200 to 441
Kernwood Ave
Length: 0.14 miles
Direction: N-S
Address range: 4600 to 4799
Direction: N-S
Address range: 4600 to 4799
Eastway Ct
Length: 0.14 miles
Direction: E-W
Address range: 300 to 399
Direction: E-W
Address range: 300 to 399
Eastway
Length: 0.07 miles
Direction: N-S
Address range: 4500 to 4599
Direction: N-S
Address range: 4500 to 4599
Underwood Ct
Length: 0.06 miles
Directions: E-W, N-S, SW-NE
Address range: 300 to 399
Directions: E-W, N-S, SW-NE
Address range: 300 to 399
Underwood Rd
Length: 0.06 miles
Direction: N-S
Address range: 4500 to 4599
Direction: N-S
Address range: 4500 to 4599
Willow Ave
Length: 0.01 miles
Direction: E-W
Direction: E-W