Indian Spring Terrace neighborhood in Silver Spring, Maryland (MD), 20901 detailed profile
Settings
X


Business Search - 14 Million verified businesses
Area: 0.372 square miles
Population: 2,396
Population density:
| Indian Spring Terrace: | 6,442 people per square mile |
| Silver Spring: | 7,993 people per square mile |

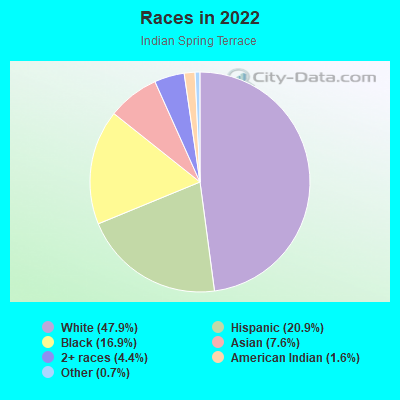
- 1,17247.9%White
- 51120.9%Hispanic or Latino
- 41516.9%Black
- 1877.6%Asian
- 1074.4%Two or more races
- 391.6%American Indian
- 180.7%Some other race
Distribution of median household income
![Distribution of median household income]()
- 25Less than $10,000
- 42$10,000 to $19,999
- 68$20,000 to $29,999
- 309$30,000 to $39,999
- 137$40,000 to $49,999
- 45$50,000 to $59,999
- 29$60,000 to $74,999
- 71$75,000 to $99,999
- 67$100,000 to $124,999
- 55$125,000 to $149,999
- 95$150,000 to $199,999
- 419$200,000 or more

Distribution of owner-occupied house/condo value
![Distribution of owner-occupied house/condo value]()
- 30Less than $50,000
- 86$50,000 to $99,999
- 31$100,000 to $149,999
- 29$150,000 to $199,999
- 34$200,000 to $249,999
- 24$250,000 to $299,999
- 121$300,000 to $399,999
- 144$400,000 to $499,999
- 486$500,000 to $749,999
- 33$750,000 to $999,999
- 127$1,000,000 or more

Distribution of rent paid by renters
![Distribution of rent paid by renters]()
- 9$200 to $299
- 29$300 to $399
- 34$500 to $599
- 7$700 to $799
- 151$800 to $899
- 97$900 to $999
- 61$1,000 to $1,249
- 105$1,250 to $1,499
- 57$1,500 to $1,999
- 73$2,000 or more

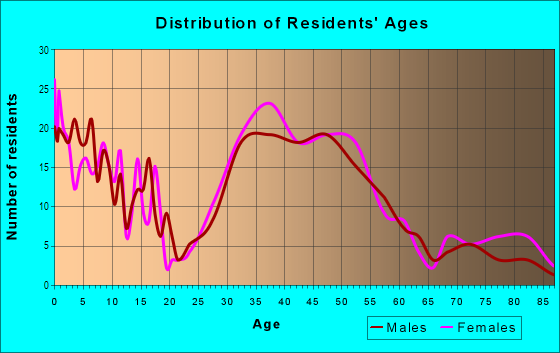
| Males: | 1,148 |
| Females: | 1,247 |
Males:
| This neighborhood: | 38.0 years |
| Whole city: | 36.7 years |
| This neighborhood: | 40.4 years |
| Whole city: | 36.5 years |
Average household size:
| Indian Spring Terrace: | 6.2 people |
| Silver Spring: | 2.2 people |
Percentage of family households:
| Indian Spring Terrace: | 55.7% |
| Silver Spring: | 38.8% |
| Here: | 50.8% |
| Silver Spring: | 32.5% |
Percentage of married-couple families with children (among all households):
| Indian Spring Terrace: | 32.3% |
| Silver Spring: | 34.5% |
Percentage of single-mother households (among all households):
| Indian Spring Terrace: | 3.8% |
| Silver Spring: | 6.6% |
Percentage of never married males 15 years old and over:
Percentage of never married females 15 years old and over:
| Indian Spring Terrace: | 15.8% |
| Silver Spring: | 22.2% |
Percentage of never married females 15 years old and over:
| Indian Spring Terrace: | 11.4% |
| place: | 24.3% |
Percentage of people that speak English not well or not at all:
| Indian Spring Terrace: | 9.0% |
| Silver Spring: | 9.9% |
Percentage of people born in this state:
Percentage of people born in another U.S. state:
Percentage of native residents but born outside the U.S.:
Percentage of foreign born residents:
| Here: | 22.9% |
| Silver Spring: | 19.7% |
Percentage of people born in another U.S. state:
| Indian Spring Terrace: | 52.2% |
| Silver Spring: | 45.9% |
Percentage of native residents but born outside the U.S.:
| Here: | 3.6% |
| place: | 2.4% |
Percentage of foreign born residents:
| Here: | 21.3% |
| Silver Spring: | 32.0% |
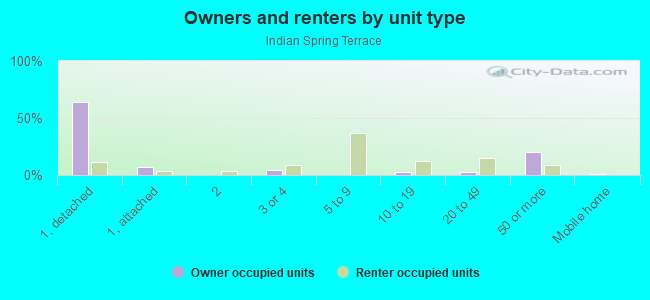
Owner-occupied
Renter-occupied

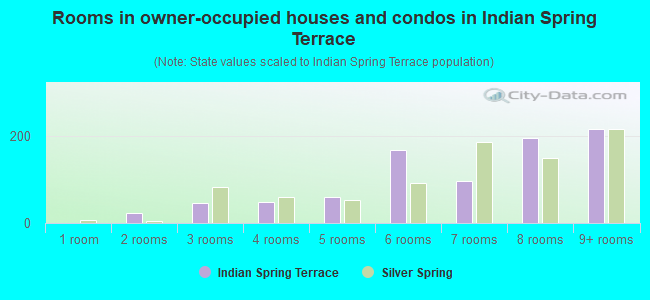
- Rooms in owner-occupied houses and condos in Indian Spring Terrace
- 01 room
- 232 rooms
- 473 rooms
- 494 rooms
- 605 rooms
- 1686 rooms
- 977 rooms
- 1978 rooms
- 2169+ rooms
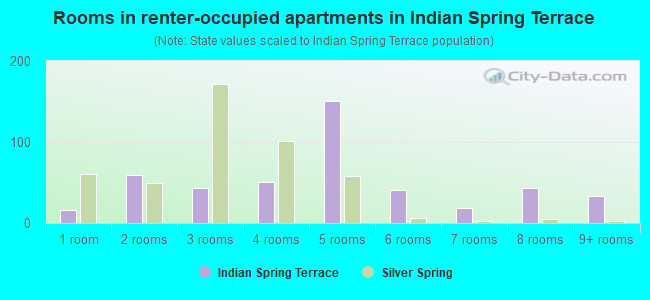
- Rooms in renter-occupied apartments in Indian Spring Terrace
- 161 room
- 592 rooms
- 433 rooms
- 514 rooms
- 1515 rooms
- 416 rooms
- 197 rooms
- 438 rooms
- 339+ rooms
Owner-occupied
Renter-occupied
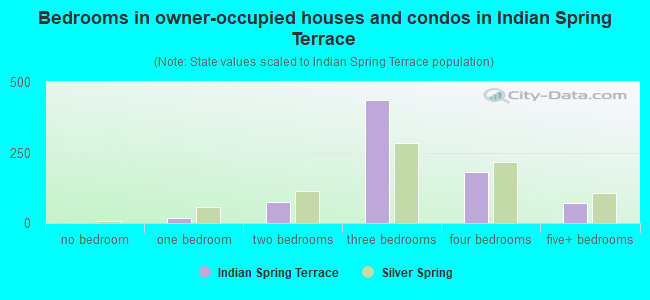
- Bedrooms in owner-occupied houses and condos in Indian Spring Terrace
- 0no bedroom
- 191 bedroom
- 752 bedrooms
- 4373 bedrooms
- 1824 bedrooms
- 705+ bedrooms
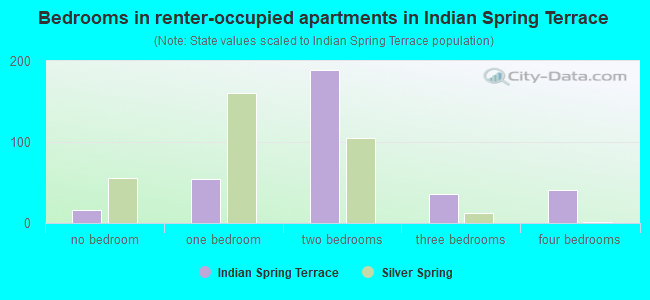
- Bedrooms in renter-occupied apartments in Indian Spring Terrace
- 16no bedroom
- 541 bedroom
- 1892 bedrooms
- 363 bedrooms
- 414 bedrooms
- 05+ bedrooms
Average number of cars or other vehicles available in houses/condos:
Average number of cars or other vehicles available in apartments:
| This neighborhood: | 1.8 |
| Silver Spring: | 1.7 |
Average number of cars or other vehicles available in apartments:
| Here: | |
| place: |
Percentage of units with a mortgage:
| Indian Spring Terrace: | 78.6% |
| Silver Spring: | 76.3% |
Average estimated value of detached houses in 2022 (79.7% of all units):
| Indian Spring Terrace: | $580,979 |
| Maryland: | $526,819 |
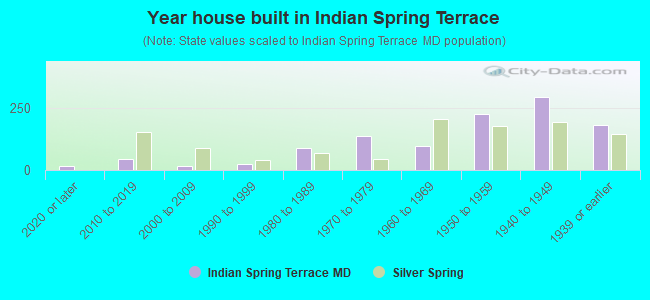
- Year house built in Indian Spring Terrace
- 162020 or later
- 352010 to 2019
- 152000 to 2009
- 311990 to 1999
- 771980 to 1989
- 1071970 to 1979
- 1151960 to 1969
- 2751950 to 1959
- 2751940 to 1949
- 1641939 or earlier
Travel time to work (commute)
![Travel time to work (commute)]()
- 8Less than 5 minutes
- 295 to 9 minutes
- 7910 to 14 minutes
- 8215 to 19 minutes
- 6920 to 24 minutes
- 6825 to 29 minutes
- 13430 to 34 minutes
- 6835 to 39 minutes
- 5740 to 44 minutes
- 19045 to 59 minutes
- 8960 to 89 minutes
- 4790 or more minutes

Means of transportation to work
![Means of transportation to work]()
- 48.2%706Drove a car alone
- 8.5%125Carpooled
- 9.1%134Bus
- 5.1%74Subway or elevated rail
- 1.6%23Long-distance train or commuter rail
- 2.5%36Taxi
- 1.4%21Bicycle
- 1.8%26Walked
- 2.1%31Other means
- 30.0%439Worked at home

Time leaving home to go to work
![Time leaving home to go to work]()
- 6312:00 a.m. to 4:59 a.m.
- 125:00 a.m. to 5:29 a.m.
- 335:30 a.m. to 5:59 a.m.
- 446:00 a.m. to 6:29 a.m.
- 526:30 a.m. to 6:59 a.m.
- 1587:00 a.m. to 7:29 a.m.
- 1737:30 a.m. to 7:59 a.m.
- 1438:00 a.m. to 8:29 a.m.
- 878:30 a.m. to 8:59 a.m.
- 789:00 a.m. to 9:59 a.m.
- 3110:00 a.m. to 10:59 a.m.
- 2911:00 a.m. to 11:59 a.m.
- 2612:00 p.m. to 3:59 p.m.
- 304:00 p.m. to 11:59 p.m.

Occupations of males:
- Percentage of males in management occupations (except farmers):
Here: 7.5% place: 11.4%
- Percentage of males in business and financial operations occupations:
Here: 11.9% place: 6.8%
- Percentage of males in computer and mathematical occupations:
Here: 10.3% place: 9.4%
- Percentage of males in architecture and engineering occupations:
Here: 2.4% place: 4.5%
- Percentage of males in life, physical, and social science occupations:
Here: 10.1% place: 5.3%
- Percentage of males in community and social services occupations:
Here: 1.1% place: 1.2%
- Percentage of males in legal occupations:
Here: 5.7% place: 3.6%
- Percentage of males in education, training, and library occupations:
Here: 10.3% place: 6.2%
- Percentage of males in arts, design, entertainment, sports, and media occupations:
Here: 7.1% place: 3.9%
- Percentage of males in healthcare practitioners and technical occupations:
Here: 4.1% place: 2.5%
- Percentage of males in service occupations:
Here: 13.3% place: 10.9%
- Percentage of males in sales and office occupations:
Here: 6.1% place: 9.6%
- Percentage of males in construction, extraction, and maintenance occupations:
Here: 2.1% place: 11.6%
- Percentage of males in production occupations:
Here: 1.9% place: 2.2%
- Percentage of males in transportation occupations:
Here: 3.7% place: 6.4%
- Percentage of males in material moving occupations:
Here: 2.2% place: 2.2%
Occupations of females:
- Percentage of females in management occupations (except farmers):
Here: 24.4% place: 13.0%
- Percentage of females in business and financial operations occupations:
Here: 7.4% place: 8.9%
- Percentage of females in computer and mathematical occupations:
Here: 4.5% place: 5.0%
- Percentage of females in life, physical, and social science occupations:
Here: 1.6% place: 3.4%
- Percentage of females in community and social services occupations:
Here: 3.1% place: 2.9%
- Percentage of females in legal occupations:
Here: 3.2% place: 4.2%
- Percentage of females in education, training, and library occupations:
Here: 18.5% place: 11.2%
- Percentage of females in arts, design, entertainment, sports, and media occupations:
Here: 3.3% place: 4.5%
- Percentage of females in healthcare practitioners and technical occupations:
Here: 2.5% place: 5.3%
- Percentage of females in service occupations:
Here: 18.0% place: 20.4%
- Percentage of females in sales and office occupations:
Here: 12.9% place: 16.7%
Percentage of people 16-64 in Armed Forces:
| Indian Spring Terrace: | 1.2% |
| Silver Spring: | 0.4% |
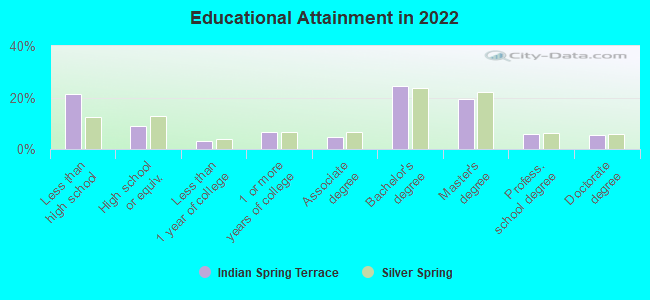
Education in this neighborhood (subdivision or community):
- Percentage of people 3 years and older in K-12 schools:
Indian Spring Terrace: 18.8% Silver Spring: 14.1%
- Percentage of people 3 years and older in undergraduate colleges:
Indian Spring Terrace: 3.0% Silver Spring: 3.4%
- Percentage of people 3 years and older in grad. or professional schools:
Indian Spring Terrace: 3.5% Silver Spring: 2.0%
- Percentage of students K-12 enrolled in private schools:
Indian Spring Terrace: 52.9% Silver Spring: 12.6%
Percentage of population below poverty level:
| Indian Spring Terrace: | 3.2% |
| Silver Spring: | 11.0% |
Percentage of married-couple families with both working:
| Indian Spring Terrace: | 95.2% |
| Silver Spring: | 80.2% |
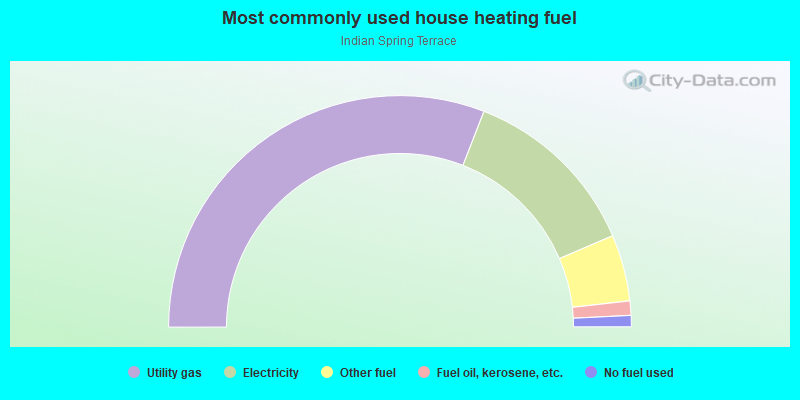
- 61.9%Utility gas
- 25.3%Electricity
- 9.3%Other fuel
- 2.0%Fuel oil, kerosene, etc.
- 1.6%No fuel used
Limited-access highways (interstate or state) in this neighborhood:
Capital Beltway (I- 495)
Length: 0.79 miles
Direction: E-W
Direction: E-W
Highways in this neighborhood:
Franklin Ave (State Hwy 516)
Length: 0.72 miles
Directions: E-W, SE-NW, SW-NE
Address range: 1 to 499
Directions: E-W, SE-NW, SW-NE
Address range: 1 to 499
US Hwy 29 (Colesville Rd)
Length: 0.53 miles
Directions: N-S, SW-NE
Address range: 9329 to 9799
Directions: N-S, SW-NE
Address range: 9329 to 9799
E Franklin Ave (State Hwy 516)
Length: 0.40 miles
Directions: E-W, SW-NE
Address range: 1 to 309
Directions: E-W, SW-NE
Address range: 1 to 309
University Blvd E (State Hwy 193)
Length: 0.27 miles
Direction: SE-NW
Address range: 202 to 299
Direction: SE-NW
Address range: 202 to 299
Roads and streets:
E Granville Dr
Length: 0.70 miles
Directions: E-W, N-S, SE-NW, SW-NE
Address range: 1 to 399
Directions: E-W, N-S, SE-NW, SW-NE
Address range: 1 to 399
Indian Spring Dr
Length: 0.59 miles
Direction: E-W
Address range: 1 to 399
Direction: E-W
Address range: 1 to 399
Normandy Dr
Length: 0.57 miles
Directions: E-W, SE-NW, SW-NE
Address range: 1 to 399
Directions: E-W, SE-NW, SW-NE
Address range: 1 to 399
Worth Ave
Length: 0.34 miles
Directions: N-S, SW-NE
Address range: 9300 to 9599
Directions: N-S, SW-NE
Address range: 9300 to 9599
Evergreen St
Length: 0.34 miles
Directions: E-W, N-S, SE-NW, SW-NE
Address range: 9500 to 9699
Directions: E-W, N-S, SE-NW, SW-NE
Address range: 9500 to 9699
E Indian Spring Dr
Length: 0.32 miles
Directions: E-W, SW-NE
Address range: 1 to 299
Directions: E-W, SW-NE
Address range: 1 to 299
Brewster Ave
Length: 0.32 miles
Directions: E-W, SE-NW
Address range: 200 to 499
Directions: E-W, SE-NW
Address range: 200 to 499
Caroline Ave
Length: 0.32 miles
Direction: N-S
Address range: 9400 to 9599
Direction: N-S
Address range: 9400 to 9599
Flower Ave
Length: 0.31 miles
Direction: N-S
Address range: 9500 to 9699
Direction: N-S
Address range: 9500 to 9699
Fairway Ave
Length: 0.26 miles
Directions: E-W, N-S, SW-NE
Address range: 9700 to 9717
Directions: E-W, N-S, SW-NE
Address range: 9700 to 9717
Leighton Ave
Length: 0.25 miles
Directions: E-W, SE-NW
Address range: 300 to 499
Directions: E-W, SE-NW
Address range: 300 to 499
Lawndale Dr
Length: 0.24 miles
Directions: E-W, SE-NW, SW-NE
Address range: 9600 to 9799
Directions: E-W, SE-NW, SW-NE
Address range: 9600 to 9799
Wire Ave
Length: 0.24 miles
Directions: N-S, SW-NE
Address range: 9400 to 9699
Directions: N-S, SW-NE
Address range: 9400 to 9699
Garwood St
Length: 0.20 miles
Directions: N-S, SE-NW
Address range: 9500 to 9699
Directions: N-S, SE-NW
Address range: 9500 to 9699
Ocala St
Length: 0.20 miles
Direction: N-S
Address range: 9400 to 9599
Direction: N-S
Address range: 9400 to 9599
Baden St
Length: 0.19 miles
Directions: E-W, SE-NW
Address range: 200 to 299
Directions: E-W, SE-NW
Address range: 200 to 299
Saybrook Ave
Length: 0.16 miles
Direction: N-S
Address range: 9500 to 9599
Direction: N-S
Address range: 9500 to 9599
Biltmore Dr
Length: 0.15 miles
Direction: SE-NW
Address range: 9500 to 9599
Direction: SE-NW
Address range: 9500 to 9599
Clearview Pl
Length: 0.15 miles
Directions: N-S, SW-NE
Address range: 9600 to 9699
Directions: N-S, SW-NE
Address range: 9600 to 9699
Seminole St
Length: 0.15 miles
Direction: SE-NW
Address range: 9500 to 9599
Direction: SE-NW
Address range: 9500 to 9599
Marshall Ave
Length: 0.14 miles
Directions: E-W, SE-NW
Address range: 9700 to 9799
Directions: E-W, SE-NW
Address range: 9700 to 9799
Hastings Dr
Length: 0.14 miles
Directions: N-S, SW-NE
Address range: 9600 to 9800
Directions: N-S, SW-NE
Address range: 9600 to 9800
Saginaw St
Length: 0.10 miles
Direction: N-S
Address range: 9500 to 9599
Direction: N-S
Address range: 9500 to 9599
Shorey Rd
Length: 0.10 miles
Direction: E-W
Address range: 200 to 299
Direction: E-W
Address range: 200 to 299
Lawson Pl
Length: 0.09 miles
Direction: SE-NW
Address range: 9700 to 9799
Direction: SE-NW
Address range: 9700 to 9799
Ellsworth Dr
Length: 0.06 miles
Direction: SW-NE
Address range: 200 to 299
Direction: SW-NE
Address range: 200 to 299
Highview Ave
Length: 0.04 miles
Direction: SE-NW
Address range: 313 to 399
Direction: SE-NW
Address range: 313 to 399
Brewster Ct
Length: 0.03 miles
Directions: N-S, SW-NE
Address range: 300 to 399
Directions: N-S, SW-NE
Address range: 300 to 399
Franklin Pl
Length: 0.03 miles
Direction: SW-NE
Address range: 300 to 399
Direction: SW-NE
Address range: 300 to 399
Leighton Pl
Length: 0.03 miles
Direction: SW-NE
Address range: 1 to 99
Direction: SW-NE
Address range: 1 to 99
Lawndale Ct
Length: 0.03 miles
Direction: SW-NE
Address range: 9600 to 9628
Direction: SW-NE
Address range: 9600 to 9628