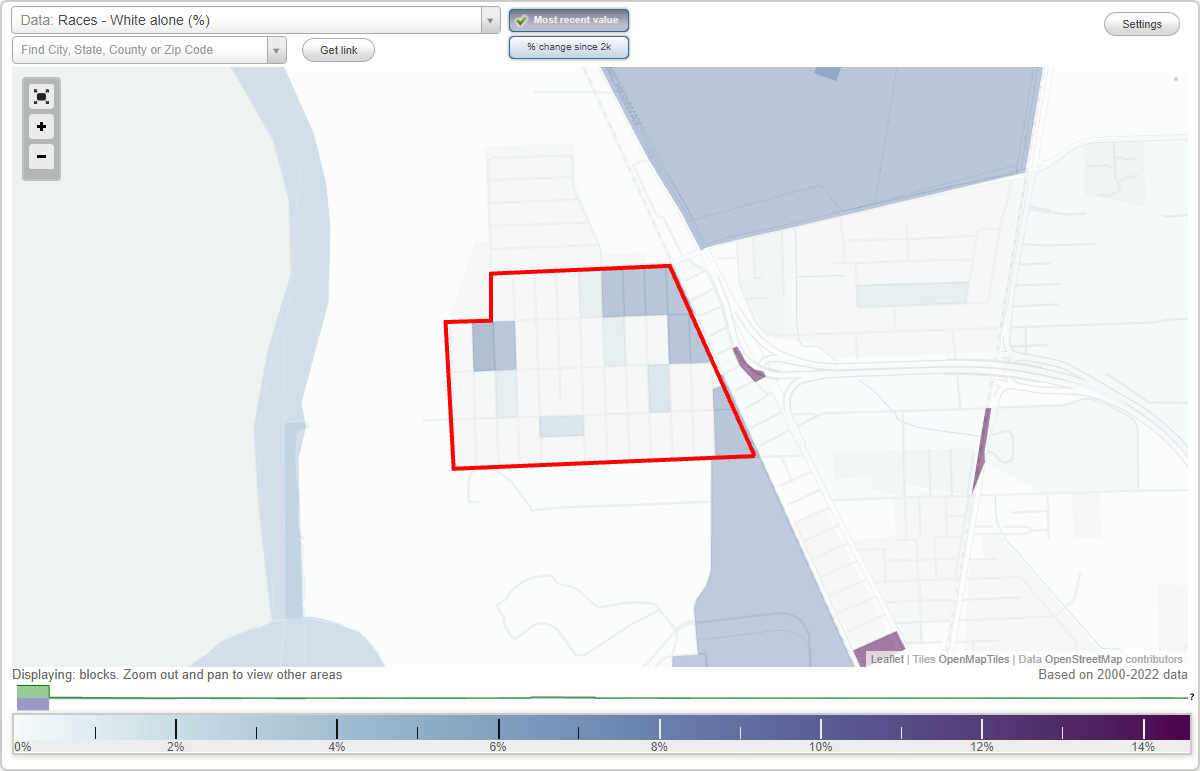
Highland Farms neighborhood in Baton Rouge, Louisiana (LA), 70807 detailed profile
Settings
X

Business Search - 14 Million verified businesses
Area: 0.319 square miles
Population: 656
Population density:
| Highland Farms: | 2,055 people per square mile |
| Baton Rouge: | 2,882 people per square mile |

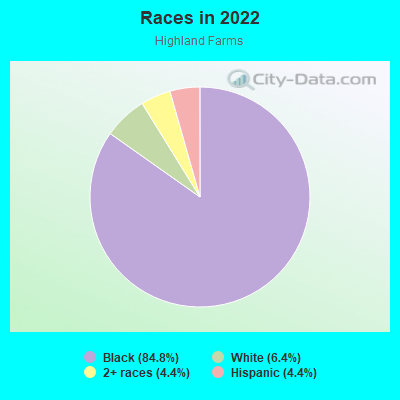
- 55684.8%Black
- 426.4%White
- 294.4%Two or more races
- 294.4%Hispanic or Latino
Median household income in 2022:
| Highland Farms: | $31,797 |
| Baton Rouge: | $50,304 |
Distribution of median household income
![Distribution of median household income]()
- 12Less than $10,000
- 20$10,000 to $19,999
- 142$20,000 to $29,999
- 23$30,000 to $39,999
- 15$40,000 to $49,999
- 16$50,000 to $59,999
- 21$60,000 to $74,999
- 2$75,000 to $99,999
- 2$100,000 to $124,999
- 44$125,000 to $149,999
- 11$150,000 to $199,999

Distribution of owner-occupied house/condo value
![Distribution of owner-occupied house/condo value]()
- 10Less than $50,000
- 29$50,000 to $99,999
- 12$100,000 to $149,999
- 6$150,000 to $199,999
- 1$200,000 to $249,999
- 2$250,000 to $299,999
- 31$300,000 to $399,999

Distribution of rent paid by renters
![Distribution of rent paid by renters]()
- 51Less than $100
- 23$200 to $299
- 5$300 to $399
- 6$400 to $499
- 3$600 to $699
- 48$700 to $799
- 2$800 to $899

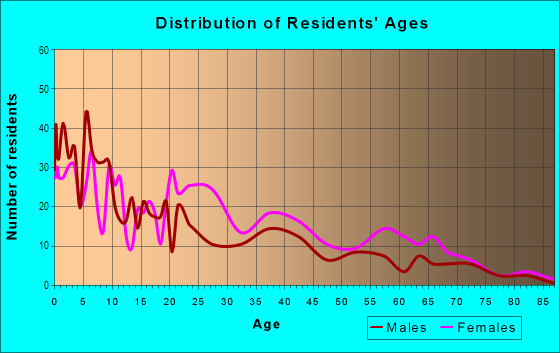
| Males: | 285 |
| Females: | 371 |
Males:
| This neighborhood: | 19.5 years |
| Whole city: | 29.6 years |
| This neighborhood: | 19.3 years |
| Whole city: | 32.8 years |
Average household size:
| Highland Farms: | 2.6 people |
| Baton Rouge: | 2.3 people |
Percentage of family households:
| Highland Farms: | 38.0% |
| Baton Rouge: | 36.6% |
| Here: | 27.2% |
| Baton Rouge: | 27.8% |
Percentage of married-couple families with children (among all households):
| Highland Farms: | 0.2% |
| Baton Rouge: | 15.1% |
Percentage of single-mother households (among all households):
| Highland Farms: | 11.4% |
| Baton Rouge: | 22.4% |
Percentage of never married males 15 years old and over:
Percentage of never married females 15 years old and over:
| Highland Farms: | 39.2% |
| Baton Rouge: | 27.3% |
Percentage of never married females 15 years old and over:
| Highland Farms: | 49.9% |
| city: | 27.2% |
Percentage of people that speak English not well or not at all:
| Highland Farms: | 0.0% |
| Baton Rouge: | 1.8% |
Percentage of people born in this state:
Percentage of people born in another U.S. state:
Percentage of native residents but born outside the U.S.:
Percentage of foreign born residents:
| Here: | 73.8% |
| Baton Rouge: | 74.7% |
Percentage of people born in another U.S. state:
| Highland Farms: | 26.0% |
| Baton Rouge: | 17.8% |
Percentage of native residents but born outside the U.S.:
| Here: | 0.0% |
| city: | 0.5% |
Percentage of foreign born residents:
| Here: | 0.2% |
| Baton Rouge: | 7.0% |
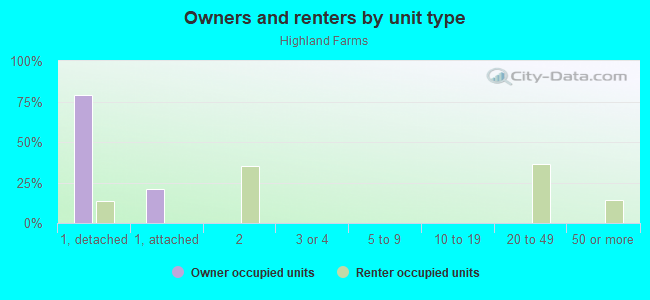
Owner-occupied
Renter-occupied

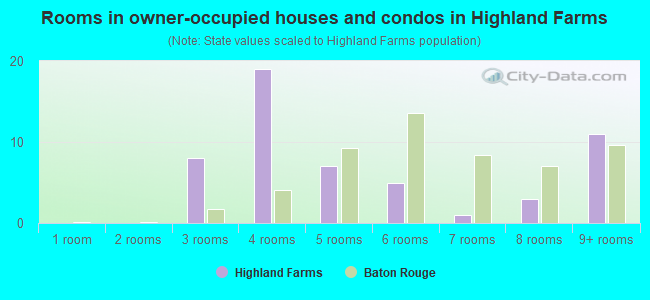
- Rooms in owner-occupied houses and condos in Highland Farms
- 01 room
- 02 rooms
- 83 rooms
- 194 rooms
- 75 rooms
- 56 rooms
- 17 rooms
- 38 rooms
- 119+ rooms
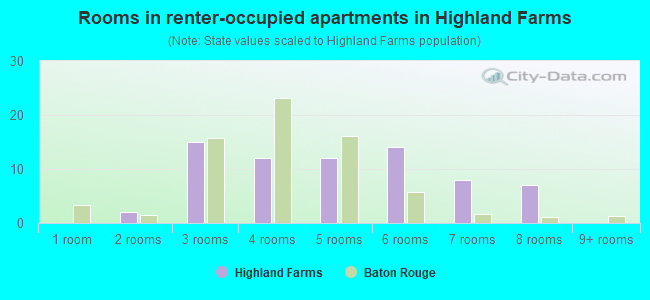
- Rooms in renter-occupied apartments in Highland Farms
- 01 room
- 22 rooms
- 153 rooms
- 124 rooms
- 125 rooms
- 146 rooms
- 87 rooms
- 78 rooms
- 09+ rooms
Owner-occupied
Renter-occupied
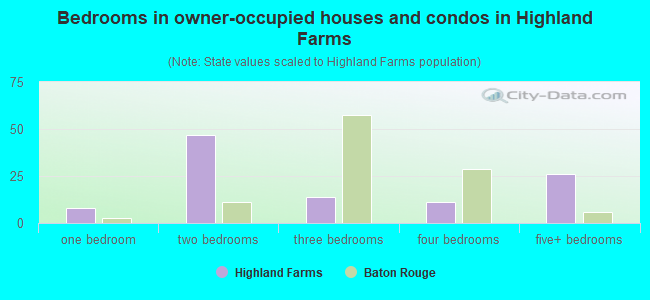
- Bedrooms in owner-occupied houses and condos in Highland Farms
- 0no bedroom
- 81 bedroom
- 472 bedrooms
- 143 bedrooms
- 114 bedrooms
- 265+ bedrooms
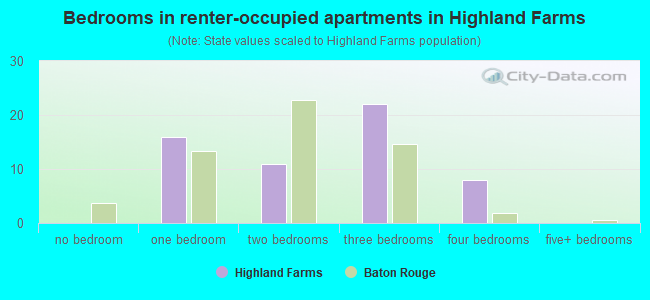
- Bedrooms in renter-occupied apartments in Highland Farms
- 0no bedroom
- 161 bedroom
- 112 bedrooms
- 223 bedrooms
- 84 bedrooms
- 05+ bedrooms
Average number of cars or other vehicles available in houses/condos:
Average number of cars or other vehicles available in apartments:
| This neighborhood: | 1.6 |
| Baton Rouge: | 1.7 |
Average number of cars or other vehicles available in apartments:
| Here: | 0.5 |
| city: | 1.3 |
Percentage of units with a mortgage:
| Highland Farms: | 45.4% |
| Baton Rouge: | 56.3% |
Average estimated value of detached houses in 2022 (47.1% of all units):
| Highland Farms: | $99,970 |
| Louisiana: | $273,555 |
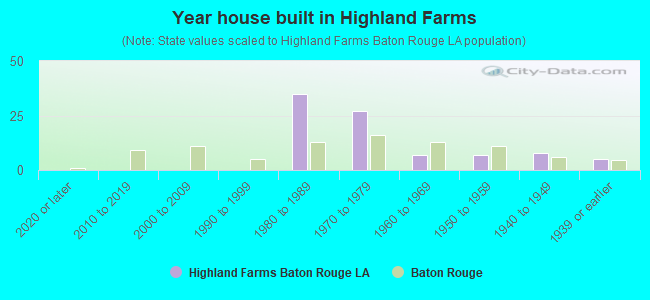
- Year house built in Highland Farms
- 02020 or later
- 02010 to 2019
- 02000 to 2009
- 01990 to 1999
- 351980 to 1989
- 271970 to 1979
- 71960 to 1969
- 71950 to 1959
- 81940 to 1949
- 51939 or earlier
City-data.com crime index for city in 2020 (higher means more crime):
| City: | 544.1 |
| U.S. average: | 219.5 |
Travel time to work (commute)
![Travel time to work (commute)]()
- 40Less than 5 minutes
- 655 to 9 minutes
- 7310 to 14 minutes
- 15015 to 19 minutes
- 19620 to 24 minutes
- 1525 to 29 minutes
- 8030 to 34 minutes
- 4535 to 39 minutes
- 445 to 59 minutes
- 4460 to 89 minutes
- 2890 or more minutes

Means of transportation to work
![Means of transportation to work]()
- 48.8%78Drove a car alone
- 15.0%24Carpooled
- 1.3%2Taxi
- 30.1%48Walked
- 3.1%5Worked at home

Time leaving home to go to work
![Time leaving home to go to work]()
- 6312:00 a.m. to 4:59 a.m.
- 515:00 a.m. to 5:29 a.m.
- 285:30 a.m. to 5:59 a.m.
- 196:00 a.m. to 6:29 a.m.
- 956:30 a.m. to 6:59 a.m.
- 177:00 a.m. to 7:29 a.m.
- 917:30 a.m. to 7:59 a.m.
- 458:00 a.m. to 8:29 a.m.
- 98:30 a.m. to 8:59 a.m.
- 479:00 a.m. to 9:59 a.m.
- 5610:00 a.m. to 10:59 a.m.
- 12612:00 p.m. to 3:59 p.m.
- 934:00 p.m. to 11:59 p.m.

Occupations of males:
- Percentage of males in management occupations (except farmers):
Here: 5619.8% city: 9.5%
- Percentage of males in computer and mathematical occupations:
Here: 1.8% city: 3.0%
- Percentage of males in architecture and engineering occupations:
Here: 1058.8% city: 4.2%
- Percentage of males in community and social services occupations:
Here: 162.9% city: 1.3%
- Percentage of males in arts, design, entertainment, sports, and media occupations:
Here: 3.1% city: 2.5%
- Percentage of males in service occupations:
Here: 72.2% city: 16.2%
- Percentage of males in sales and office occupations:
Here: 4.3% city: 12.7%
- Percentage of males in construction, extraction, and maintenance occupations:
Here: 3990.9% city: 8.7%
- Percentage of males in production occupations:
Here: 12.0% city: 6.5%
- Percentage of males in transportation occupations:
Here: 2443.4% city: 6.6%
- Percentage of males in material moving occupations:
Here: 6.6% city: 7.0%
Occupations of females:
- Percentage of females in business and financial operations occupations:
Here: 1.7% city: 4.9%
- Percentage of females in computer and mathematical occupations:
Here: 3.3% city: 1.9%
- Percentage of females in life, physical, and social science occupations:
Here: 10.4% city: 1.3%
- Percentage of females in education, training, and library occupations:
Here: 20.4% city: 10.7%
- Percentage of females in arts, design, entertainment, sports, and media occupations:
Here: 1.7% city: 2.3%
- Percentage of females in service occupations:
Here: 23.6% city: 24.5%
- Percentage of females in sales and office occupations:
Here: 31.2% city: 26.5%
- Percentage of females in production occupations:
Here: 1.5% city: 1.8%
- Percentage of females in transportation occupations:
Here: 3.9% city: 1.4%
- Percentage of females in material moving occupations:
Here: 1.7% city: 1.8%
Percentage of people 16-64 in Armed Forces:
| Highland Farms: | 0.1% |
| Baton Rouge: | 0.1% |
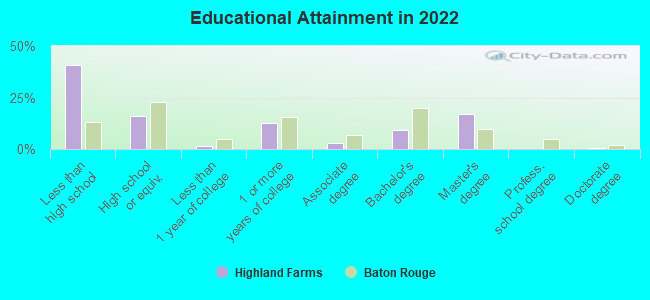
Education in this neighborhood (subdivision or community):
- Percentage of people 3 years and older in K-12 schools:
Highland Farms: 17.2% Baton Rouge: 14.3%
- Percentage of people 3 years and older in undergraduate colleges:
Highland Farms: 67.2% Baton Rouge: 14.0%
- Percentage of people 3 years and older in grad. or professional schools:
Highland Farms: 0.8% Baton Rouge: 2.5%
- Percentage of students K-12 enrolled in private schools:
Highland Farms: 0.0% Baton Rouge: 22.0%
Percentage of population below poverty level:
| Highland Farms: | 38.6% |
| Baton Rouge: | 22.4% |
Median year owner moved in (as recorded in 2022):
Median year renter moved in (as recorded in 2022):
| Highland Farms: | 2010 |
| Baton Rouge: | 2007 |
Median year renter moved in (as recorded in 2022):
| Highland Farms: | 2016 |
| Baton Rouge: | 2020 |
Percentage of married-couple families with both working:
| Highland Farms: | 100.0% |
| Baton Rouge: | 80.7% |
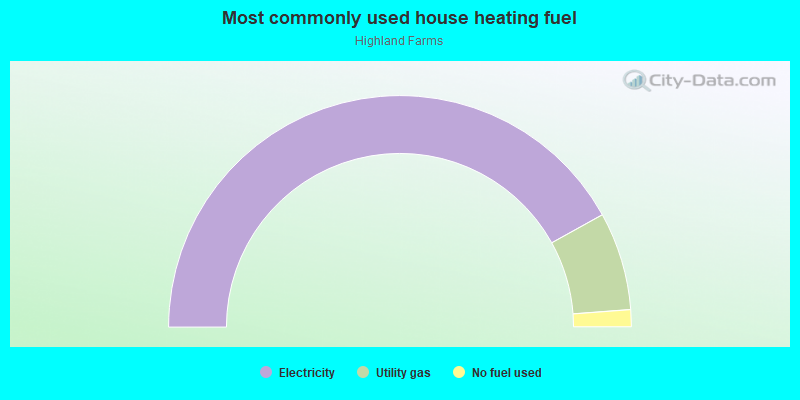
- 83.9%Electricity
- 13.7%Utility gas
- 2.4%No fuel used
Roads and streets:
Mills Ave
Length: 0.87 miles
Direction: E-W
Address range: 100 to 714
Direction: E-W
Address range: 100 to 714
Woodpecker St
Length: 0.83 miles
Direction: E-W
Address range: 100 to 699
Direction: E-W
Address range: 100 to 699
Woodcock St
Length: 0.77 miles
Direction: E-W
Address range: 100 to 699
Direction: E-W
Address range: 100 to 699
Elmer Ave
Length: 0.70 miles
Directions: E-W, SW-NE
Address range: 100 to 599
Directions: E-W, SW-NE
Address range: 100 to 599
Merganzer Ave
Length: 0.41 miles
Direction: SE-NW
Address range: 9501 to 10299
Direction: SE-NW
Address range: 9501 to 10299
Ave C
Length: 0.37 miles
Direction: N-S
Address range: 9700 to 10299
Direction: N-S
Address range: 9700 to 10299
Avenue E
Length: 0.37 miles
Direction: N-S
Address range: 9700 to 10299
Direction: N-S
Address range: 9700 to 10299
Ave D
Length: 0.37 miles
Direction: N-S
Address range: 9700 to 10299
Direction: N-S
Address range: 9700 to 10299
Ave B
Length: 0.37 miles
Direction: N-S
Address range: 9700 to 10299
Direction: N-S
Address range: 9700 to 10299
Ave G
Length: 0.37 miles
Direction: N-S
Address range: 9700 to 10299
Direction: N-S
Address range: 9700 to 10299
Ave F
Length: 0.37 miles
Direction: N-S
Address range: 9700 to 10299
Direction: N-S
Address range: 9700 to 10299
Ave I
Length: 0.37 miles
Direction: N-S
Address range: 9700 to 10299
Direction: N-S
Address range: 9700 to 10299
Ave J
Length: 0.37 miles
Direction: N-S
Address range: 9700 to 10299
Direction: N-S
Address range: 9700 to 10299
Ave K
Length: 0.37 miles
Direction: N-S
Address range: 9700 to 10299
Direction: N-S
Address range: 9700 to 10299
Ave L
Length: 0.37 miles
Direction: N-S
Address range: 9700 to 10299
Direction: N-S
Address range: 9700 to 10299
Ave M
Length: 0.25 miles
Directions: N-S, SW-NE
Address range: 9900 to 10299
Directions: N-S, SW-NE
Address range: 9900 to 10299
Ave A
Length: 0.24 miles
Direction: N-S
Address range: 9700 to 10299
Direction: N-S
Address range: 9700 to 10299
Ave H
Length: 0.20 miles
Direction: N-S
Address range: 9900 to 10299
Direction: N-S
Address range: 9900 to 10299
Flicker St
Length: 0.13 miles
Direction: E-W
Address range: 300 to 399
Direction: E-W
Address range: 300 to 399
Scaup St
Length: 0.03 miles
Direction: E-W
Direction: E-W