Hazel (Forest) neighborhood in Birmingham, Michigan (MI), 48009 detailed profile
Settings
X


Business Search - 14 Million verified businesses
Area: 0.078 square miles
Population: 296
Population density:
| Hazel (Forest): | 3,803 people per square mile |
| Birmingham: | 4,551 people per square mile |

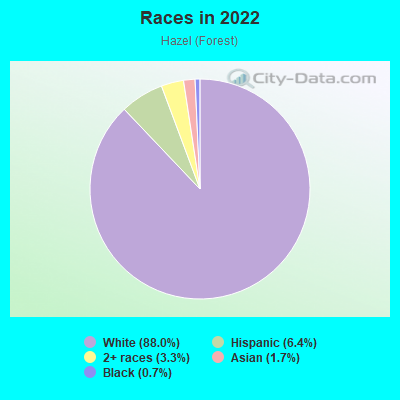
- 26388.0%White
- 196.4%Hispanic or Latino
- 103.3%Two or more races
- 51.7%Asian
- 20.7%Black
Median household income in 2022:
| Hazel (Forest): | $192,774 |
| Birmingham: | $151,556 |
Distribution of median household income
![Distribution of median household income]()
- 4Less than $10,000
- 2$10,000 to $19,999
- 6$20,000 to $29,999
- 2$30,000 to $39,999
- 11$40,000 to $49,999
- 2$50,000 to $59,999
- 5$60,000 to $74,999
- 5$75,000 to $99,999
- 7$100,000 to $124,999
- 5$125,000 to $149,999
- 3$150,000 to $199,999
- 65$200,000 or more

Distribution of owner-occupied house/condo value
![Distribution of owner-occupied house/condo value]()
- 3Less than $50,000
- 3$100,000 to $149,999
- 9$150,000 to $199,999
- 17$200,000 to $249,999
- 16$250,000 to $299,999
- 2$300,000 to $399,999
- 6$400,000 to $499,999
- 37$500,000 to $749,999
- 20$750,000 to $999,999
- 13$1,000,000 or more

Distribution of rent paid by renters
![Distribution of rent paid by renters]()
- 6$200 to $299
- 2$600 to $699
- 20$1,000 to $1,249
- 4$1,250 to $1,499
- 3$1,500 to $1,999
- 15$2,000 or more

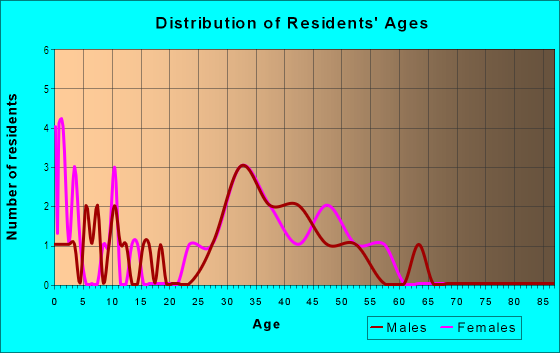
| Males: | 152 |
| Females: | 144 |
Males:
| This neighborhood: | 37.9 years |
| Whole city: | 41.0 years |
| This neighborhood: | 33.8 years |
| Whole city: | 43.2 years |
Average household size:
| Hazel (Forest): | 20.0 people |
| Birmingham: | 2.3 people |
Percentage of family households:
| Hazel (Forest): | 69.6% |
| Birmingham: | 43.8% |
| Here: | 78.4% |
| Birmingham: | 50.8% |
Percentage of married-couple families with children (among all households):
| Hazel (Forest): | 33.1% |
| Birmingham: | 35.7% |
Percentage of single-mother households (among all households):
| Hazel (Forest): | 2.8% |
| Birmingham: | 5.2% |
Percentage of never married males 15 years old and over:
Percentage of never married females 15 years old and over:
| Hazel (Forest): | 11.5% |
| Birmingham: | 12.6% |
Percentage of never married females 15 years old and over:
| Hazel (Forest): | 6.5% |
| city: | 13.4% |
Percentage of people that speak English not well or not at all:
| Hazel (Forest): | 16.7% |
| Birmingham: | 0.2% |
Percentage of people born in this state:
Percentage of people born in another U.S. state:
Percentage of native residents but born outside the U.S.:
Percentage of foreign born residents:
| Here: | 64.0% |
| Birmingham: | 65.9% |
Percentage of people born in another U.S. state:
| Hazel (Forest): | 15.6% |
| Birmingham: | 21.8% |
Percentage of native residents but born outside the U.S.:
| Here: | 1.9% |
| city: | 1.5% |
Percentage of foreign born residents:
| Here: | 18.5% |
| Birmingham: | 10.8% |
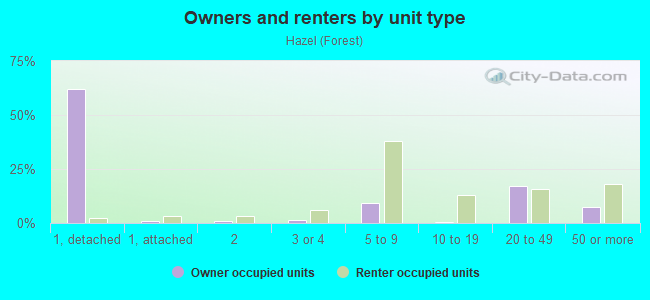
Owner-occupied
Renter-occupied

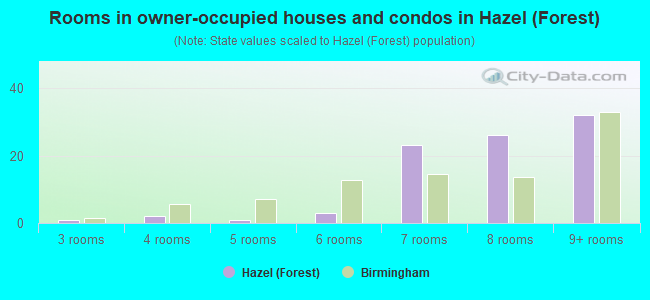
- Rooms in owner-occupied houses and condos in Hazel <
> - 01 room
- 02 rooms
- 13 rooms
- 24 rooms
- 15 rooms
- 36 rooms
- 237 rooms
- 268 rooms
- 329+ rooms
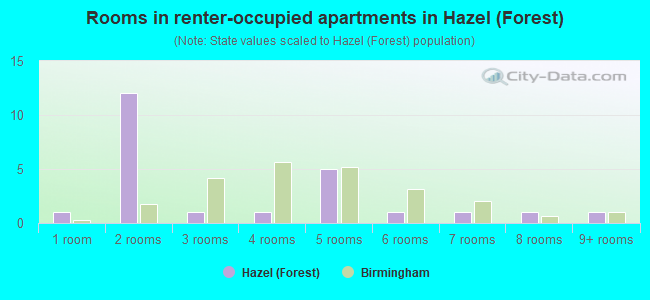
- Rooms in renter-occupied apartments in Hazel <
> - 11 room
- 122 rooms
- 13 rooms
- 14 rooms
- 55 rooms
- 16 rooms
- 17 rooms
- 18 rooms
- 19+ rooms
Owner-occupied
Renter-occupied
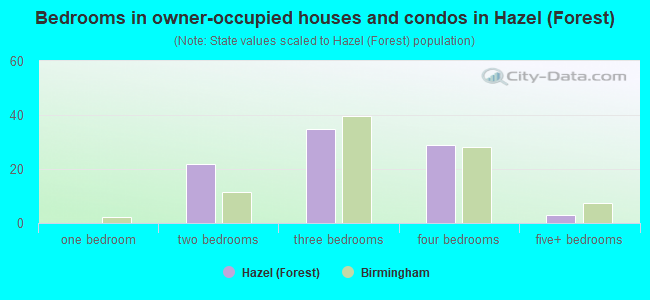
- Bedrooms in owner-occupied houses and condos in Hazel <
> - 0no bedroom
- 01 bedroom
- 222 bedrooms
- 353 bedrooms
- 294 bedrooms
- 35+ bedrooms
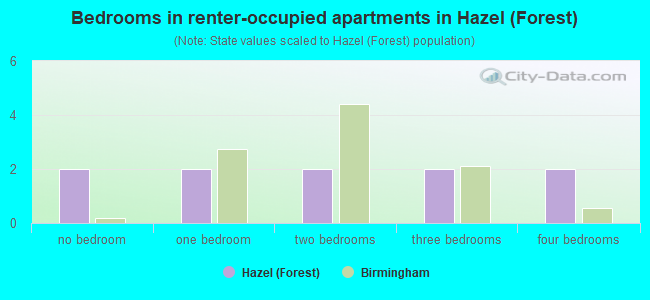
- Bedrooms in renter-occupied apartments in Hazel <
> - 2no bedroom
- 21 bedroom
- 22 bedrooms
- 23 bedrooms
- 24 bedrooms
- 05+ bedrooms
Average number of cars or other vehicles available in houses/condos:
Average number of cars or other vehicles available in apartments:
| This neighborhood: | 2.2 |
| Birmingham: | 1.9 |
Average number of cars or other vehicles available in apartments:
| Here: | 1.2 |
| city: | 1.2 |
Percentage of units with a mortgage:
| Hazel (Forest): | 81.1% |
| Birmingham: | 69.3% |
Housing prices:
- Average estimated value of detached houses in 2022 (64.8% of all units):
Hazel (Forest): $999,170 Michigan: $280,038
- Average estimated '22 value of housing units in 5-or-more-unit structures (5.6% of all units):
Hazel (Forest): $235,274 Michigan: $192,733
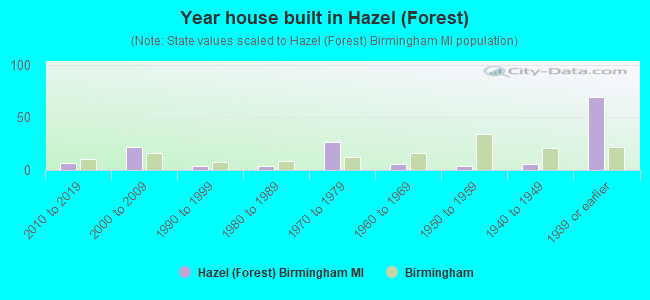
- Year house built in Hazel <
> - 02020 or later
- 72010 to 2019
- 222000 to 2009
- 41990 to 1999
- 41980 to 1989
- 271970 to 1979
- 61960 to 1969
- 41950 to 1959
- 61940 to 1949
- 691939 or earlier
City-data.com crime index for city in 2020 (higher means more crime):
| City: | 27.8 |
| U.S. average: | 219.5 |
Travel time to work (commute)
![Travel time to work (commute)]()
- 16Less than 5 minutes
- 325 to 9 minutes
- 2610 to 14 minutes
- 3115 to 19 minutes
- 3020 to 24 minutes
- 425 to 29 minutes
- 1730 to 34 minutes
- 1040 to 44 minutes
- 645 to 59 minutes
- 260 to 89 minutes
- 290 or more minutes

Means of transportation to work
![Means of transportation to work]()
- 78.7%118Drove a car alone
- 9.3%14Carpooled
- 1.3%2Bicycle
- 0.7%1Walked
- 1.3%2Other means
- 18.7%28Worked at home

Time leaving home to go to work
![Time leaving home to go to work]()
- 212:00 a.m. to 4:59 a.m.
- 65:00 a.m. to 5:29 a.m.
- 25:30 a.m. to 5:59 a.m.
- 86:00 a.m. to 6:29 a.m.
- 156:30 a.m. to 6:59 a.m.
- 237:00 a.m. to 7:29 a.m.
- 357:30 a.m. to 7:59 a.m.
- 338:00 a.m. to 8:29 a.m.
- 108:30 a.m. to 8:59 a.m.
- 239:00 a.m. to 9:59 a.m.
- 310:00 a.m. to 10:59 a.m.
- 211:00 a.m. to 11:59 a.m.
- 212:00 p.m. to 3:59 p.m.
- 174:00 p.m. to 11:59 p.m.

Occupations of males:
- Percentage of males in management occupations (except farmers):
Here: 15.6% city: 28.7%
- Percentage of males in business and financial operations occupations:
Here: 23.6% city: 10.2%
- Percentage of males in computer and mathematical occupations:
Here: 2.1% city: 3.1%
- Percentage of males in architecture and engineering occupations:
Here: 7.0% city: 6.7%
- Percentage of males in life, physical, and social science occupations:
Here: 1.3% city: 0.6%
- Percentage of males in legal occupations:
Here: 6.2% city: 9.5%
- Percentage of males in education, training, and library occupations:
Here: 1.8% city: 2.3%
- Percentage of males in arts, design, entertainment, sports, and media occupations:
Here: 81.9% city: 2.5%
- Percentage of males in healthcare practitioners and technical occupations:
Here: 17.4% city: 7.4%
- Percentage of males in service occupations:
Here: 5.6% city: 6.1%
- Percentage of males in sales and office occupations:
Here: 12.3% city: 14.1%
- Percentage of males in construction, extraction, and maintenance occupations:
Here: 2.9% city: 3.4%
- Percentage of males in production occupations:
Here: 29.7% city: 2.0%
- Percentage of males in material moving occupations:
Here: 4.3% city: 1.3%
Occupations of females:
- Percentage of females in management occupations (except farmers):
Here: 13.7% city: 17.0%
- Percentage of females in business and financial operations occupations:
Here: 18.7% city: 12.9%
- Percentage of females in computer and mathematical occupations:
Here: 3.6% city: 2.4%
- Percentage of females in architecture and engineering occupations:
Here: 5.2% city: 2.2%
- Percentage of females in life, physical, and social science occupations:
Here: 1.0% city: 0.2%
- Percentage of females in community and social services occupations:
Here: 14.5% city: 2.7%
- Percentage of females in arts, design, entertainment, sports, and media occupations:
Here: 2.8% city: 3.0%
- Percentage of females in healthcare practitioners and technical occupations:
Here: 7.5% city: 13.7%
- Percentage of females in service occupations:
Here: 14.0% city: 13.1%
- Percentage of females in sales and office occupations:
Here: 19.0% city: 19.7%
- Percentage of females in production occupations:
Here: 2.0% city: 0.9%
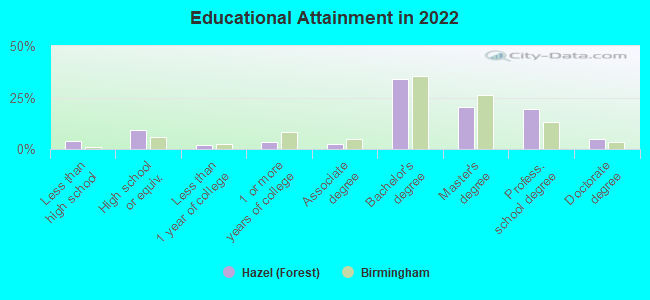
Education in this neighborhood (subdivision or community):
- Percentage of people 3 years and older in K-12 schools:
Hazel (Forest): 14.6% Birmingham: 20.3%
- Percentage of people 3 years and older in undergraduate colleges:
Hazel (Forest): 5.6% Birmingham: 1.7%
- Percentage of people 3 years and older in grad. or professional schools:
Hazel (Forest): 4.9% Birmingham: 1.1%
- Percentage of students K-12 enrolled in private schools:
Hazel (Forest): 33.3% Birmingham: 22.5%
Percentage of population below poverty level:
| Hazel (Forest): | 11.1% |
| Birmingham: | 5.5% |
Median year owner moved in (as recorded in 2022):
| Hazel (Forest): | 2009 |
| Birmingham: | 2009 |
Percentage of married-couple families with both working:
| Hazel (Forest): | 84.8% |
| Birmingham: | 71.9% |
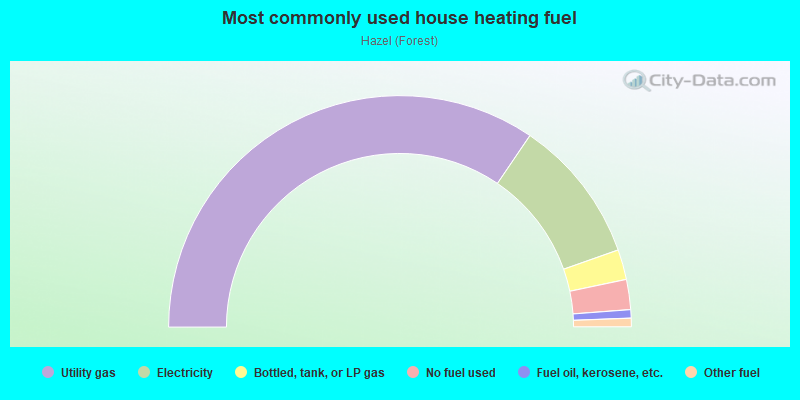
- 69.0%Utility gas
- 20.2%Electricity
- 4.2%Bottled, tank, or LP gas
- 4.2%No fuel used
- 1.2%Fuel oil, kerosene, etc.
- 1.2%Other fuel
Highways in this neighborhood:
State Hwy 10 (S Hunter Blvd, Woodward Ave)
Length: 0.56 miles
Direction: SE-NW
Address range: 100 to 34798
Direction: SE-NW
Address range: 100 to 34798
Roads and streets:
E Maple Rd
Length: 0.39 miles
Direction: E-W
Address range: 400 to 1099
Direction: E-W
Address range: 400 to 1099
Forest Ave
Length: 0.33 miles
Direction: E-W
Address range: 600 to 1099
Direction: E-W
Address range: 600 to 1099
Chestnut St
Length: 0.31 miles
Direction: E-W
Address range: 650 to 1099
Direction: E-W
Address range: 650 to 1099
Hazel St
Length: 0.29 miles
Direction: E-W
Address range: 700 to 1099
Direction: E-W
Address range: 700 to 1099
Bowers St
Length: 0.28 miles
Direction: E-W
Address range: 750 to 1075
Direction: E-W
Address range: 750 to 1075
S Elm St
Length: 0.26 miles
Direction: N-S
Address range: 100 to 599
Direction: N-S
Address range: 100 to 599
S Adams Rd
Length: 0.26 miles
Direction: N-S
Address range: 100 to 598
Direction: N-S
Address range: 100 to 598
N Hunter Blvd
Length: 0.00 miles
Direction: SE-NW
Direction: SE-NW