Foxhall neighborhood in Silver Spring, Maryland (MD), 20906 detailed profile
Settings
X


Business Search - 14 Million verified businesses
Area: 0.270 square miles
Population: 928
Population density:
| Foxhall: | 3,442 people per square mile |
| Silver Spring: | 7,993 people per square mile |

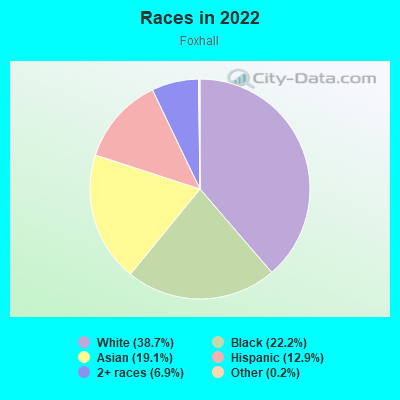
- 35838.7%White
- 20622.2%Black
- 17719.1%Asian
- 11912.9%Hispanic or Latino
- 646.9%Two or more races
- 20.2%Some other race
Median household income in 2022:
| Foxhall: | $139,056 |
| Silver Spring: | $81,557 |
Distribution of median household income
![Distribution of median household income]()
- 8Less than $10,000
- 13$10,000 to $19,999
- 4$20,000 to $29,999
- 59$30,000 to $39,999
- 43$40,000 to $49,999
- 44$50,000 to $59,999
- 17$60,000 to $74,999
- 38$75,000 to $99,999
- 22$100,000 to $124,999
- 49$125,000 to $149,999
- 56$150,000 to $199,999
- 87$200,000 or more

Distribution of owner-occupied house/condo value
![Distribution of owner-occupied house/condo value]()
- 44Less than $50,000
- 6$50,000 to $99,999
- 8$150,000 to $199,999
- 13$200,000 to $249,999
- 51$250,000 to $299,999
- 16$300,000 to $399,999
- 65$400,000 to $499,999
- 198$500,000 to $749,999
- 11$750,000 to $999,999

Distribution of rent paid by renters
![Distribution of rent paid by renters]()
- 5$900 to $999
- 54$1,000 to $1,249
- 26$1,250 to $1,499
- 48$1,500 to $1,999
- 26$2,000 or more

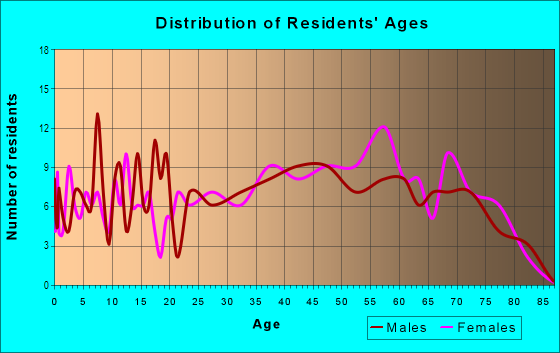
| Males: | 552 |
| Females: | 376 |
Males:
| This neighborhood: | 42.9 years |
| Whole city: | 36.7 years |
| This neighborhood: | 44.0 years |
| Whole city: | 36.5 years |
Average household size:
| Foxhall: | 10.8 people |
| Silver Spring: | 2.2 people |
Percentage of family households:
| Foxhall: | 41.9% |
| Silver Spring: | 38.8% |
| Here: | 59.2% |
| Silver Spring: | 32.5% |
Percentage of married-couple families with children (among all households):
| Foxhall: | 26.6% |
| Silver Spring: | 34.5% |
Percentage of single-mother households (among all households):
| Foxhall: | 12.8% |
| Silver Spring: | 6.6% |
Percentage of never married males 15 years old and over:
Percentage of never married females 15 years old and over:
| Foxhall: | 19.5% |
| Silver Spring: | 22.2% |
Percentage of never married females 15 years old and over:
| Foxhall: | 8.9% |
| place: | 24.3% |
Percentage of people that speak English not well or not at all:
| Foxhall: | 8.0% |
| Silver Spring: | 9.9% |
Percentage of people born in this state:
Percentage of people born in another U.S. state:
Percentage of native residents but born outside the U.S.:
Percentage of foreign born residents:
| Here: | 22.0% |
| Silver Spring: | 19.7% |
Percentage of people born in another U.S. state:
| Foxhall: | 35.7% |
| Silver Spring: | 45.9% |
Percentage of native residents but born outside the U.S.:
| Here: | 1.0% |
| place: | 2.4% |
Percentage of foreign born residents:
| Here: | 41.2% |
| Silver Spring: | 32.0% |
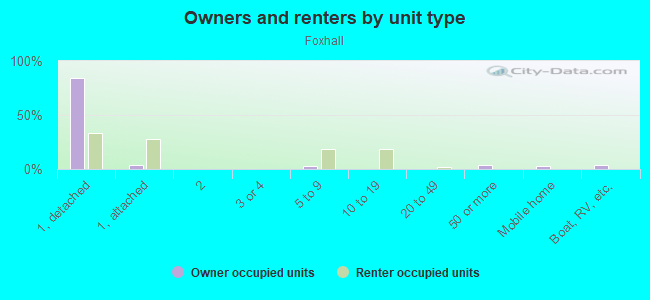
Owner-occupied
Renter-occupied

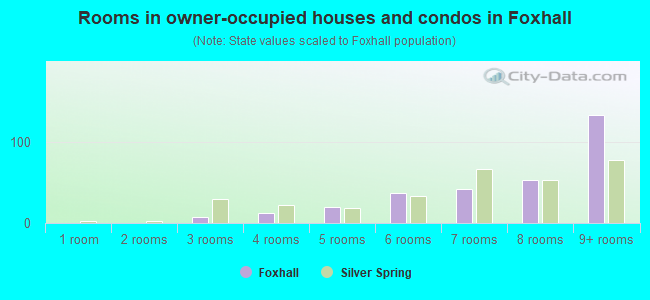
- Rooms in owner-occupied houses and condos in Foxhall
- 01 room
- 02 rooms
- 73 rooms
- 124 rooms
- 205 rooms
- 376 rooms
- 427 rooms
- 538 rooms
- 1339+ rooms
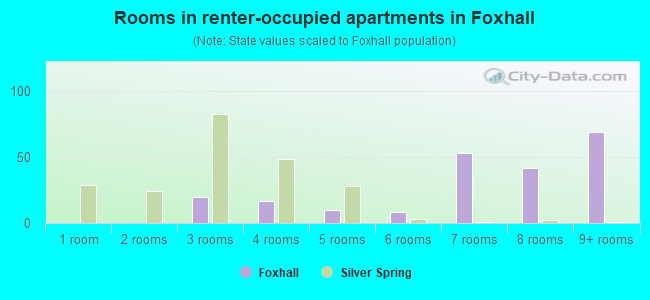
- Rooms in renter-occupied apartments in Foxhall
- 01 room
- 02 rooms
- 203 rooms
- 174 rooms
- 105 rooms
- 86 rooms
- 537 rooms
- 428 rooms
- 699+ rooms
Owner-occupied
Renter-occupied
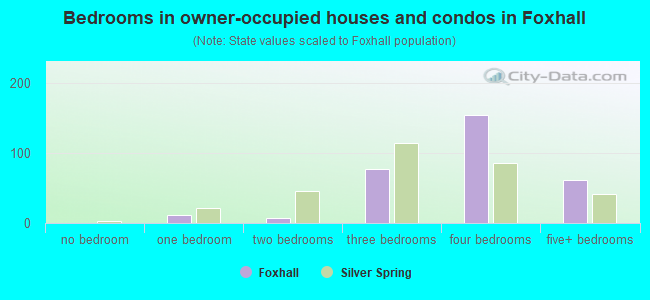
- Bedrooms in owner-occupied houses and condos in Foxhall
- 0no bedroom
- 121 bedroom
- 72 bedrooms
- 773 bedrooms
- 1544 bedrooms
- 625+ bedrooms
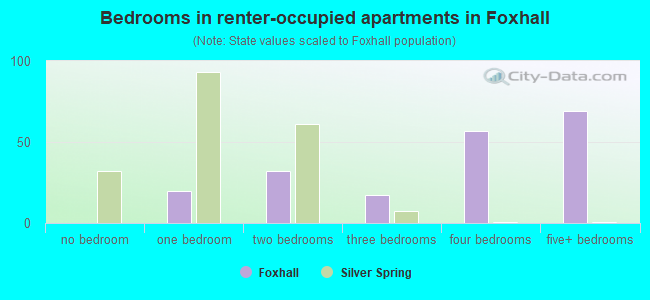
- Bedrooms in renter-occupied apartments in Foxhall
- 0no bedroom
- 201 bedroom
- 322 bedrooms
- 173 bedrooms
- 574 bedrooms
- 695+ bedrooms
Average number of cars or other vehicles available in houses/condos:
Average number of cars or other vehicles available in apartments:
| This neighborhood: | 0.4 |
| Silver Spring: | 1.7 |
Average number of cars or other vehicles available in apartments:
| Here: | 1.9 |
| place: | 0.9 |
Percentage of units with a mortgage:
| Foxhall: | 62.2% |
| Silver Spring: | 76.3% |
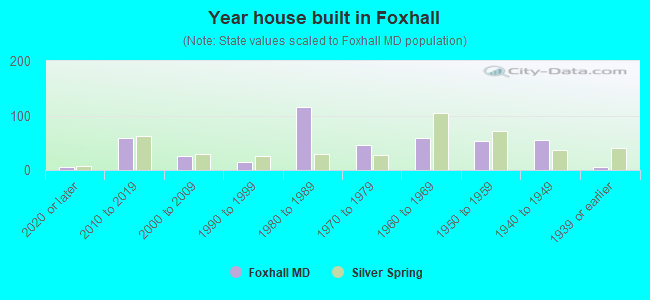
- Year house built in Foxhall
- 52020 or later
- 582010 to 2019
- 252000 to 2009
- 141990 to 1999
- 1161980 to 1989
- 461970 to 1979
- 581960 to 1969
- 531950 to 1959
- 551940 to 1949
- 61939 or earlier
Travel time to work (commute)
![Travel time to work (commute)]()
- 35 to 9 minutes
- 3810 to 14 minutes
- 1515 to 19 minutes
- 8820 to 24 minutes
- 2025 to 29 minutes
- 10130 to 34 minutes
- 1935 to 39 minutes
- 2940 to 44 minutes
- 7545 to 59 minutes
- 8560 to 89 minutes
- 1990 or more minutes

Means of transportation to work
![Means of transportation to work]()
- 49.8%259Drove a car alone
- 12.3%64Carpooled
- 3.1%16Bus
- 11.7%61Subway or elevated rail
- 1.9%10Long-distance train or commuter rail
- 6.2%32Taxi
- 1.5%8Walked
- 1.5%8Other means
- 19.4%101Worked at home

Time leaving home to go to work
![Time leaving home to go to work]()
- 1912:00 a.m. to 4:59 a.m.
- 235:00 a.m. to 5:29 a.m.
- 135:30 a.m. to 5:59 a.m.
- 626:00 a.m. to 6:29 a.m.
- 396:30 a.m. to 6:59 a.m.
- 207:00 a.m. to 7:29 a.m.
- 527:30 a.m. to 7:59 a.m.
- 488:00 a.m. to 8:29 a.m.
- 478:30 a.m. to 8:59 a.m.
- 489:00 a.m. to 9:59 a.m.
- 1310:00 a.m. to 10:59 a.m.
- 1711:00 a.m. to 11:59 a.m.
- 7412:00 p.m. to 3:59 p.m.
- 154:00 p.m. to 11:59 p.m.

Occupations of males:
- Percentage of males in management occupations (except farmers):
Here: 7.8% place: 11.4%
- Percentage of males in business and financial operations occupations:
Here: 6.6% place: 6.8%
- Percentage of males in computer and mathematical occupations:
Here: 13.5% place: 9.4%
- Percentage of males in architecture and engineering occupations:
Here: 1.6% place: 4.5%
- Percentage of males in life, physical, and social science occupations:
Here: 2.9% place: 5.3%
- Percentage of males in community and social services occupations:
Here: 1.4% place: 1.2%
- Percentage of males in legal occupations:
Here: 3.4% place: 3.6%
- Percentage of males in education, training, and library occupations:
Here: 6.5% place: 6.2%
- Percentage of males in arts, design, entertainment, sports, and media occupations:
Here: 3.5% place: 3.9%
- Percentage of males in healthcare practitioners and technical occupations:
Here: 1.1% place: 2.5%
- Percentage of males in service occupations:
Here: 11.9% place: 10.9%
- Percentage of males in sales and office occupations:
Here: 19.0% place: 9.6%
- Percentage of males in construction, extraction, and maintenance occupations:
Here: 5.4% place: 11.6%
- Percentage of males in production occupations:
Here: 2.6% place: 2.2%
- Percentage of males in transportation occupations:
Here: 6.3% place: 6.4%
- Percentage of males in material moving occupations:
Here: 5.8% place: 2.2%
Occupations of females:
- Percentage of females in management occupations (except farmers):
Here: 10.9% place: 13.0%
- Percentage of females in business and financial operations occupations:
Here: 5.0% place: 8.9%
- Percentage of females in computer and mathematical occupations:
Here: 11.3% place: 5.0%
- Percentage of females in life, physical, and social science occupations:
Here: 10.6% place: 3.4%
- Percentage of females in community and social services occupations:
Here: 3.3% place: 2.9%
- Percentage of females in education, training, and library occupations:
Here: 13.6% place: 11.2%
- Percentage of females in arts, design, entertainment, sports, and media occupations:
Here: 1.3% place: 4.5%
- Percentage of females in healthcare practitioners and technical occupations:
Here: 9.0% place: 5.3%
- Percentage of females in service occupations:
Here: 14.9% place: 20.4%
- Percentage of females in sales and office occupations:
Here: 16.9% place: 16.7%
- Percentage of females in transportation occupations:
Here: 1.8% place: 0.6%
Percentage of people 16-64 in Armed Forces:
| Foxhall: | 2.6% |
| Silver Spring: | 0.4% |
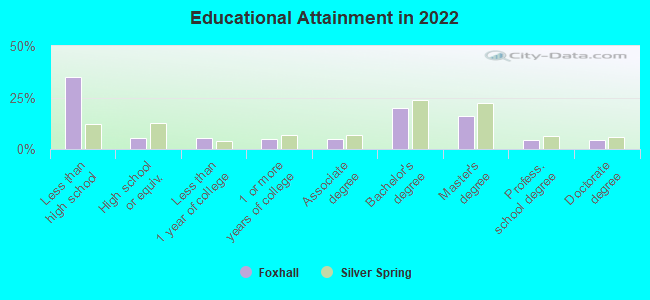
Education in this neighborhood (subdivision or community):
- Percentage of people 3 years and older in K-12 schools:
Foxhall: 25.9% Silver Spring: 14.1%
- Percentage of people 3 years and older in undergraduate colleges:
Foxhall: 13.3% Silver Spring: 3.4%
- Percentage of people 3 years and older in grad. or professional schools:
Foxhall: 2.9% Silver Spring: 2.0%
- Percentage of students K-12 enrolled in private schools:
Foxhall: 44.3% Silver Spring: 12.6%
Percentage of population below poverty level:
| Foxhall: | 2.7% |
| Silver Spring: | 11.0% |
Median year owner moved in (as recorded in 2022):
| Foxhall: | 2010 |
| Silver Spring: | 2011 |
Percentage of married-couple families with both working:
| Foxhall: | 172.4% |
| Silver Spring: | 80.2% |
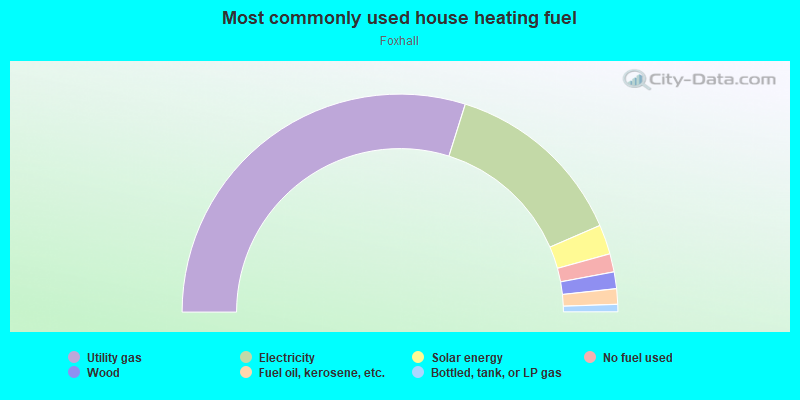
- 59.7%Utility gas
- 27.3%Electricity
- 4.4%Solar energy
- 2.7%No fuel used
- 2.5%Wood
- 2.3%Fuel oil, kerosene, etc.
- 1.1%Bottled, tank, or LP gas
Highways in this neighborhood:
Georgia Ave (State Hwy 97)
Length: 0.40 miles
Direction: SE-NW
Address range: 12900 to 13099
Direction: SE-NW
Address range: 12900 to 13099
Roads and streets:
Foxhall Dr
Length: 0.81 miles
Directions: E-W, N-S, SE-NW, SW-NE
Address range: 13100 to 13399
Directions: E-W, N-S, SE-NW, SW-NE
Address range: 13100 to 13399
Hathaway Dr
Length: 0.69 miles
Directions: E-W, N-S, SW-NE
Address range: 13000 to 13299
Directions: E-W, N-S, SW-NE
Address range: 13000 to 13299
Weller Rd
Length: 0.49 miles
Directions: E-W, N-S, SW-NE
Address range: 2600 to 2899
Directions: E-W, N-S, SW-NE
Address range: 2600 to 2899
Woodedge Rd
Length: 0.38 miles
Directions: E-W, N-S, SW-NE
Address range: 2600 to 2799
Directions: E-W, N-S, SW-NE
Address range: 2600 to 2799
Briggs Rd
Length: 0.35 miles
Directions: E-W, SE-NW
Address range: 2607 to 2799
Directions: E-W, SE-NW
Address range: 2607 to 2799
Vixen Ln
Length: 0.28 miles
Directions: E-W, N-S, SE-NW, SW-NE
Address range: 2800 to 2899
Directions: E-W, N-S, SE-NW, SW-NE
Address range: 2800 to 2899
Silverdale Dr
Length: 0.28 miles
Directions: E-W, SE-NW
Address range: 2600 to 2799
Directions: E-W, SE-NW
Address range: 2600 to 2799
Fernedge Rd
Length: 0.27 miles
Directions: E-W, SE-NW
Address range: 13100 to 13199
Directions: E-W, SE-NW
Address range: 13100 to 13199
Jingle Ln
Length: 0.22 miles
Directions: E-W, N-S, SW-NE
Address range: 12800 to 13199
Directions: E-W, N-S, SW-NE
Address range: 12800 to 13199
Hathaway Ter
Length: 0.17 miles
Directions: E-W, SE-NW, SW-NE
Address range: 2800 to 2899
Directions: E-W, SE-NW, SW-NE
Address range: 2800 to 2899
Briggs Ct
Length: 0.08 miles
Directions: N-S, SE-NW
Address range: 1 to 99
Directions: N-S, SE-NW
Address range: 1 to 99
Kayson St
Length: 0.06 miles
Direction: SW-NE
Address range: 3000 to 3099
Direction: SW-NE
Address range: 3000 to 3099
Foxhall Ct
Length: 0.03 miles
Direction: N-S
Address range: 1 to 99
Direction: N-S
Address range: 1 to 99