East Side Historic District neighborhood in Wilmington, Delaware (DE), 19801 detailed profile
Settings
X


Business Search - 14 Million verified businesses
Area: 0.019 square miles
Population: 282
Population density:
| East Side Historic District: | 14,588 people per square mile |
| Wilmington: | 6,597 people per square mile |

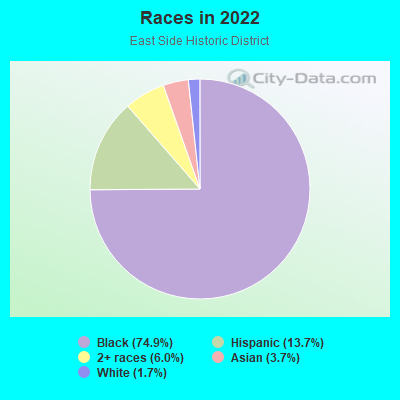
- 22474.9%Black
- 4113.7%Hispanic or Latino
- 186.0%Two or more races
- 113.7%Asian
- 51.7%White
Median household income in 2022:
| East Side Historic District: | $55,330 |
| Wilmington: | $52,768 |
Distribution of median household income
![Distribution of median household income]()
- 10Less than $10,000
- 30$10,000 to $19,999
- 15$20,000 to $29,999
- 7$30,000 to $39,999
- 11$40,000 to $49,999
- 15$50,000 to $59,999
- 11$60,000 to $74,999
- 6$75,000 to $99,999
- 14$100,000 to $124,999
- 6$125,000 to $149,999
- 20$150,000 to $199,999
- 6$200,000 or more

Distribution of owner-occupied house/condo value
![Distribution of owner-occupied house/condo value]()
- 11Less than $50,000
- 48$50,000 to $99,999
- 9$100,000 to $149,999
- 25$150,000 to $199,999
- 23$200,000 to $249,999
- 2$300,000 to $399,999

Distribution of rent paid by renters
![Distribution of rent paid by renters]()
- 5$100 to $199
- 12$200 to $299
- 7$300 to $399
- 2$400 to $499
- 2$500 to $599
- 5$600 to $699
- 9$700 to $799
- 15$800 to $899
- 11$900 to $999
- 14$1,000 to $1,249
- 6$1,250 to $1,499

Median rent in 2022:
| East Side Historic District: | $764 |
| Wilmington: | $941 |
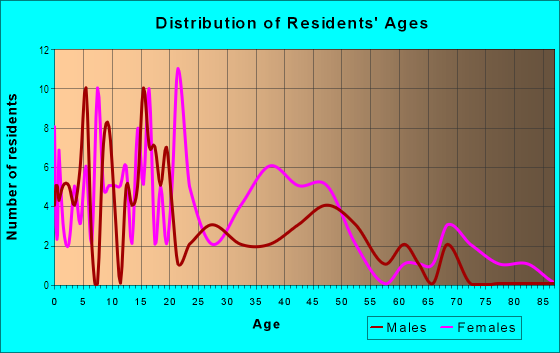
| Males: | 125 |
| Females: | 157 |
Males:
| This neighborhood: | 32.7 years |
| Whole city: | 37.1 years |
| This neighborhood: | 38.5 years |
| Whole city: | 41.1 years |
Average household size:
| East Side Historic District: | 2.4 people |
| Wilmington: | 2.1 people |
Percentage of family households:
| East Side Historic District: | 57.0% |
| Wilmington: | 32.8% |
| Here: | 22.5% |
| Wilmington: | 20.9% |
Percentage of married-couple families with children (among all households):
| East Side Historic District: | 21.2% |
| Wilmington: | 13.2% |
Percentage of single-mother households (among all households):
| East Side Historic District: | 32.0% |
| Wilmington: | 24.1% |
Percentage of never married males 15 years old and over:
Percentage of never married females 15 years old and over:
| East Side Historic District: | 20.8% |
| Wilmington: | 22.2% |
Percentage of never married females 15 years old and over:
| East Side Historic District: | 25.0% |
| city: | 28.6% |
Percentage of people that speak English not well or not at all:
| East Side Historic District: | 1.9% |
| Wilmington: | 2.4% |
Percentage of people born in this state:
Percentage of people born in another U.S. state:
Percentage of native residents but born outside the U.S.:
Percentage of foreign born residents:
| Here: | 54.4% |
| Wilmington: | 45.5% |
Percentage of people born in another U.S. state:
| East Side Historic District: | 36.0% |
| Wilmington: | 43.0% |
Percentage of native residents but born outside the U.S.:
| Here: | 3.5% |
| city: | 3.5% |
Percentage of foreign born residents:
| Here: | 6.1% |
| Wilmington: | 8.0% |
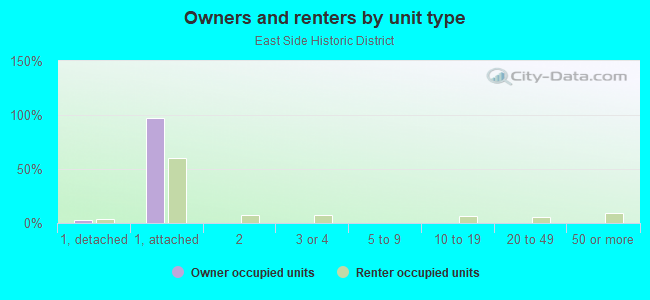
Owner-occupied
Renter-occupied

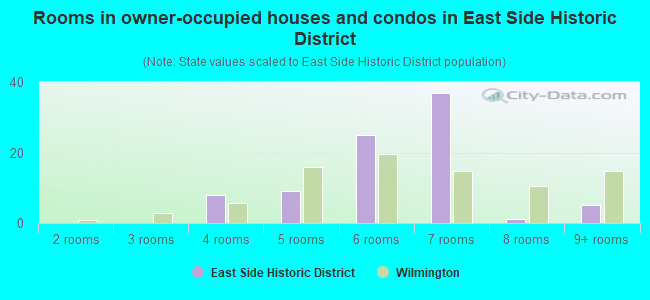
- Rooms in owner-occupied houses and condos in East Side Historic District
- 01 room
- 02 rooms
- 03 rooms
- 84 rooms
- 95 rooms
- 256 rooms
- 377 rooms
- 18 rooms
- 59+ rooms
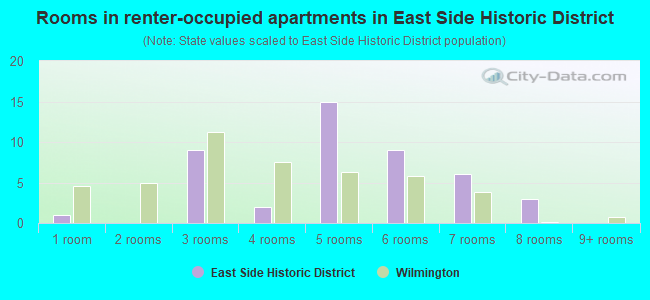
- Rooms in renter-occupied apartments in East Side Historic District
- 11 room
- 02 rooms
- 93 rooms
- 24 rooms
- 155 rooms
- 96 rooms
- 67 rooms
- 38 rooms
- 09+ rooms
Owner-occupied
Renter-occupied
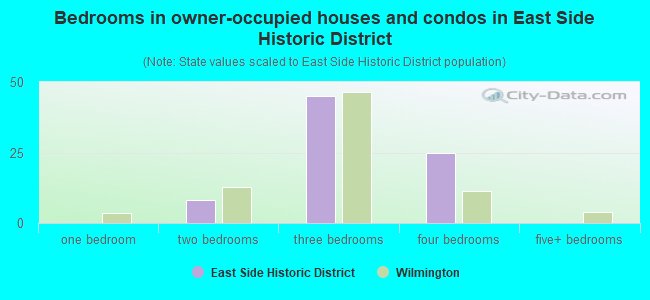
- Bedrooms in owner-occupied houses and condos in East Side Historic District
- 0no bedroom
- 01 bedroom
- 82 bedrooms
- 453 bedrooms
- 254 bedrooms
- 05+ bedrooms
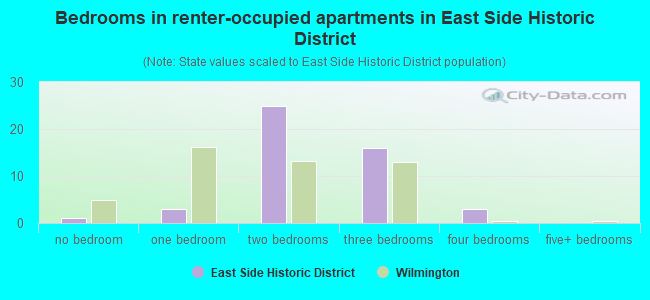
- Bedrooms in renter-occupied apartments in East Side Historic District
- 1no bedroom
- 31 bedroom
- 252 bedrooms
- 163 bedrooms
- 34 bedrooms
- 05+ bedrooms
Average number of cars or other vehicles available in houses/condos:
Average number of cars or other vehicles available in apartments:
| This neighborhood: | 1.7 |
| Wilmington: | 1.6 |
Average number of cars or other vehicles available in apartments:
| Here: | 0.5 |
| city: | 0.9 |
Percentage of units with a mortgage:
| East Side Historic District: | 75.2% |
| Wilmington: | 67.1% |
Average estimated value of townhouses or other attached units in 2022 (93.2% of all units):
| This neighborhood: | $133,633 |
| Delaware: | $291,415 |
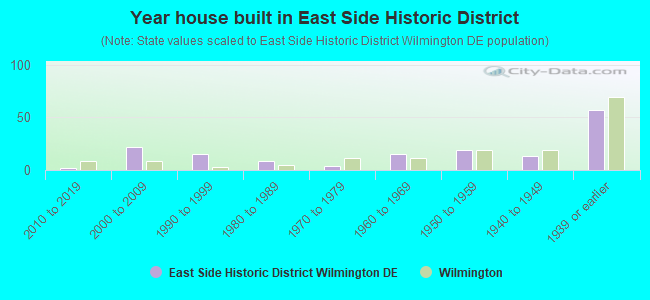
- Year house built in East Side Historic District
- 02020 or later
- 22010 to 2019
- 222000 to 2009
- 151990 to 1999
- 91980 to 1989
- 41970 to 1979
- 151960 to 1969
- 191950 to 1959
- 131940 to 1949
- 571939 or earlier
City-data.com crime index for city in 2020 (higher means more crime):
| City: | 649.2 |
| U.S. average: | 219.5 |
Travel time to work (commute)
![Travel time to work (commute)]()
- 3Less than 5 minutes
- 105 to 9 minutes
- 1310 to 14 minutes
- 2415 to 19 minutes
- 2520 to 24 minutes
- 1625 to 29 minutes
- 330 to 34 minutes
- 335 to 39 minutes
- 345 to 59 minutes
- 360 to 89 minutes
- 190 or more minutes

Means of transportation to work
![Means of transportation to work]()
- 68.3%91Drove a car alone
- 4.5%6Carpooled
- 13.5%18Bus
- 3.8%5Subway or elevated rail
- 8.3%11Walked
- 3.8%5Worked at home

Time leaving home to go to work
![Time leaving home to go to work]()
- 155:30 a.m. to 5:59 a.m.
- 66:00 a.m. to 6:29 a.m.
- 177:00 a.m. to 7:29 a.m.
- 97:30 a.m. to 7:59 a.m.
- 168:00 a.m. to 8:29 a.m.
- 98:30 a.m. to 8:59 a.m.
- 79:00 a.m. to 9:59 a.m.
- 310:00 a.m. to 10:59 a.m.
- 1712:00 p.m. to 3:59 p.m.
- 54:00 p.m. to 11:59 p.m.

Occupations of males:
- Percentage of males in business and financial operations occupations:
Here: 21.6% city: 5.8%
- Percentage of males in computer and mathematical occupations:
Here: 2.2% city: 3.9%
- Percentage of males in service occupations:
Here: 7.8% city: 18.7%
- Percentage of males in sales and office occupations:
Here: 18.3% city: 11.8%
- Percentage of males in production occupations:
Here: 24.4% city: 5.6%
- Percentage of males in transportation occupations:
Here: 19.3% city: 7.6%
- Percentage of males in material moving occupations:
Here: 6.9% city: 5.8%
Occupations of females:
- Percentage of females in management occupations (except farmers):
Here: 4.3% city: 10.8%
- Percentage of females in business and financial operations occupations:
Here: 4.8% city: 10.0%
- Percentage of females in community and social services occupations:
Here: 1.6% city: 4.0%
- Percentage of females in healthcare practitioners and technical occupations:
Here: 30.0% city: 8.1%
- Percentage of females in service occupations:
Here: 20.9% city: 21.3%
- Percentage of females in sales and office occupations:
Here: 23.8% city: 21.1%
- Percentage of females in production occupations:
Here: 8.7% city: 2.2%
- Percentage of females in transportation occupations:
Here: 7.5% city: 1.9%
- Percentage of females in material moving occupations:
Here: 1.8% city: 2.5%
Percentage of people 16-64 in Armed Forces:
| East Side Historic District: | 1.4% |
| Wilmington: | 0.4% |
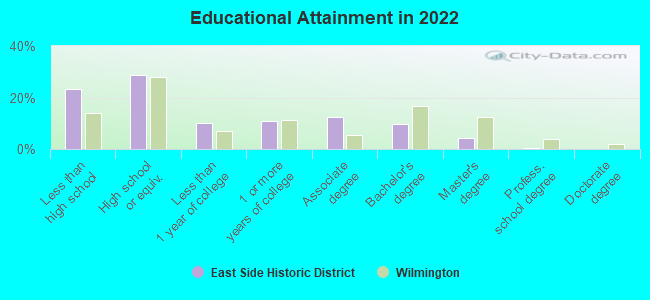
Education in this neighborhood (subdivision or community):
- Percentage of people 3 years and older in K-12 schools:
East Side Historic District: 15.6% Wilmington: 16.0%
- Percentage of people 3 years and older in undergraduate colleges:
East Side Historic District: 5.1% Wilmington: 3.1%
- Percentage of people 3 years and older in grad. or professional schools:
East Side Historic District: 0.4% Wilmington: 2.8%
- Percentage of students K-12 enrolled in private schools:
East Side Historic District: 9.3% Wilmington: 8.2%
Percentage of population below poverty level:
| East Side Historic District: | 26.6% |
| Wilmington: | 22.2% |
Median year owner moved in (as recorded in 2022):
Median year renter moved in (as recorded in 2022):
| East Side Historic District: | 1994 |
| Wilmington: | 2010 |
Median year renter moved in (as recorded in 2022):
| East Side Historic District: | 2014 |
| Wilmington: | 2020 |
Percentage of married-couple families with both working:
| East Side Historic District: | 16.5% |
| Wilmington: | 84.9% |
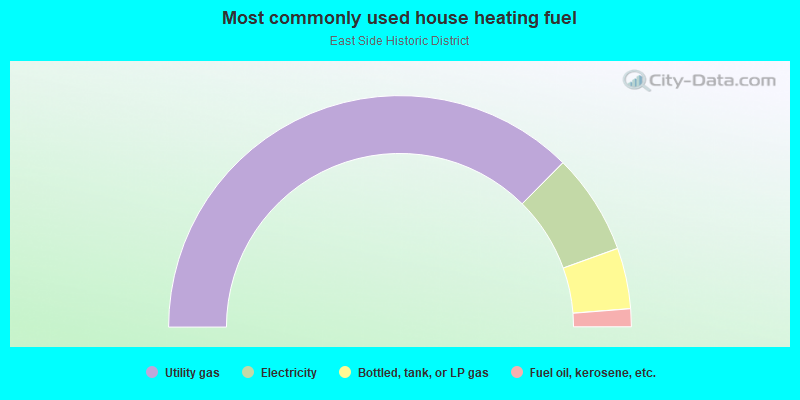
- 74.9%Utility gas
- 14.1%Electricity
- 8.5%Bottled, tank, or LP gas
- 2.5%Fuel oil, kerosene, etc.
Roads and streets:
E 9th St
Length: 0.17 miles
Directions: E-W, SE-NW
Address range: 500 to 699
Directions: E-W, SE-NW
Address range: 500 to 699
E 10th St
Length: 0.13 miles
Direction: E-W
Address range: 500 to 623
Direction: E-W
Address range: 500 to 623
N Pine St
Length: 0.13 miles
Direction: SW-NE
Address range: 826 to 999
Direction: SW-NE
Address range: 826 to 999
Kirkwood St
Length: 0.07 miles
Direction: SW-NE
Address range: 900 to 999
Direction: SW-NE
Address range: 900 to 999
Lombard St
Length: 0.07 miles
Direction: SW-NE
Address range: 900 to 999
Direction: SW-NE
Address range: 900 to 999