Downtown neighborhood in Bozeman, Montana (MT), 59715 detailed profile
Settings
X


Business Search - 14 Million verified businesses
Area: 0.098 square miles
Population: 524
Population density:
| Downtown: | 5,326 people per square mile |
| Bozeman: | 4,247 people per square mile |

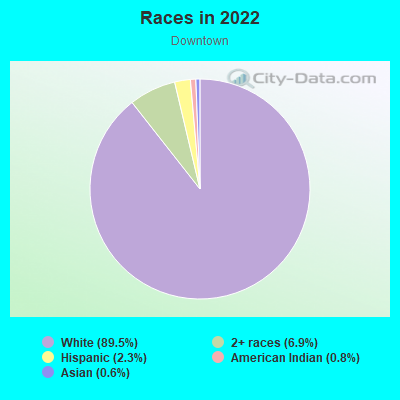
- 46989.5%White
- 366.9%Two or more races
- 122.3%Hispanic or Latino
- 40.8%American Indian
- 30.6%Asian
Median household income in 2022:
| Downtown: | $77,646 |
| Bozeman: | $74,113 |
Distribution of median household income
![Distribution of median household income]()
- 20Less than $10,000
- 8$10,000 to $19,999
- 21$20,000 to $29,999
- 23$30,000 to $39,999
- 27$40,000 to $49,999
- 24$50,000 to $59,999
- 50$60,000 to $74,999
- 44$75,000 to $99,999
- 21$100,000 to $124,999
- 25$125,000 to $149,999
- 8$150,000 to $199,999
- 64$200,000 or more

Distribution of owner-occupied house/condo value
![Distribution of owner-occupied house/condo value]()
- 4$50,000 to $99,999
- 3$100,000 to $149,999
- 4$200,000 to $249,999
- 7$300,000 to $399,999
- 10$400,000 to $499,999
- 43$500,000 to $749,999
- 17$750,000 to $999,999
- 43$1,000,000 or more

Distribution of rent paid by renters
![Distribution of rent paid by renters]()
- 15$100 to $199
- 7$200 to $299
- 6$400 to $499
- 12$500 to $599
- 28$600 to $699
- 33$700 to $799
- 4$800 to $899
- 19$900 to $999
- 32$1,000 to $1,249
- 33$1,250 to $1,499
- 9$1,500 to $1,999
- 25$2,000 or more

Median rent in 2022:
| Downtown: | $1,081 |
| Bozeman: | $1,343 |
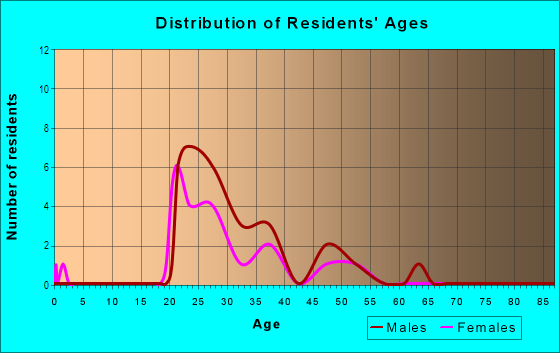
| Males: | 253 |
| Females: | 271 |
Males:
| This neighborhood: | 35.4 years |
| Whole city: | 27.8 years |
| This neighborhood: | 30.7 years |
| Whole city: | 28.9 years |
Average household size:
| Downtown: | 1.8 people |
| Bozeman: | 2.2 people |
Percentage of family households:
| Downtown: | 40.6% |
| Bozeman: | 36.1% |
| Here: | 34.6% |
| Bozeman: | 36.1% |
Percentage of married-couple families with children (among all households):
| Downtown: | 10.9% |
| Bozeman: | 31.7% |
Percentage of single-mother households (among all households):
| Downtown: | 30.5% |
| Bozeman: | 7.0% |
Percentage of never married males 15 years old and over:
Percentage of never married females 15 years old and over:
| Downtown: | 23.4% |
| Bozeman: | 30.7% |
Percentage of never married females 15 years old and over:
| Downtown: | 26.4% |
| city: | 22.0% |
Percentage of people that speak English not well or not at all:
| Downtown: | 0.0% |
| Bozeman: | 0.1% |
Percentage of people born in this state:
Percentage of people born in another U.S. state:
Percentage of native residents but born outside the U.S.:
Percentage of foreign born residents:
| Here: | 21.7% |
| Bozeman: | 29.8% |
Percentage of people born in another U.S. state:
| Downtown: | 72.5% |
| Bozeman: | 64.7% |
Percentage of native residents but born outside the U.S.:
| Here: | 0.5% |
| city: | 0.8% |
Percentage of foreign born residents:
| Here: | 5.2% |
| Bozeman: | 4.6% |
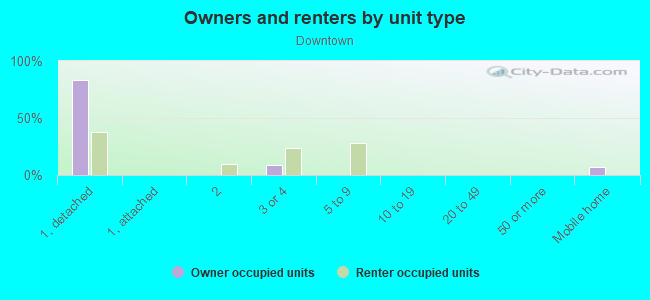
Owner-occupied
Renter-occupied

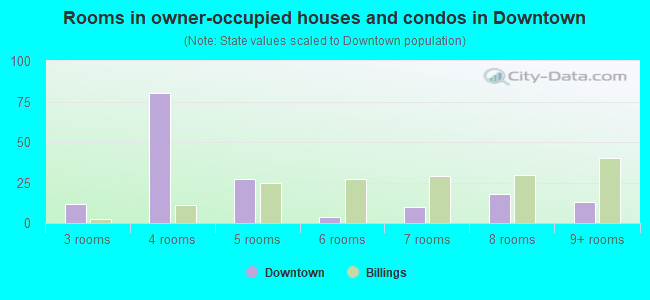
- Rooms in owner-occupied houses and condos in Downtown
- 01 room
- 02 rooms
- 03 rooms
- 144 rooms
- 185 rooms
- 126 rooms
- 127 rooms
- 108 rooms
- 619+ rooms
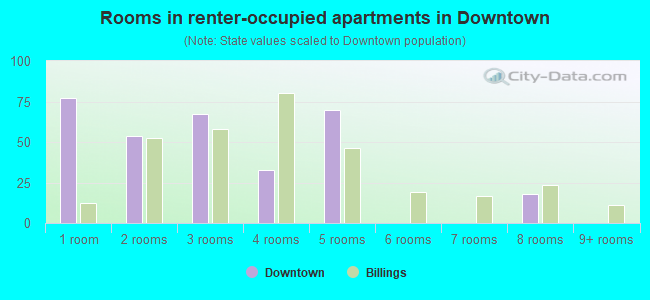
- Rooms in renter-occupied apartments in Downtown
- 271 room
- 162 rooms
- 453 rooms
- 434 rooms
- 115 rooms
- 106 rooms
- 247 rooms
- 48 rooms
- 109+ rooms
Owner-occupied
Renter-occupied
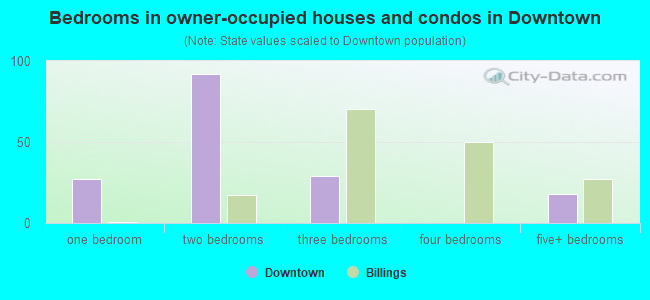
- Bedrooms in owner-occupied houses and condos in Downtown
- 0no bedroom
- 71 bedroom
- 292 bedrooms
- 543 bedrooms
- 264 bedrooms
- 155+ bedrooms
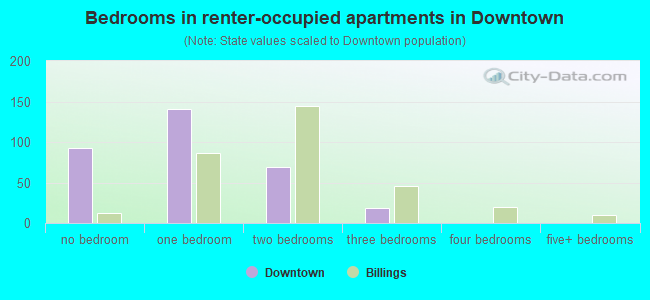
- Bedrooms in renter-occupied apartments in Downtown
- 31no bedroom
- 561 bedroom
- 542 bedrooms
- 103 bedrooms
- 134 bedrooms
- 65+ bedrooms
Average number of cars or other vehicles available in houses/condos:
Average number of cars or other vehicles available in apartments:
| This neighborhood: | 1.6 |
| Bozeman: | 2.0 |
Average number of cars or other vehicles available in apartments:
| Here: | 1.4 |
| city: | 1.8 |
Percentage of units with a mortgage:
| Downtown: | 61.8% |
| Bozeman: | 64.5% |
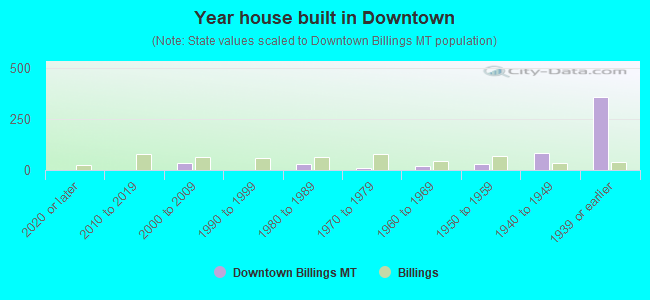
- Year house built in Downtown
- 32020 or later
- 162010 to 2019
- 122000 to 2009
- 311990 to 1999
- 81980 to 1989
- 191970 to 1979
- 181960 to 1969
- 361950 to 1959
- 41940 to 1949
- 2111939 or earlier
City-data.com crime index for city in 2020 (higher means more crime):
| City: | 160.5 |
| U.S. average: | 219.5 |
Travel time to work (commute)
![Travel time to work (commute)]()
- 18Less than 5 minutes
- 1005 to 9 minutes
- 5110 to 14 minutes
- 5715 to 19 minutes
- 2820 to 24 minutes
- 425 to 29 minutes
- 430 to 34 minutes
- 1645 to 59 minutes
- 1160 to 89 minutes
- 1390 or more minutes

Means of transportation to work
![Means of transportation to work]()
- 44.0%163Drove a car alone
- 6.2%23Carpooled
- 1.1%4Bus
- 14.6%54Bicycle
- 19.1%71Walked
- 12.7%47Other means
- 12.9%48Worked at home

Time leaving home to go to work
![Time leaving home to go to work]()
- 55:00 a.m. to 5:29 a.m.
- 25:30 a.m. to 5:59 a.m.
- 26:00 a.m. to 6:29 a.m.
- 296:30 a.m. to 6:59 a.m.
- 167:00 a.m. to 7:29 a.m.
- 547:30 a.m. to 7:59 a.m.
- 448:00 a.m. to 8:29 a.m.
- 418:30 a.m. to 8:59 a.m.
- 389:00 a.m. to 9:59 a.m.
- 810:00 a.m. to 10:59 a.m.
- 811:00 a.m. to 11:59 a.m.
- 3512:00 p.m. to 3:59 p.m.
- 114:00 p.m. to 11:59 p.m.

Occupations of males:
- Percentage of males in management occupations (except farmers):
Here: 29.0% city: 14.6%
- Percentage of males in business and financial operations occupations:
Here: 7.7% city: 4.5%
- Percentage of males in computer and mathematical occupations:
Here: 3.8% city: 4.5%
- Percentage of males in architecture and engineering occupations:
Here: 4.7% city: 3.6%
- Percentage of males in life, physical, and social science occupations:
Here: 1.8% city: 3.2%
- Percentage of males in community and social services occupations:
Here: 4.9% city: 1.1%
- Percentage of males in education, training, and library occupations:
Here: 9.6% city: 6.7%
- Percentage of males in healthcare practitioners and technical occupations:
Here: 8.0% city: 3.5%
- Percentage of males in service occupations:
Here: 16.3% city: 13.7%
- Percentage of males in sales and office occupations:
Here: 6.3% city: 13.3%
- Percentage of males in farming, fishing, and forestry occupations:
Here: 2.8% city: 1.3%
- Percentage of males in transportation occupations:
Here: 4.9% city: 2.1%
Occupations of females:
- Percentage of females in management occupations (except farmers):
Here: 3.9% city: 11.1%
- Percentage of females in business and financial operations occupations:
Here: 6.1% city: 4.5%
- Percentage of females in computer and mathematical occupations:
Here: 1.4% city: 2.6%
- Percentage of females in architecture and engineering occupations:
Here: 2.4% city: 1.2%
- Percentage of females in life, physical, and social science occupations:
Here: 12.7% city: 3.6%
- Percentage of females in community and social services occupations:
Here: 1.4% city: 1.9%
- Percentage of females in education, training, and library occupations:
Here: 5.8% city: 9.7%
- Percentage of females in arts, design, entertainment, sports, and media occupations:
Here: 5.8% city: 3.9%
- Percentage of females in healthcare practitioners and technical occupations:
Here: 1.6% city: 7.3%
- Percentage of females in service occupations:
Here: 28.4% city: 24.4%
- Percentage of females in sales and office occupations:
Here: 29.5% city: 22.1%
- Percentage of females in transportation occupations:
Here: 2.3% city: 0.6%
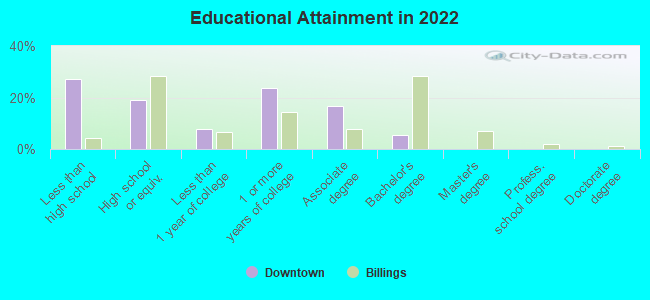
Education in this neighborhood (subdivision or community):
- Percentage of people 3 years and older in K-12 schools:
Downtown: 12.1% Bozeman: 9.9%
- Percentage of people 3 years and older in undergraduate colleges:
Downtown: 12.7% Bozeman: 20.9%
- Percentage of people 3 years and older in grad. or professional schools:
Downtown: 4.4% Bozeman: 4.4%
- Percentage of students K-12 enrolled in private schools:
Downtown: 0.0% Bozeman: 16.6%
Percentage of population below poverty level:
| Downtown: | 17.7% |
| Bozeman: | 14.7% |
Median year owner moved in (as recorded in 2022):
Median year renter moved in (as recorded in 2022):
| Downtown: | 2007 |
| Bozeman: | 2013 |
Median year renter moved in (as recorded in 2022):
| Downtown: | 2018 |
| Bozeman: | 2019 |
Percentage of married-couple families with both working:
| Downtown: | 58.8% |
| Bozeman: | 73.5% |
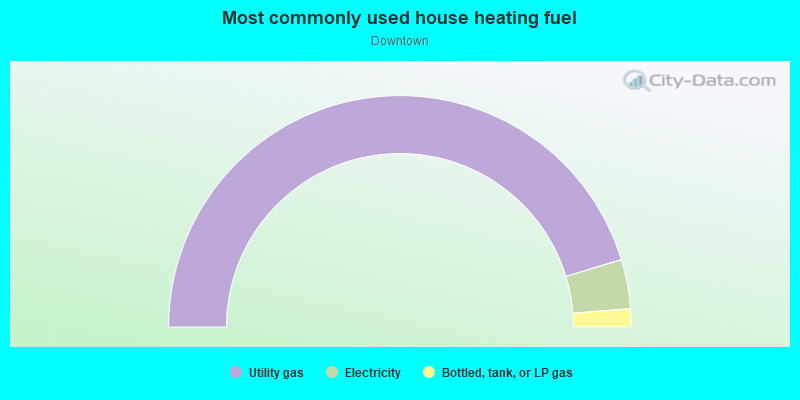
- 58.8%Utility gas
- 34.1%Electricity
- 7.0%Bottled, tank, or LP gas
Highways in this neighborhood:
State Hwy 84 (E Main St, US Hwy 191, Huffine Ln)
Length: 0.78 miles
Direction: E-W
Address range: 1 to 799
Direction: E-W
Address range: 1 to 799
State Hwy 84 (US Hwy 191, Huffine Ln, W Main St)
Length: 0.10 miles
Direction: E-W
Address range: 1 to 99
Direction: E-W
Address range: 1 to 99
N Rouse Ave
Length: 0.04 miles
Direction: N-S
Address range: 1 to 51
Direction: N-S
Address range: 1 to 51
Roads and streets:
E Babcock St
Length: 0.29 miles
Direction: E-W
Address range: 313 to 599
Direction: E-W
Address range: 313 to 599
N Broadway Ave
Length: 0.07 miles
Directions: N-S, SW-NE
Address range: 1 to 99
Directions: N-S, SW-NE
Address range: 1 to 99
S Rouse Ave
Length: 0.07 miles
Direction: N-S
Address range: 1 to 99
Direction: N-S
Address range: 1 to 99
S Church Ave
Length: 0.07 miles
Direction: N-S
Address range: 1 to 99
Direction: N-S
Address range: 1 to 99
S Wallace Ave
Length: 0.07 miles
Direction: N-S
Address range: 1 to 99
Direction: N-S
Address range: 1 to 99
N Bozeman Ave
Length: 0.04 miles
Direction: N-S
Address range: 1 to 52
Direction: N-S
Address range: 1 to 52
N Black Ave
Length: 0.04 miles
Direction: N-S
Address range: 1 to 51
Direction: N-S
Address range: 1 to 51
N Church Ave
Length: 0.04 miles
Direction: N-S
Address range: 1 to 51
Direction: N-S
Address range: 1 to 51
N Wallace Ave
Length: 0.04 miles
Direction: N-S
Address range: 1 to 51
Direction: N-S
Address range: 1 to 51
N Willson Ave
Length: 0.04 miles
Direction: N-S
Address range: 1 to 52
Direction: N-S
Address range: 1 to 52
S Tracy Ave
Length: 0.04 miles
Direction: N-S
Address range: 1 to 52
Direction: N-S
Address range: 1 to 52
N Tracy Ave
Length: 0.04 miles
Direction: N-S
Address range: 1 to 50
Direction: N-S
Address range: 1 to 50
S Willson Ave
Length: 0.04 miles
Direction: N-S
Address range: 1 to 51
Direction: N-S
Address range: 1 to 51
S Black Ave
Length: 0.04 miles
Direction: N-S
Address range: 1 to 50
Direction: N-S
Address range: 1 to 50
Other features:
Bozeman Crk
Length: 0.11 miles
Directions: N-S, SE-NW
Directions: N-S, SE-NW