Swansea, Massachusetts (MA) income map, earnings map, and wages data
The median household income in Swansea, MA in 2022 was $98,477, which was 4.1% greater than the median annual income of $94,488 across the entire state of Massachusetts. Compared to the median income of $52,524 in 2000 this represents an increase of 46.7%. The per capita income in 2022 was $44,403, which means an increase of 51.0% compared to 2000 when it was $21,776.
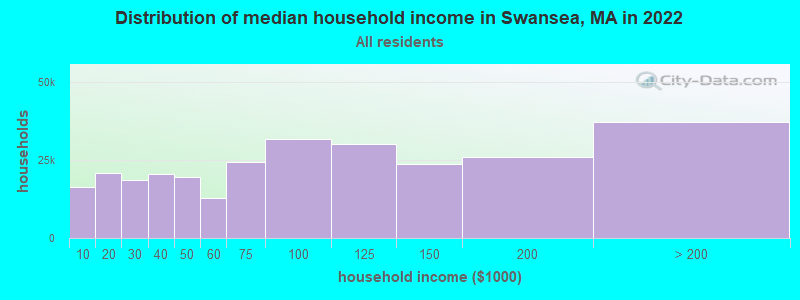
Income statistics for all residents
Median household income in Swansea, MA in 2022:| Swansea: | $98,478 |
| Massachusetts: | $94,488 |
Change in median household income between 2000 and 2022:| Swansea, Massachusetts: | +87.5% |
| Massachusetts: | +87.1% |
Number of households with income < $10k:| Swansea: | 5.8% (16,426) |
| State: | 5.2% (146,170) |
Number of households with income $10k - 20k:| Swansea: | 7.3% (20,643) |
| State: | 6.4% (180,001) |
Number of households with income $20k - 30k:| Swansea: | 6.6% (18,576) |
| State: | 5.6% (156,667) |
Number of households with income $30k - 40k:| Swansea: | 7.3% (20,618) |
| State: | 5.6% (157,168) |
Number of households with income $40k - 50k:| Swansea: | 6.9% (19,393) |
| Massachusetts: | 5.4% (151,455) |
Number of households with income $50k - 60k:| Swansea: | 4.6% (12,867) |
| State: | 5.1% (142,726) |
Number of households with income $60k - 75k:| Swansea: | 8.6% (24,249) |
| State: | 7.6% (212,203) |
Number of households with income $75k - 100k:| Swansea: | 11.3% (31,729) |
| Massachusetts: | 11.3% (317,064) |
Number of households with income $100k - 125k:| Swansea: | 10.7% (30,112) |
| State: | 9.7% (270,603) |
Number of households with income $125k - 150k:| Swansea: | 8.5% (23,818) |
| Massachusetts: | 8.0% (223,140) |
Number of households with income $150k - 200k:| Swansea: | 9.2% (26,046) |
| Massachusetts: | 11.0% (308,695) |
Number of households with income > $200k:| Swansea: | 13.2% (37,119) |
| State: | 19.0% (531,884) |
Aggregate household income in Swansea in 2022: $3,960,837,947
Median family income in Swansea in 2022:| Swansea: | $121,773 |
| State: | $120,263 |
Median non-family income in Swansea in 2022:| Swansea: | $41,211 |
| State: | $55,979 |
Change in median non-family income between 2000 and 2022:| Swansea, Massachusetts: | +93.6% |
| State: | +88.0% |
Median per capita income in Swansea in 2022:| Swansea: | $44,403 |
| State: | $54,025 |
Change in median per capita income between 2000 and 2022:| Swansea, Massachusetts: | +103.9% |
| State: | +108.2% |
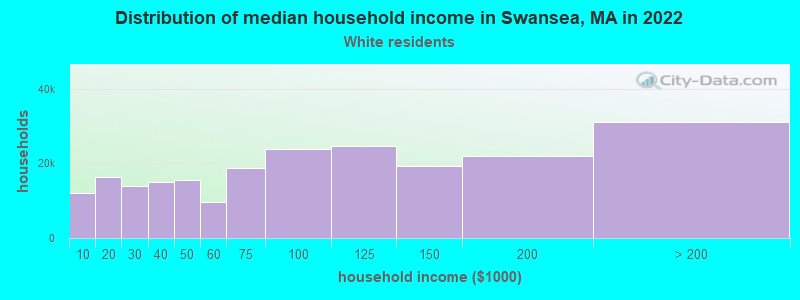
Income statistics for White residents
Median household income in Swansea, MA in 2022:| Swansea: | $100,583 |
| State: | $101,391 |
Change in median household income between 2000 and 2022:| Swansea, Massachusetts: | +92.2% |
| Massachusetts: | +93.3% |
Number of households with income < $10k:| Swansea: | 5.5% (12,170) |
| Massachusetts: | 4.4% (91,120) |
Number of households with income $10k - 20k:| Swansea: | 7.4% (16,449) |
| State: | 5.9% (122,055) |
Number of households with income $20k - 30k:| Swansea: | 6.3% (13,938) |
| State: | 5.1% (105,311) |
Number of households with income $30k - 40k:| Swansea: | 6.8% (15,074) |
| State: | 5.3% (110,239) |
Number of households with income $40k - 50k:| Swansea: | 7.0% (15,556) |
| State: | 5.0% (104,636) |
Number of households with income $50k - 60k:| Swansea: | 4.3% (9,598) |
| Massachusetts: | 4.8% (99,486) |
Number of households with income $60k - 75k:| Swansea: | 8.5% (18,800) |
| State: | 7.5% (155,124) |
Number of households with income $75k - 100k:| Swansea: | 10.7% (23,848) |
| Massachusetts: | 11.4% (236,252) |
Number of households with income $100k - 125k:| Swansea: | 11.0% (24,548) |
| Massachusetts: | 9.9% (204,731) |
Number of households with income $125k - 150k:| Swansea: | 8.7% (19,318) |
| State: | 8.5% (175,324) |
Number of households with income $150k - 200k:| Swansea: | 9.8% (21,848) |
| Massachusetts: | 11.7% (242,980) |
Number of households with income > $200k:| Swansea: | 14.0% (31,074) |
| Massachusetts: | 20.5% (425,966) |
Aggregate household income in Swansea in 2022: $3,225,141,940
Median family income in Swansea in 2022:| Swansea: | $125,661 |
| Massachusetts: | $133,153 |
Number of families with income < $10k:| Swansea: | 2.3% (90) |
| State: | 2.0% (25,038) |
Number of families with income $10k - 20k:| Swansea: | 1.2% (48) |
| State: | 2.1% (26,403) |
Number of families with income $20k - 30k:| Swansea: | 2.8% (108) |
| State: | 2.6% (32,525) |
Number of families with income $30k - 40k:| Swansea: | 5.8% (222) |
| Massachusetts: | 3.9% (48,079) |
Number of families with income $40k - 50k:| Swansea: | 5.4% (209) |
| State: | 3.8% (46,908) |
Number of families with income $50k - 60k:| Swansea: | 5.4% (207) |
| Massachusetts: | 3.8% (46,476) |
Number of families with income $60k - 75k:| Swansea: | 9.3% (359) |
| State: | 6.4% (79,040) |
Number of families with income $75k - 100k:| Swansea: | 13.1% (506) |
| State: | 11.1% (137,395) |
Number of families with income $100k - 125k:| Swansea: | 12.6% (484) |
| State: | 11.1% (136,771) |
Number of families with income $125k - 150k:| Swansea: | 14.9% (575) |
| State: | 10.0% (123,709) |
Number of families with income $150k - 200k:| Swansea: | 19.0% (733) |
| Massachusetts: | 14.7% (181,602) |
Number of families with income > $200k:| Swansea: | 8.0% (309) |
| State: | 28.5% (351,887) |
Median non-family income in Swansea in 2022:| Swansea: | $40,349 |
| State: | $59,323 |
Change in median non-family income between 2000 and 2022:| Swansea, Massachusetts: | +92.7% |
| State: | +94.3% |
Median per capita income in Swansea in 2022:| Swansea: | $47,380 |
| State: | $60,804 |
Change in median per capita income between 2000 and 2022:| Swansea, Massachusetts: | +115.0% |
| State: | +118.7% |
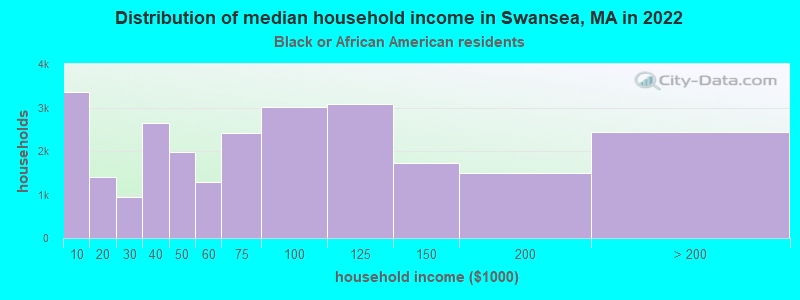
Income statistics for Black or African American residents
Median household income in Swansea, MA in 2022:| Swansea: | $170,197 |
| State: | $63,189 |
Change in median household income between 2000 and 2022:| Swansea, Massachusetts: | +138.9% |
| State: | +87.4% |
Number of households with income < $10k:| Swansea: | 13.0% (3,348) |
| Massachusetts: | 9.1% (15,797) |
Number of households with income $10k - 20k:| Swansea: | 5.4% (1,394) |
| Massachusetts: | 9.4% (16,267) |
Number of households with income $20k - 30k:| Swansea: | 3.7% (952) |
| State: | 7.8% (13,520) |
Number of households with income $30k - 40k:| Swansea: | 10.3% (2,652) |
| Massachusetts: | 8.3% (14,412) |
Number of households with income $40k - 50k:| Swansea: | 7.7% (1,976) |
| State: | 7.9% (13,790) |
Number of households with income $50k - 60k:| Swansea: | 5.0% (1,292) |
| State: | 5.8% (10,041) |
Number of households with income $60k - 75k:| Swansea: | 9.4% (2,420) |
| State: | 8.5% (14,822) |
Number of households with income $75k - 100k:| Swansea: | 11.7% (3,004) |
| State: | 11.0% (19,122) |
Number of households with income $100k - 125k:| Swansea: | 11.9% (3,070) |
| State: | 8.4% (14,575) |
Number of households with income $125k - 150k:| Swansea: | 6.7% (1,729) |
| State: | 6.0% (10,429) |
Number of households with income $150k - 200k:| Swansea: | 5.8% (1,499) |
| State: | 7.2% (12,539) |
Number of households with income > $200k:| Swansea: | 9.4% (2,432) |
| Massachusetts: | 10.5% (18,185) |
Aggregate household income in Swansea in 2022: $1,285,805
Median family income in Swansea in 2022:| Swansea: | $185,406 |
| State: | $79,815 |
Median per capita income in Swansea in 2022:| Swansea: | $13,561 |
| Massachusetts: | $33,524 |
Change in median per capita income between 2000 and 2022:| Swansea, Massachusetts: | +99.0% |
| State: | +109.4% |
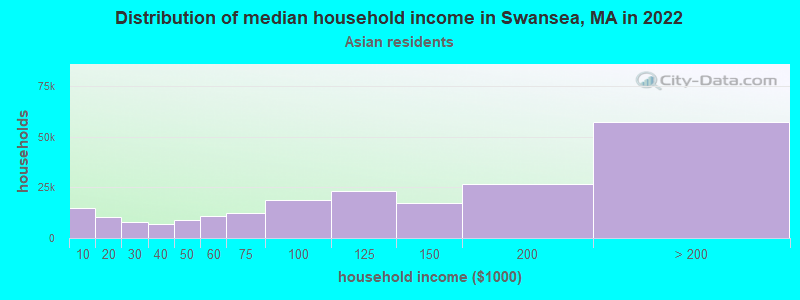
Income statistics for Asian residents
Median household income in Swansea, MA in 2022:| Swansea: | $142,848 |
| State: | $117,855 |
Change in median household income between 2000 and 2022:| Swansea, Massachusetts: | +127.6% |
| Massachusetts: | +129.9% |
Number of households with income < $10k:| Swansea: | 6.8% (14,664) |
| State: | 6.8% (11,982) |
Number of households with income $10k - 20k:| Swansea: | 4.8% (10,251) |
| Massachusetts: | 4.8% (8,376) |
Number of households with income $20k - 30k:| Swansea: | 3.7% (8,026) |
| Massachusetts: | 3.7% (6,558) |
Number of households with income $30k - 40k:| Swansea: | 3.3% (7,035) |
| State: | 3.3% (5,748) |
Number of households with income $40k - 50k:| Swansea: | 4.1% (8,802) |
| State: | 4.1% (7,192) |
Number of households with income $50k - 60k:| Swansea: | 5.0% (10,689) |
| State: | 5.0% (8,734) |
Number of households with income $60k - 75k:| Swansea: | 5.8% (12,487) |
| State: | 5.8% (10,203) |
Number of households with income $75k - 100k:| Swansea: | 8.6% (18,546) |
| Massachusetts: | 8.6% (15,154) |
Number of households with income $100k - 125k:| Swansea: | 10.8% (23,182) |
| Massachusetts: | 10.8% (18,942) |
Number of households with income $125k - 150k:| Swansea: | 8.0% (17,179) |
| State: | 8.0% (14,037) |
Number of households with income $150k - 200k:| Swansea: | 12.5% (26,748) |
| State: | 12.5% (21,856) |
Number of households with income > $200k:| Swansea: | 26.6% (57,146) |
| State: | 26.6% (46,694) |
Aggregate household income in Swansea in 2022: $13,350,745
Median family income in Swansea in 2022:| Swansea: | $142,244 |
| State: | $140,113 |
Number of families with income $10k - 20k:| Swansea: | 13.0% (6) |
| State: | 3.5% (4,118) |
Number of families with income $50k - 60k:| Swansea: | 26.3% (12) |
| State: | 3.9% (4,606) |
Number of families with income $60k - 75k:| Swansea: | 13.1% (6) |
| State: | 6.1% (7,105) |
Number of families with income $75k - 100k:| Swansea: | 47.6% (22) |
| State: | 8.5% (10,022) |
Median per capita income in Swansea in 2022:| Swansea: | $52,836 |
| State: | $58,900 |
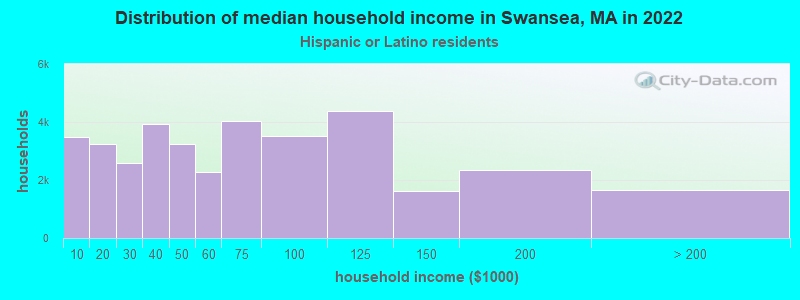
Income statistics for Hispanic or Latino residents
Median household income in Swansea, MA in 2022:| Swansea: | $122,375 |
| State: | $61,523 |
Number of households with income < $10k:| Swansea: | 9.5% (3,467) |
| State: | 8.8% (25,307) |
Number of households with income $10k - 20k:| Swansea: | 8.9% (3,249) |
| Massachusetts: | 10.0% (28,653) |
Number of households with income $20k - 30k:| Swansea: | 7.1% (2,591) |
| Massachusetts: | 8.8% (25,189) |
Number of households with income $30k - 40k:| Swansea: | 10.8% (3,939) |
| Massachusetts: | 7.2% (20,822) |
Number of households with income $40k - 50k:| Swansea: | 9.0% (3,252) |
| State: | 7.2% (20,817) |
Number of households with income $50k - 60k:| Swansea: | 6.3% (2,285) |
| Massachusetts: | 6.5% (18,748) |
Number of households with income $60k - 75k:| Swansea: | 11.1% (4,021) |
| State: | 8.8% (25,390) |
Number of households with income $75k - 100k:| Swansea: | 9.7% (3,516) |
| State: | 12.0% (34,488) |
Number of households with income $100k - 125k:| Swansea: | 12.1% (4,392) |
| State: | 8.6% (24,599) |
Number of households with income $125k - 150k:| Swansea: | 4.5% (1,629) |
| State: | 6.2% (17,743) |
Number of households with income $150k - 200k:| Swansea: | 6.4% (2,334) |
| Massachusetts: | 7.3% (21,017) |
Number of households with income > $200k:| Swansea: | 4.6% (1,659) |
| State: | 8.6% (24,606) |
Aggregate household income in Swansea in 2022: $3,398,091
Median family income in Swansea in 2022:| Swansea: | $117,212 |
| State: | $66,072 |
Number of families with income < $10k:| Swansea: | 8.6% (37) |
| State: | 6.2% (12,456) |
Number of families with income $10k - 20k:| Swansea: | 2.2% (10) |
| State: | 6.0% (12,071) |
Number of families with income $20k - 30k:| Swansea: | 11.9% (51) |
| State: | 10.1% (20,376) |
Number of families with income $30k - 40k:| Swansea: | 11.3% (48) |
| Massachusetts: | 8.2% (16,470) |
Number of families with income $40k - 50k:| Swansea: | 6.2% (26) |
| Massachusetts: | 7.4% (14,829) |
Number of families with income $50k - 60k:| Swansea: | 3.4% (15) |
| State: | 7.3% (14,643) |
Number of families with income $60k - 75k:| Swansea: | 12.4% (53) |
| Massachusetts: | 10.6% (21,252) |
Number of families with income $75k - 100k:| Swansea: | 13.2% (56) |
| State: | 12.0% (24,088) |
Number of families with income $100k - 125k:| Swansea: | 10.3% (44) |
| State: | 8.9% (17,954) |
Number of families with income $125k - 150k:| Swansea: | 9.2% (39) |
| Massachusetts: | 6.9% (13,837) |
Number of families with income $150k - 200k:| Swansea: | 9.6% (41) |
| State: | 7.3% (14,683) |
Number of families with income > $200k:| Swansea: | 1.6% (7) |
| State: | 9.3% (18,741) |
Median per capita income in Swansea in 2022:| Swansea: | $13,964 |
| State: | $28,993 |
Change in median per capita income between 2000 and 2022:| Swansea, Massachusetts: | +98.7% |
| State: | +142.4% |
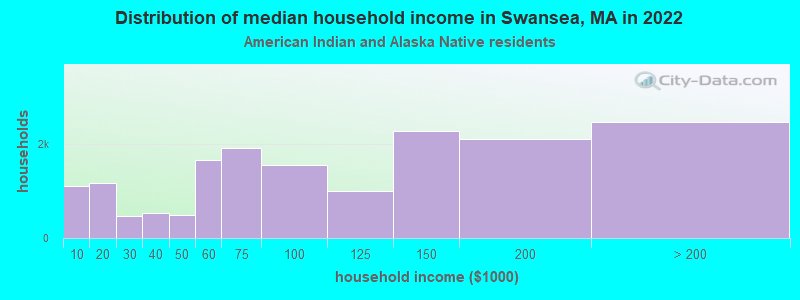
Income statistics for American Indian and Alaska Native residents
Median household income in Swansea, MA in 2022:| Swansea: | $213,417 |
| State: | $87,730 |
Change in median household income between 2000 and 2022:| Swansea, Massachusetts: | +134.6% |
| State: | +138.3% |
Number of households with income < $10k:| Swansea: | 6.6% (1,114) |
| State: | 6.6% (451) |
Number of households with income $10k - 20k:| Swansea: | 7.0% (1,176) |
| State: | 7.0% (476) |
Number of households with income $20k - 30k:| Swansea: | 2.8% (474) |
| State: | 2.8% (192) |
Number of households with income $30k - 40k:| Swansea: | 3.2% (539) |
| State: | 3.2% (218) |
Number of households with income $40k - 50k:| Swansea: | 2.9% (492) |
| State: | 2.9% (199) |
Number of households with income $50k - 60k:| Swansea: | 9.9% (1,673) |
| Massachusetts: | 9.9% (677) |
Number of households with income $60k - 75k:| Swansea: | 11.5% (1,930) |
| State: | 11.5% (781) |
Number of households with income $75k - 100k:| Swansea: | 9.2% (1,554) |
| State: | 9.2% (629) |
Number of households with income $100k - 125k:| Swansea: | 6.0% (1,003) |
| State: | 6.0% (406) |
Number of households with income $125k - 150k:| Swansea: | 13.5% (2,276) |
| State: | 13.5% (921) |
Number of households with income $150k - 200k:| Swansea: | 12.6% (2,123) |
| State: | 12.6% (859) |
Number of households with income > $200k:| Swansea: | 14.7% (2,478) |
| Massachusetts: | 14.7% (1,003) |
Aggregate household income in Swansea in 2022: $790,096
Median non-family income in Swansea in 2022:| Swansea: | $81,592 |
| Massachusetts: | $75,379 |
Median per capita income in Swansea in 2022:| Swansea: | $19,039 |
| Massachusetts: | $39,434 |
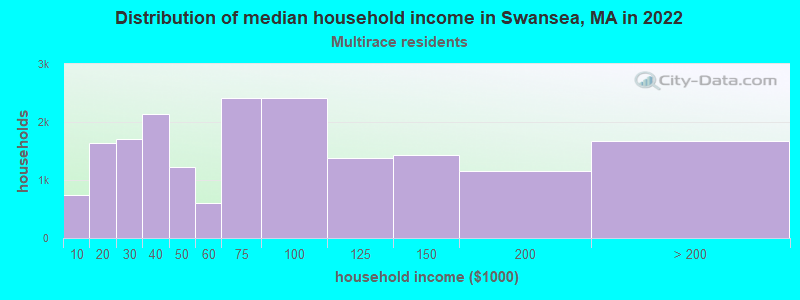
Income statistics for Multirace residents
Median household income in Swansea, MA in 2022:| Swansea: | $72,666 |
| Massachusetts: | $71,552 |
Change in median household income between 2000 and 2022:| Swansea, Massachusetts: | +110.4% |
| State: | +109.0% |
Number of households with income < $10k:| Swansea: | 4.0% (734) |
| Massachusetts: | 6.6% (15,127) |
Number of households with income $10k - 20k:| Swansea: | 8.9% (1,644) |
| Massachusetts: | 9.2% (21,158) |
Number of households with income $20k - 30k:| Swansea: | 9.2% (1,704) |
| State: | 7.8% (18,016) |
Number of households with income $30k - 40k:| Swansea: | 11.6% (2,142) |
| State: | 7.9% (18,260) |
Number of households with income $40k - 50k:| Swansea: | 6.6% (1,230) |
| State: | 5.6% (13,027) |
Number of households with income $50k - 60k:| Swansea: | 3.3% (607) |
| State: | 5.6% (12,909) |
Number of households with income $60k - 75k:| Swansea: | 13.0% (2,411) |
| State: | 9.0% (20,800) |
Number of households with income $75k - 100k:| Swansea: | 13.1% (2,422) |
| State: | 12.1% (27,875) |
Number of households with income $100k - 125k:| Swansea: | 7.5% (1,387) |
| State: | 8.1% (18,754) |
Number of households with income $125k - 150k:| Swansea: | 7.7% (1,434) |
| State: | 6.8% (15,621) |
Number of households with income $150k - 200k:| Swansea: | 6.2% (1,149) |
| State: | 9.4% (21,618) |
Number of households with income > $200k:| Swansea: | 9.0% (1,669) |
| State: | 12.0% (27,592) |
Aggregate household income in Swansea in 2022: $24,682,853
Median family income in Swansea in 2022:| Swansea: | $76,678 |
| State: | $78,380 |
Number of families with income $10k - 20k:| Swansea: | 6.9% (13) |
| State: | 4.9% (7,678) |
Number of families with income $20k - 30k:| Swansea: | 31.8% (59) |
| Massachusetts: | 8.5% (13,245) |
Number of families with income $40k - 50k:| Swansea: | 3.4% (6) |
| State: | 5.3% (8,255) |
Number of families with income $50k - 60k:| Swansea: | 6.4% (12) |
| Massachusetts: | 6.7% (10,445) |
Number of families with income $75k - 100k:| Swansea: | 51.6% (96) |
| State: | 12.1% (18,758) |
Median non-family income in Swansea in 2022:| Swansea: | $101,007 |
| Massachusetts: | $42,253 |
Median per capita income in Swansea in 2022:| Swansea: | $28,629 |
| Massachusetts: | $34,029 |
Change in median per capita income between 2000 and 2022:| Swansea, Massachusetts: | +76.3% |
| State: | +132.1% |
Income statistics for other residents
Number of households with income < $10k:| Swansea: | 9.8% (15) |
| State: | 8.4% (11,559) |
Number of households with income $10k - 20k:| Swansea: | 8.5% (13) |
| State: | 8.4% (11,499) |
Number of households with income $20k - 30k:| Swansea: | 12.4% (19) |
| State: | 9.5% (13,070) |
Number of households with income $30k - 40k:| Swansea: | 7.8% (12) |
| State: | 6.0% (8,291) |
Number of households with income $40k - 50k:| Swansea: | 5.9% (9) |
| State: | 9.2% (12,611) |
Number of households with income $50k - 60k:| Swansea: | 10.5% (16) |
| State: | 7.9% (10,879) |
Number of households with income $60k - 75k:| Swansea: | 5.2% (8) |
| State: | 7.5% (10,239) |
Number of households with income $75k - 100k:| Swansea: | 11.1% (17) |
| Massachusetts: | 13.1% (18,032) |
Number of households with income $100k - 125k:| Swansea: | 9.2% (14) |
| Massachusetts: | 9.6% (13,141) |
Number of households with income $125k - 150k:| Swansea: | 7.8% (12) |
| Massachusetts: | 5.0% (6,808) |
Number of households with income $150k - 200k:| Swansea: | 8.5% (13) |
| State: | 6.4% (8,843) |
Number of households with income > $200k:| Swansea: | 3.3% (5) |
| State: | 9.0% (12,396) |
Aggregate household income in Swansea in 2022: $11,579,672
Median family income in Swansea in 2022:| Swansea: | $228,095 |
| State: | $66,840 |
Number of families with income $20k - 30k:| Swansea: | 26.5% (28) |
| State: | 10.4% (10,595) |
Number of families with income $75k - 100k:| Swansea: | 73.5% (77) |
| Massachusetts: | 12.8% (12,997) |
Median per capita income in Swansea in 2022:| Swansea: | $29,180 |
| State: | $30,797 |
Change in median per capita income between 2000 and 2022:| Swansea, Massachusetts: | +128.7% |
| State: | +188.5% |