Westbury, NY (New York) Houses and Residents
Estimated median house or condo value in 2022: $598,621 (it was $221,900 in 2000 )
Westbury:
$598,621New York:
$400,400
Lower value quartile - upper value quartile: $451,940 - $735,084Mean price in 2022: Detached houses: $611,244 Here:
$611,244State:
$476,719
Townhouses or other attached units: $749,264 Here:
$749,264State:
$699,270
In 2-unit structures: $667,063 Here:
$667,063State:
$713,077
In 5-or-more-unit structures: $362,225 Here:
$362,225State:
$912,009
Total population: 15,329 (Urban population: 14,263, Rural population: 0)
Houses: 5,409 (5,210 occupied: 4,266 owner occupied, 934 renter occupied )
% of renters here:
18%State:
46%
Housing density: 2,267 houses/condos per square mile
Median price asked for vacant for-sale houses and condos in 2022: $1,282,945.
Median contract rent in 2022: $1,943 (lower quartile is $1,521, upper quartile is over $2,000)
Median rent asked for vacant for-rent units in 2022: $7,045
Median gross rent in Westbury, NY in 2022: over $2,000
Housing units in Westbury with a mortgage: 2,747 (480 second mortgage, 0 home equity loan, 406 both second mortgage and home equity loan )Houses without a mortgage: 60
Median household income for houses/condos with a mortgage: $152,764
Median household income for apartments without a mortgage: $87,751
Median monthly housing costs: $2,364
Data:
Median house or condo value ($)
Median house or condo value ($ change since 2000)
Median house or condo value ($) - White
Median house or condo value ($) - Black or African American
Median house or condo value ($) - Asian
Median house or condo value ($) - Hispanic or Latino
Median house or condo value ($) - American Indian and Alaska Native
Median house or condo value ($) - Multirace
Median house or condo value ($) - Other Race
Median price asked for mobile homes ($)
Household density (households per square mile)
Mean house or condo value by units in structure - 1, detached ($)
Mean house or condo value by units in structure - 1, attached ($)
Mean house or condo value by units in structure - 2 ($)
Mean house or condo value by units in structure by units in structure - 3 or 4 ($)
Mean house or condo value by units in structure - 5 or more ($)
Mean house or condo value by units in structure - Boat, RV, van, etc. ($)
Mean house or condo value by units in structure - Mobile home ($)
Median contract rent ($)
Median contract rent - Lower quartile ($)
Median contract rent - Upper quartile ($)
Median gross rent ($)
Urban houses (%)
Rural houses (%)
Houses occupied (%)
Houses occupied (% change since 2000)
Houses owner occupied (%)
Houses owner occupied (% change since 2000)
Houses renter occupied (%)
Houses renter occupied (% change since 2000)
Vacant housing units - For rent (%)
Vacant housing units - For rent (% change since 2000)
Vacant housing units - For sale only (%)
Vacant housing units - For sale only (% change since 2000)
Vacant housing units - Rented or sold, not occupied (%)
Vacant housing units - Rented or sold, not occupied (% change since 2000)
Vacant housing units - For seasonal, recreational, or occasional use (%)
Vacant housing units - For seasonal, recreational, or occasional use (% change since 2000)
Vacant housing units - For migrant workers (%)
Vacant housing units - For migrant workers (% change since 2000)
Vacant housing units - Other vacant (%)
Vacant housing units - Other vacant (% change since 2000)
Median monthly housing costs ($)
Median household income for houses/condos with a mortgage ($)
Median household income for houses/condos without a mortgage ($)
Median household income ($)
Median household income ($) - White
Median household income ($) - Black or African American
Median household income ($) - Asian
Median household income ($) - Hispanic or Latino
Median household income ($) - American Indian and Alaska Native
Median household income ($) - Multirace
Median household income ($) - Other Race
Mortgage status - with mortgage (%)
Mortgage status - with second mortgage (%)
Mortgage status - with home equity loan (%)
Mortgage status - with both second mortgage and home equity loan (%)
Mortgage status - without a mortgage (%)
Median year house/condo built
Median year apartment built
Household type by relationship - Male householder living alone (%)
Household type by relationship - Male householder not living alone (%)
Household type by relationship - Female householder living alone (%)
Household type by relationship - Female householder not living alone (%)
Household type by relationship - Opposite-Sex spouse (%)
Household type by relationship - Same-Sex spouse (%)
Household type by relationship - Opposite-Sex unmarried partner (%)
Household type by relationship - Same-Sex unmarried partner (%)
Household type by relationship - In group quarters (%)
Size of family households - 2-person household (%)
Size of family households - 3-person household (%)
Size of family households - 4-person household (%)
Size of family households - 5-person household (%)
Size of family households - 6-person household (%)
Size of family households - 7-or-more-person household (%)
Size of nonfamily households - 1-person household (%)
Size of nonfamily households - 2-person household (%)
Size of nonfamily households - 3-person household (%)
Size of nonfamily households - 4-person household (%)
Size of nonfamily households - 5-person household (%)
Size of nonfamily households - 6-person household (%)
Size of nonfamily households - 7-or-moreperson household (%)
Year house built - Built 2010 or later (%)
Year house built - Built 2000 to 2009 (%)
Year house built - Built 1990 to 1999 (%)
Year house built - Built 1980 to 1989 (%)
Year house built - Built 1970 to 1979 (%)
Year house built - Built 1960 to 1969 (%)
Year house built - Built 1950 to 1959 (%)
Year house built - Built 1940 to 1949 (%)
Year house built - Built 1939 or earlier (%)
Median number of rooms in houses and condos
Median number of rooms in apartments
Median number of bedrooms in owner occupied houses
Mean number of bedrooms in owner occupied houses
Median number of bedrooms in renter occupied houses
Mean number of bedrooms in renter occupied houses
Median number of vehichles in owner occupied houses
Mean number of vehichles in owner occupied houses
Median number of vehichles in renter occupied houses
Mean number of vehichles in renter occupied houses
Rooms in owner-occupied houses - 1 room (%)
Rooms in owner-occupied houses - 2 rooms (%)
Rooms in owner-occupied houses - 3 rooms (%)
Rooms in owner-occupied houses - 4 rooms (%)
Rooms in owner-occupied houses - 5 rooms (%)
Rooms in owner-occupied houses - 6 rooms (%)
Rooms in owner-occupied houses - 7 rooms (%)
Rooms in owner-occupied houses - 8 rooms (%)
Rooms in owner-occupied houses - 9+ rooms (%)
Rooms in renter-occupied houses - 1 room (%)
Rooms in renter-occupied houses - 2 rooms (%)
Rooms in renter-occupied houses - 3 rooms (%)
Rooms in renter-occupied houses - 4 rooms (%)
Rooms in renter-occupied houses - 5 rooms (%)
Rooms in renter-occupied houses - 6 rooms (%)
Rooms in renter-occupied houses - 7 rooms (%)
Rooms in renter-occupied houses - 8 rooms (%)
Rooms in renter-occupied houses - 9+ rooms (%)
Bedrooms in owner-occupied houses - no bedrooms (%)
Bedrooms in owner-occupied houses - 1 bedroom (%)
Bedrooms in owner-occupied houses - 2 bedrooms (%)
Bedrooms in owner-occupied houses - 3 bedrooms (%)
Bedrooms in owner-occupied houses - 4 bedrooms (%)
Bedrooms in owner-occupied houses - 5+ bedrooms (%)
Bedrooms in renter-occupied houses - no bedrooms (%)
Bedrooms in renter-occupied houses - 1 bedroom (%)
Bedrooms in renter-occupied houses - 2 bedrooms (%)
Bedrooms in renter-occupied houses - 3 bedrooms (%)
Bedrooms in renter-occupied houses - 4 bedrooms (%)
Bedrooms in renter-occupied houses - 5+ bedrooms (%)
Vehicles available in owner-occupied houses - no vehicle available (%)
Vehicles available in owner-occupied houses - 1 vehicle available(%)
Vehicles available in owner-occupied houses - 2 Vehicles available (%)
Vehicles available in owner-occupied houses - 3 Vehicles available (%)
Vehicles available in owner-occupied houses - 4 Vehicles available (%)
Vehicles available in owner-occupied houses - 5+ Vehicles available (%)
Vehicles available in renter-occupied houses - no vehicle available (%)
Vehicles available in renter-occupied houses - 1 vehicle available (%)
Vehicles available in renter-occupied houses - 2 Vehicles available (%)
Vehicles available in renter-occupied houses - 3 Vehicles available (%)
Vehicles available in renter-occupied houses - 4 Vehicles available (%)
Vehicles available in renter-occupied houses - 5+ Vehicles available (%)
Housing units in structures - 1, detached (%)
Housing units in structures - 1, attached (%)
Housing units in structures - 2 (%)
Housing units in structures - 3 or 4 (%)
Housing units in structures - 5 to 9 (%)
Housing units in structures - 10 to 19 (%)
Housing units in structures - 20 to 49 (%)
Housing units in structures - 50 or more (%)
Housing units in structures - Mobile home (%)
Housing units in structures - Boat, RV, van, etc. (%)
Housing units in structures - Owners - 1, detached (%)
Housing units in structures - Owners - 1, attached (%)
Housing units in structures - Owners - 2 (%)
Housing units in structures - Owners - 3 or 4 (%)
Housing units in structures - Owners - 5 to 9 (%)
Housing units in structures - Owners - 10 to 19 (%)
Housing units in structures - Owners - 20 to 49 (%)
Housing units in structures - Owners - 50 or more (%)
Housing units in structures - Owners - Mobile home (%)
Housing units in structures - Owners - Boat, RV, van, etc. (%)
Housing units in structures - Renters - 1, detached (%)
Housing units in structures - Renters - 1, attached (%)
Housing units in structures - Renters - 2 (%)
Housing units in structures - Renters - 3 or 4 (%)
Housing units in structures - Renters - 5 to 9 (%)
Housing units in structures - Renters - 10 to 19 (%)
Housing units in structures - Renters - 20 to 49 (%)
Housing units in structures - Renters - 50 or more (%)
Housing units in structures - Renters - Mobile home (%)
Housing units in structures - Renters - Boat, RV, van, etc. (%)
House/condo owner moved in on average (years ago)
Renter moved in on average (years ago)
Year householder moved into unit - Moved in 1999 to March 2000 (%)
Year householder moved into unit - Moved in 1999 to March 2000 (%) - White
Year householder moved into unit - Moved in 1999 to March 2000 (%) - Black or African American
Year householder moved into unit - Moved in 1999 to March 2000 (%) - Asian
Year householder moved into unit - Moved in 1999 to March 2000 (%) - Hispanic or Latino
Year householder moved into unit - Moved in 1999 to March 2000 (%) - American Indian and Alaska Native
Year householder moved into unit - Moved in 1999 to March 2000 (%) - Multirace
Year householder moved into unit - Moved in 1999 to March 2000 (%) - Other Race
Year householder moved into unit - Moved in 1995 to 1998 (%)
Year householder moved into unit - Moved in 1995 to 1998 (%) - White
Year householder moved into unit - Moved in 1995 to 1998 (%) - Black or African American
Year householder moved into unit - Moved in 1995 to 1998 (%) - Asian
Year householder moved into unit - Moved in 1995 to 1998 (%) - Hispanic or Latino
Year householder moved into unit - Moved in 1995 to 1998 (%) - American Indian and Alaska Native
Year householder moved into unit - Moved in 1995 to 1998 (%) - Multirace
Year householder moved into unit - Moved in 1995 to 1998 (%) - Other Race
Year householder moved into unit - Moved in 1990 to 1994 (%)
Year householder moved into unit - Moved in 1990 to 1994 (%) - White
Year householder moved into unit - Moved in 1990 to 1994 (%) - Black or African American
Year householder moved into unit - Moved in 1990 to 1994 (%) - Asian
Year householder moved into unit - Moved in 1990 to 1994 (%) - Hispanic or Latino
Year householder moved into unit - Moved in 1990 to 1994 (%) - American Indian and Alaska Native
Year householder moved into unit - Moved in 1990 to 1994 (%) - Multirace
Year householder moved into unit - Moved in 1990 to 1994 (%) - Other Race
Year householder moved into unit - Moved in 1980 to 1989 (%)
Year householder moved into unit - Moved in 1980 to 1989 (%) - White
Year householder moved into unit - Moved in 1980 to 1989 (%) - Black or African American
Year householder moved into unit - Moved in 1980 to 1989 (%) - Asian
Year householder moved into unit - Moved in 1980 to 1989 (%) - Hispanic or Latino
Year householder moved into unit - Moved in 1980 to 1989 (%) - American Indian and Alaska Native
Year householder moved into unit - Moved in 1980 to 1989 (%) - Multirace
Year householder moved into unit - Moved in 1980 to 1989 (%) - Other Race
Year householder moved into unit - Moved in 1970 to 1979 (%)
Year householder moved into unit - Moved in 1970 to 1979 (%) - White
Year householder moved into unit - Moved in 1970 to 1979 (%) - Black or African American
Year householder moved into unit - Moved in 1970 to 1979 (%) - Asian
Year householder moved into unit - Moved in 1970 to 1979 (%) - Hispanic or Latino
Year householder moved into unit - Moved in 1970 to 1979 (%) - American Indian and Alaska Native
Year householder moved into unit - Moved in 1970 to 1979 (%) - Multirace
Year householder moved into unit - Moved in 1970 to 1979 (%) - Other Race
Year householder moved into unit - Moved in 1969 or earlier (%)
Year householder moved into unit - Moved in 1969 or earlier (%) - White
Year householder moved into unit - Moved in 1969 or earlier (%) - Black or African American
Year householder moved into unit - Moved in 1969 or earlier (%) - Asian
Year householder moved into unit - Moved in 1969 or earlier (%) - Hispanic or Latino
Year householder moved into unit - Moved in 1969 or earlier (%) - American Indian and Alaska Native
Year householder moved into unit - Moved in 1969 or earlier (%) - Multirace
Year householder moved into unit - Moved in 1969 or earlier (%) - Other Race
Housing units lacking complete plumbing facilities (%)
Housing units lacking complete kitchen facilities (%)
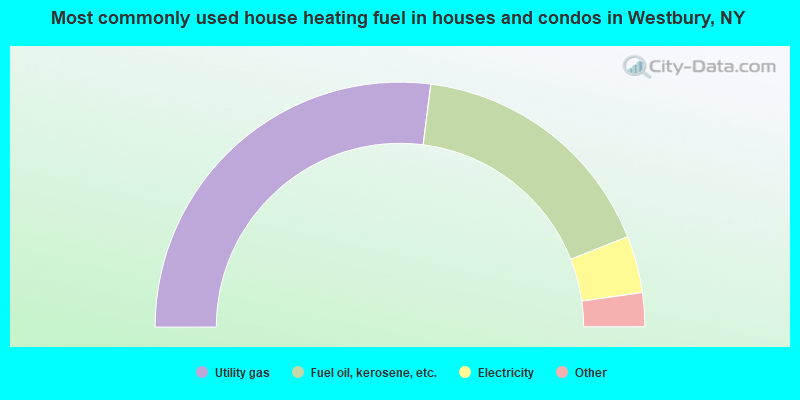
House heating fuel used in houses and condos - Utility gas (%)
House heating fuel used in houses and condos - Bottled, tank, or LP gas (%)
House heating fuel used in houses and condos - Electricity (%)
House heating fuel used in houses and condos - Fuel oil, kerosene, etc. (%)
House heating fuel used in houses and condos - Coal or coke (%)
House heating fuel used in houses and condos - Wood (%)
House heating fuel used in houses and condos - Solar energy (%)
House heating fuel used in houses and condos - Other fuel (%)
House heating fuel used in houses and condos - No fuel used (%)
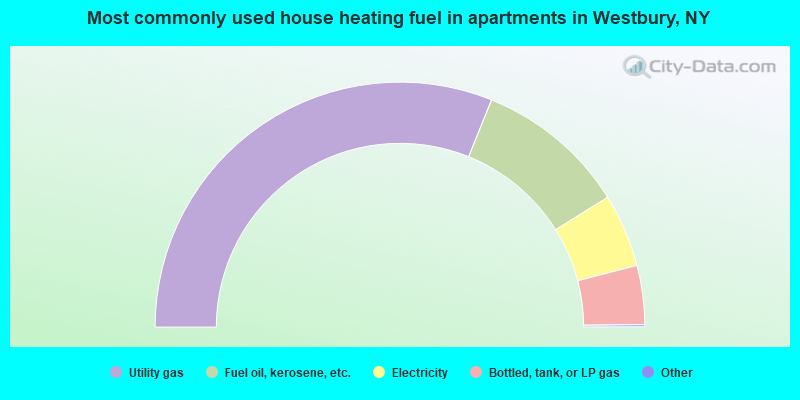
House heating fuel used in apartments - Utility gas (%)
House heating fuel used in apartments - Bottled, tank, or LP gas (%)
House heating fuel used in apartments - Electricity (%)
House heating fuel used in apartments - Fuel oil, kerosene, etc. (%)
House heating fuel used in apartments - Coal or coke (%)
House heating fuel used in apartments - Wood (%)
House heating fuel used in apartments - Solar energy (%)
House heating fuel used in apartments - Other fuel (%)
House heating fuel used in apartments - No fuel used (%)
Latest news about housing in Westbury, NY collected exclusively by city-data.com from local newspapers, TV, and radio stations
Median year house/condo built: 1955Median year apartment built: 1960Household type by relationship:
Households: 15,726
Male householders: 2,416 (342 living alone ), Female householders: 2,749 (663 living alone )2,879 spouses (2,860 opposite-sex spouses ), 382 unmarried partners , (368 opposite-sex unmarried partners ), 4,354 children (4,184 natural , 63 adopted , 106 stepchildren ), 423 grandchildren , 374 brothers or sisters , 645 parents , 0 foster children , 816 other relatives , 548 non-relatives In group quarters: 134
Size of family households: 1,286 2-persons , 880 3-persons , 777 4-persons , 588 5-persons , 89 6-persons , 256 7-or-more-persons .
Size of nonfamily households: 1,048 1-person , 231 2-persons , 20 3-persons , 15 4-persons , 17 5-persons .
1,838 married couples with children. single-parent households (384 men , 287 women ).
56.0% of residents of Westbury speak English at home. of residents speak Spanish at home (55% speak English very well , 15% speak English well , 23% speak English not well , 7% don't speak English at all ).of residents speak other Indo-European language at home (66% speak English very well , 24% speak English well , 9% speak English not well , 1% don't speak English at all ).of residents speak Asian or Pacific Island language at home (47% speak English very well , 30% speak English well , 19% speak English not well , 5% don't speak English at all ).of residents speak other language at home (100% speak English very well ).
Foreign born population: 5,345 (34.0%)of them are naturalized citizens )
Median number of rooms in houses and condos:
Median number of rooms in apartments
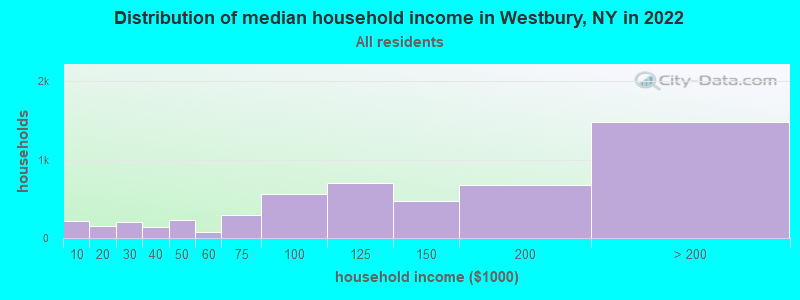
Westbury, NY household income distribution 218 Less than $10,000153 $10,000 to $19,999202 $20,000 to $29,999137 $30,000 to $39,999235 $40,000 to $49,99980 $50,000 to $59,999295 $60,000 to $74,999565 $75,000 to $99,999699 $100,000 to $124,999472 $125,000 to $149,999673 $150,000 to $199,9991,481 $200,000 or more
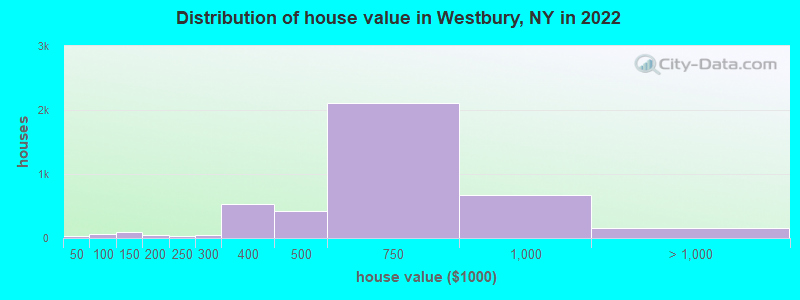
Home value of owner - occupied houses in 2022 in Westbury, NY 26 Less than $10,0007 $40,000 to $49,99959 $50,000 to $59,99925 $100,000 to $124,99964 $125,000 to $149,99940 $150,000 to $174,99938 $200,000 to $249,99949 $250,000 to $299,999529 $300,000 to $399,999416 $400,000 to $499,9992,117 $500,000 to $749,999667 $750,000 to $999,999149 $1,000,000 to $1,499,999Rent paid by renters in 2022 in Westbury, NY 10 $700 to $74925 $800 to $89942 $1,000 to $1,24987 $1,250 to $1,499309 $1,500 to $1,999173 $2,000 to $2,499116 $2,500 to $2,99919 $3,000 to $3,499106 $3,500 or more39 No cash rent
Percentage of workers working in this county: 64.7%Number of people working at home: 833 (9.9% of all workers )
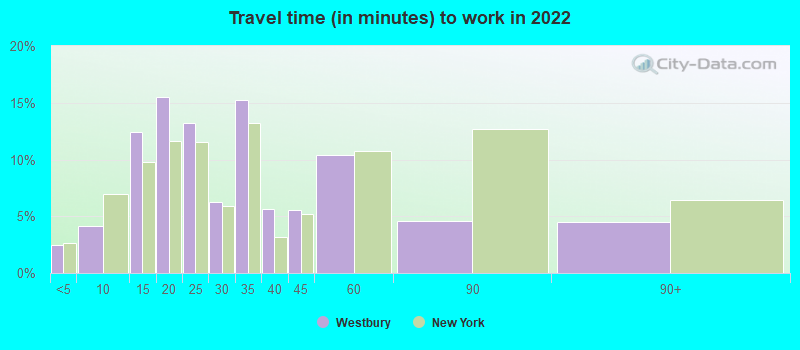
Travel time to work (commute)
Less than 5 minutes: 685 to 9 minutes: 39210 to 14 minutes: 1,24915 to 19 minutes: 1,19620 to 24 minutes: 91625 to 29 minutes: 37530 to 34 minutes: 84535 to 39 minutes: 6340 to 44 minutes: 18745 to 59 minutes: 1,01460 to 89 minutes: 58190 or more minutes: 604
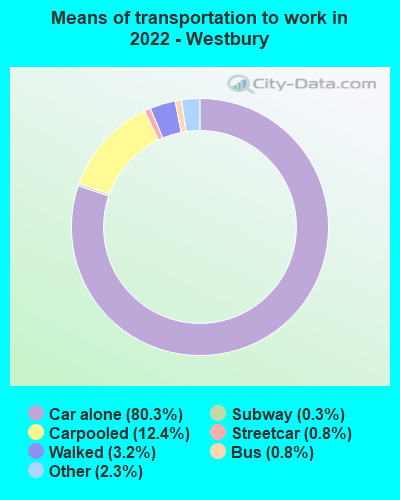
Means of transportation to work:
Drove a car alone: 5,384 (70.4%)Carpooled: 805 (10.5%)Bus : 51 (0.7%)Subway or elevated rail : 45 (0.6%)Long-distance train or commuter rail : 18 (0.2%)Taxi: 222 (2.9%)Walked: 229 (3.0%)Worked at home: 833 (10.9%)
Unemployment by race in 2022
Unemployment rate for White non-Hispanic residents 5.2% Males2.9% FemalesUnemployment rate for Black residents 2.0% Males2.6% FemalesUnemployment rate for Asian residents 4.2% FemalesUnemployment rate for other race residents 1.1% Males1.1% FemalesUnemployment rate for two or more race residents 4.3% FemalesUnemployment rate for Hispanic or Latino residents 0.8% Females
Year of entry for the foreign-born population in Westbury, New York
1,091 2010 or later 1,084 2000 to 2009 1,073 1990 to 1999 1,256 1980 to 1989 943 1970 to 1979 777 Before 1970
First ancestries reported:
Italian: 1,310 (16.1%)
American: 322 (4.0%)
Jamaican: 297 (3.6%)
Irish: 282 (3.5%)
Haitian: 271 (3.3%)
German: 250 (3.1%)
Portuguese: 201 (2.5%)
Albanian: 174 (2.1%)
West Indian: 97 (1.2%)
Polish: 76 (0.9%)
English: 75 (0.9%)
Russian: 65 (0.8%)
Guyanese: 57 (0.7%)
African: 54 (0.7%)
Israeli: 50 (0.6%)
Trinidadian and Tobagonian: 43 (0.5%)
Cypriot: 34 (0.4%)
Greek: 22 (0.3%)
Scotch-Irish: 22 (0.3%)
U.S. Virgin Islander: 20 (0.2%)
Ukrainian: 18 (0.2%)
Eastern European: 15 (0.2%)
French Canadian: 14 (0.2%)
Brazilian: 13 (0.2%)
Kenyan: 12 (0.1%)
Hungarian: 11 (0.1%)
Romanian: 11 (0.1%)
Czech: 8 (0.10%)
Barbadian: 8 (0.10%)
European: 7 (0.09%)
Czechoslovakian: 5 (0.06%)
French: 2 (0.02%) Most common places of birth for foreign-born residents (%): El Salvador Westbury:
25.5% (1,320)New York:
2.4% (108,067)
Colombia Westbury:
10.8% (558)New York:
2.5% (111,920)
Jamaica Westbury:
5.9% (303)New York:
5.0% (227,557)
Mexico Westbury:
5.8% (299)New York:
4.8% (214,559)
Haiti Westbury:
5.6% (292)New York:
2.8% (126,936)
Italy Westbury:
4.3% (222)New York:
1.8% (81,374)
Peru Westbury:
3.5% (181)New York:
1.2% (54,759)
Korea Westbury:
3.0% (153)New York:
1.8% (82,786)
China, excluding Hong Kong and Taiwan Westbury:
2.9% (150)New York:
9.1% (410,910)
Philippines Westbury:
2.8% (147)New York:
2.0% (91,070)
Ecuador Westbury:
2.8% (144)New York:
3.9% (177,448)
India Westbury:
2.3% (119)New York:
3.5% (158,432)
Guyana Westbury:
2.2% (114)New York:
3.8% (172,129)
Albania Westbury:
2.0% (102)New York:
0.6% (25,362)
Portugal Westbury:
1.9% (96)New York:
0.2% (10,519)
Pakistan Westbury:
1.6% (83)New York:
1.4% (62,442)
Place of birth for U.S.-born residents:
This state: 9,332Other state: 723Northeast: 174Midwest: 147South: 292West: 117 91.7% of Westbury residents lived in the same house 1 years ago.
Out of people who lived in different houses, 32.1% lived in this county.
Out of people who lived in different counties, 87.7% lived in New York.
Westbury:
91.7%State average:
89.6%
Education attainment for males 25 years and older:
No schooling: 212Nursery to 4th grade: 305th and 6th grade: 377th and 8th grade: 1049th grade: 410th grade: 2411th grade: 3912th grade, no diploma: 282High school graduate (or equivalency): 1,045Less than 1 year of college: 293Some college more than 1 year, no degree: 625Associate degree: 392Bachelor's degree: 1,761Master's degree: 668Professional school degree: 131Doctorate degree: 83
Education attainment for females 25 years and older:
No schooling: 373Nursery to 4th grade: 1885th and 6th grade: 107th and 8th grade: 669th grade: 010th grade: 7511th grade: 1512th grade, no diploma: 92High school graduate (or equivalency): 1,086Less than 1 year of college: 196Some college more than 1 year, no degree: 473Associate degree: 410Bachelor's degree: 1,723Master's degree: 1,051Professional school degree: 121Doctorate degree: 65
Housing units in structures:
One, detached: 3,949One, attached: 60Two: 5383 or 4: 1425 to 9: 4110 to 19: 15620 to 49: 2350 or more: 497Housing units lacking complete plumbing facilities in 2022: 1.8%Housing units lacking complete kitchen facilities in 2022: 2.9%House/condo owner moved in on average 16 years ago
Renter moved in on average 6 years ago
Private vs. public school enrollment:
Students in private schools in grades 1 to 8 (elementary and middle school): 391 Students in private schools in grades 9 to 12 (high school): 174 Students in private undergraduate colleges: 188