Washoe Valley, NV (Nevada) Houses and Residents
Estimated median house or condo value in 2022: $696,438 (it was $196,300 in 2000 )
Washoe Valley:
$696,438Nevada:
$434,700
Lower value quartile - upper value quartile: $492,992 - $943,993Total population: 13,620 (Urban population: 3,511, Rural population: 8,002 (73 farm, 7,929 nonfarm ))
Houses: 4,521 (4,376 occupied: 3,950 owner occupied, 426 renter occupied )
% of renters here:
10%State:
40%
Housing density: 37 houses/condos per square mile
Median price asked for vacant for-sale houses and condos in 2022 in this county: $350,177.
Median contract rent in 2022: $1,556 (lower quartile is $1,209, upper quartile is over $2,000)
Median rent asked for vacant for-rent units in 2022: $2,453
Median gross rent in Washoe Valley, NV in 2022: $1,833
Housing units in Washoe Valley with a mortgage: 2,553 (432 second mortgage, 465 home equity loan, 29 both second mortgage and home equity loan )Houses without a mortgage: 429
Data:
Median house or condo value ($)
Median house or condo value ($ change since 2000)
Median house or condo value ($) - White
Median house or condo value ($) - Black or African American
Median house or condo value ($) - Asian
Median house or condo value ($) - Hispanic or Latino
Median house or condo value ($) - American Indian and Alaska Native
Median house or condo value ($) - Multirace
Median house or condo value ($) - Other Race
Median price asked for mobile homes ($)
Household density (households per square mile)
Mean house or condo value by units in structure - 1, detached ($)
Mean house or condo value by units in structure - 1, attached ($)
Mean house or condo value by units in structure - 2 ($)
Mean house or condo value by units in structure by units in structure - 3 or 4 ($)
Mean house or condo value by units in structure - 5 or more ($)
Mean house or condo value by units in structure - Boat, RV, van, etc. ($)
Mean house or condo value by units in structure - Mobile home ($)
Median contract rent ($)
Median contract rent - Lower quartile ($)
Median contract rent - Upper quartile ($)
Median gross rent ($)
Urban houses (%)
Rural houses (%)
Houses occupied (%)
Houses occupied (% change since 2000)
Houses owner occupied (%)
Houses owner occupied (% change since 2000)
Houses renter occupied (%)
Houses renter occupied (% change since 2000)
Vacant housing units - For rent (%)
Vacant housing units - For rent (% change since 2000)
Vacant housing units - For sale only (%)
Vacant housing units - For sale only (% change since 2000)
Vacant housing units - Rented or sold, not occupied (%)
Vacant housing units - Rented or sold, not occupied (% change since 2000)
Vacant housing units - For seasonal, recreational, or occasional use (%)
Vacant housing units - For seasonal, recreational, or occasional use (% change since 2000)
Vacant housing units - For migrant workers (%)
Vacant housing units - For migrant workers (% change since 2000)
Vacant housing units - Other vacant (%)
Vacant housing units - Other vacant (% change since 2000)
Median monthly housing costs ($)
Median household income for houses/condos with a mortgage ($)
Median household income for houses/condos without a mortgage ($)
Median household income ($)
Median household income ($) - White
Median household income ($) - Black or African American
Median household income ($) - Asian
Median household income ($) - Hispanic or Latino
Median household income ($) - American Indian and Alaska Native
Median household income ($) - Multirace
Median household income ($) - Other Race
Mortgage status - with mortgage (%)
Mortgage status - with second mortgage (%)
Mortgage status - with home equity loan (%)
Mortgage status - with both second mortgage and home equity loan (%)
Mortgage status - without a mortgage (%)
Median year house/condo built
Median year apartment built
Household type by relationship - Male householder living alone (%)
Household type by relationship - Male householder not living alone (%)
Household type by relationship - Female householder living alone (%)
Household type by relationship - Female householder not living alone (%)
Household type by relationship - Opposite-Sex spouse (%)
Household type by relationship - Same-Sex spouse (%)
Household type by relationship - Opposite-Sex unmarried partner (%)
Household type by relationship - Same-Sex unmarried partner (%)
Household type by relationship - In group quarters (%)
Size of family households - 2-person household (%)
Size of family households - 3-person household (%)
Size of family households - 4-person household (%)
Size of family households - 5-person household (%)
Size of family households - 6-person household (%)
Size of family households - 7-or-more-person household (%)
Size of nonfamily households - 1-person household (%)
Size of nonfamily households - 2-person household (%)
Size of nonfamily households - 3-person household (%)
Size of nonfamily households - 4-person household (%)
Size of nonfamily households - 5-person household (%)
Size of nonfamily households - 6-person household (%)
Size of nonfamily households - 7-or-moreperson household (%)
Year house built - Built 2010 or later (%)
Year house built - Built 2000 to 2009 (%)
Year house built - Built 1990 to 1999 (%)
Year house built - Built 1980 to 1989 (%)
Year house built - Built 1970 to 1979 (%)
Year house built - Built 1960 to 1969 (%)
Year house built - Built 1950 to 1959 (%)
Year house built - Built 1940 to 1949 (%)
Year house built - Built 1939 or earlier (%)
Median number of rooms in houses and condos
Median number of rooms in apartments
Median number of bedrooms in owner occupied houses
Mean number of bedrooms in owner occupied houses
Median number of bedrooms in renter occupied houses
Mean number of bedrooms in renter occupied houses
Median number of vehichles in owner occupied houses
Mean number of vehichles in owner occupied houses
Median number of vehichles in renter occupied houses
Mean number of vehichles in renter occupied houses
Rooms in owner-occupied houses - 1 room (%)
Rooms in owner-occupied houses - 2 rooms (%)
Rooms in owner-occupied houses - 3 rooms (%)
Rooms in owner-occupied houses - 4 rooms (%)
Rooms in owner-occupied houses - 5 rooms (%)
Rooms in owner-occupied houses - 6 rooms (%)
Rooms in owner-occupied houses - 7 rooms (%)
Rooms in owner-occupied houses - 8 rooms (%)
Rooms in owner-occupied houses - 9+ rooms (%)
Rooms in renter-occupied houses - 1 room (%)
Rooms in renter-occupied houses - 2 rooms (%)
Rooms in renter-occupied houses - 3 rooms (%)
Rooms in renter-occupied houses - 4 rooms (%)
Rooms in renter-occupied houses - 5 rooms (%)
Rooms in renter-occupied houses - 6 rooms (%)
Rooms in renter-occupied houses - 7 rooms (%)
Rooms in renter-occupied houses - 8 rooms (%)
Rooms in renter-occupied houses - 9+ rooms (%)
Bedrooms in owner-occupied houses - no bedrooms (%)
Bedrooms in owner-occupied houses - 1 bedroom (%)
Bedrooms in owner-occupied houses - 2 bedrooms (%)
Bedrooms in owner-occupied houses - 3 bedrooms (%)
Bedrooms in owner-occupied houses - 4 bedrooms (%)
Bedrooms in owner-occupied houses - 5+ bedrooms (%)
Bedrooms in renter-occupied houses - no bedrooms (%)
Bedrooms in renter-occupied houses - 1 bedroom (%)
Bedrooms in renter-occupied houses - 2 bedrooms (%)
Bedrooms in renter-occupied houses - 3 bedrooms (%)
Bedrooms in renter-occupied houses - 4 bedrooms (%)
Bedrooms in renter-occupied houses - 5+ bedrooms (%)
Vehicles available in owner-occupied houses - no vehicle available (%)
Vehicles available in owner-occupied houses - 1 vehicle available(%)
Vehicles available in owner-occupied houses - 2 Vehicles available (%)
Vehicles available in owner-occupied houses - 3 Vehicles available (%)
Vehicles available in owner-occupied houses - 4 Vehicles available (%)
Vehicles available in owner-occupied houses - 5+ Vehicles available (%)
Vehicles available in renter-occupied houses - no vehicle available (%)
Vehicles available in renter-occupied houses - 1 vehicle available (%)
Vehicles available in renter-occupied houses - 2 Vehicles available (%)
Vehicles available in renter-occupied houses - 3 Vehicles available (%)
Vehicles available in renter-occupied houses - 4 Vehicles available (%)
Vehicles available in renter-occupied houses - 5+ Vehicles available (%)
Housing units in structures - 1, detached (%)
Housing units in structures - 1, attached (%)
Housing units in structures - 2 (%)
Housing units in structures - 3 or 4 (%)
Housing units in structures - 5 to 9 (%)
Housing units in structures - 10 to 19 (%)
Housing units in structures - 20 to 49 (%)
Housing units in structures - 50 or more (%)
Housing units in structures - Mobile home (%)
Housing units in structures - Boat, RV, van, etc. (%)
Housing units in structures - Owners - 1, detached (%)
Housing units in structures - Owners - 1, attached (%)
Housing units in structures - Owners - 2 (%)
Housing units in structures - Owners - 3 or 4 (%)
Housing units in structures - Owners - 5 to 9 (%)
Housing units in structures - Owners - 10 to 19 (%)
Housing units in structures - Owners - 20 to 49 (%)
Housing units in structures - Owners - 50 or more (%)
Housing units in structures - Owners - Mobile home (%)
Housing units in structures - Owners - Boat, RV, van, etc. (%)
Housing units in structures - Renters - 1, detached (%)
Housing units in structures - Renters - 1, attached (%)
Housing units in structures - Renters - 2 (%)
Housing units in structures - Renters - 3 or 4 (%)
Housing units in structures - Renters - 5 to 9 (%)
Housing units in structures - Renters - 10 to 19 (%)
Housing units in structures - Renters - 20 to 49 (%)
Housing units in structures - Renters - 50 or more (%)
Housing units in structures - Renters - Mobile home (%)
Housing units in structures - Renters - Boat, RV, van, etc. (%)
House/condo owner moved in on average (years ago)
Renter moved in on average (years ago)
Year householder moved into unit - Moved in 1999 to March 2000 (%)
Year householder moved into unit - Moved in 1999 to March 2000 (%) - White
Year householder moved into unit - Moved in 1999 to March 2000 (%) - Black or African American
Year householder moved into unit - Moved in 1999 to March 2000 (%) - Asian
Year householder moved into unit - Moved in 1999 to March 2000 (%) - Hispanic or Latino
Year householder moved into unit - Moved in 1999 to March 2000 (%) - American Indian and Alaska Native
Year householder moved into unit - Moved in 1999 to March 2000 (%) - Multirace
Year householder moved into unit - Moved in 1999 to March 2000 (%) - Other Race
Year householder moved into unit - Moved in 1995 to 1998 (%)
Year householder moved into unit - Moved in 1995 to 1998 (%) - White
Year householder moved into unit - Moved in 1995 to 1998 (%) - Black or African American
Year householder moved into unit - Moved in 1995 to 1998 (%) - Asian
Year householder moved into unit - Moved in 1995 to 1998 (%) - Hispanic or Latino
Year householder moved into unit - Moved in 1995 to 1998 (%) - American Indian and Alaska Native
Year householder moved into unit - Moved in 1995 to 1998 (%) - Multirace
Year householder moved into unit - Moved in 1995 to 1998 (%) - Other Race
Year householder moved into unit - Moved in 1990 to 1994 (%)
Year householder moved into unit - Moved in 1990 to 1994 (%) - White
Year householder moved into unit - Moved in 1990 to 1994 (%) - Black or African American
Year householder moved into unit - Moved in 1990 to 1994 (%) - Asian
Year householder moved into unit - Moved in 1990 to 1994 (%) - Hispanic or Latino
Year householder moved into unit - Moved in 1990 to 1994 (%) - American Indian and Alaska Native
Year householder moved into unit - Moved in 1990 to 1994 (%) - Multirace
Year householder moved into unit - Moved in 1990 to 1994 (%) - Other Race
Year householder moved into unit - Moved in 1980 to 1989 (%)
Year householder moved into unit - Moved in 1980 to 1989 (%) - White
Year householder moved into unit - Moved in 1980 to 1989 (%) - Black or African American
Year householder moved into unit - Moved in 1980 to 1989 (%) - Asian
Year householder moved into unit - Moved in 1980 to 1989 (%) - Hispanic or Latino
Year householder moved into unit - Moved in 1980 to 1989 (%) - American Indian and Alaska Native
Year householder moved into unit - Moved in 1980 to 1989 (%) - Multirace
Year householder moved into unit - Moved in 1980 to 1989 (%) - Other Race
Year householder moved into unit - Moved in 1970 to 1979 (%)
Year householder moved into unit - Moved in 1970 to 1979 (%) - White
Year householder moved into unit - Moved in 1970 to 1979 (%) - Black or African American
Year householder moved into unit - Moved in 1970 to 1979 (%) - Asian
Year householder moved into unit - Moved in 1970 to 1979 (%) - Hispanic or Latino
Year householder moved into unit - Moved in 1970 to 1979 (%) - American Indian and Alaska Native
Year householder moved into unit - Moved in 1970 to 1979 (%) - Multirace
Year householder moved into unit - Moved in 1970 to 1979 (%) - Other Race
Year householder moved into unit - Moved in 1969 or earlier (%)
Year householder moved into unit - Moved in 1969 or earlier (%) - White
Year householder moved into unit - Moved in 1969 or earlier (%) - Black or African American
Year householder moved into unit - Moved in 1969 or earlier (%) - Asian
Year householder moved into unit - Moved in 1969 or earlier (%) - Hispanic or Latino
Year householder moved into unit - Moved in 1969 or earlier (%) - American Indian and Alaska Native
Year householder moved into unit - Moved in 1969 or earlier (%) - Multirace
Year householder moved into unit - Moved in 1969 or earlier (%) - Other Race
Housing units lacking complete plumbing facilities (%)
Housing units lacking complete kitchen facilities (%)
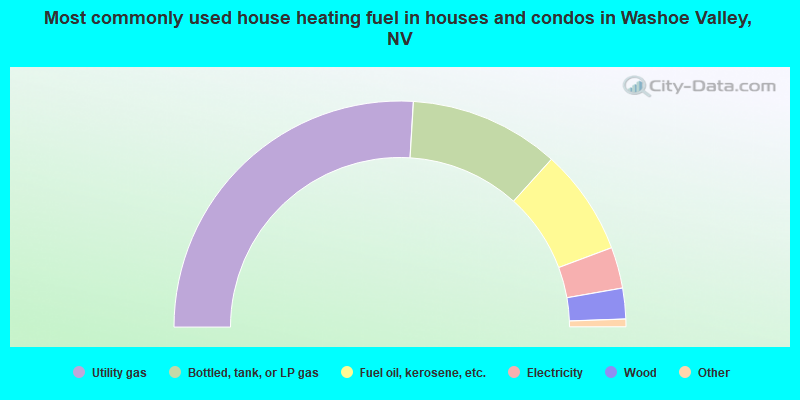
House heating fuel used in houses and condos - Utility gas (%)
House heating fuel used in houses and condos - Bottled, tank, or LP gas (%)
House heating fuel used in houses and condos - Electricity (%)
House heating fuel used in houses and condos - Fuel oil, kerosene, etc. (%)
House heating fuel used in houses and condos - Coal or coke (%)
House heating fuel used in houses and condos - Wood (%)
House heating fuel used in houses and condos - Solar energy (%)
House heating fuel used in houses and condos - Other fuel (%)
House heating fuel used in houses and condos - No fuel used (%)
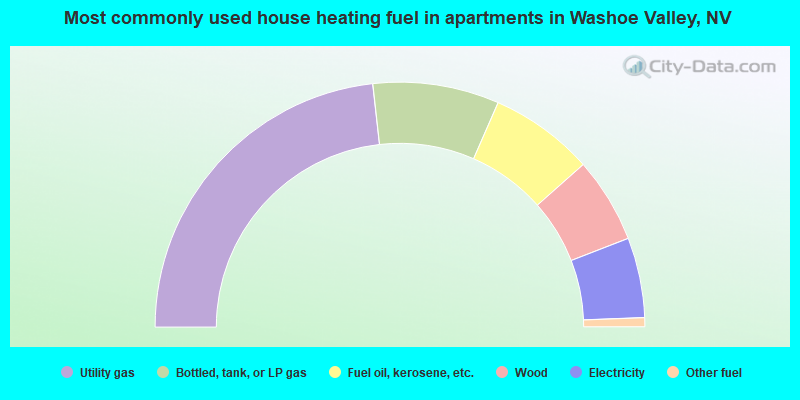
House heating fuel used in apartments - Utility gas (%)
House heating fuel used in apartments - Bottled, tank, or LP gas (%)
House heating fuel used in apartments - Electricity (%)
House heating fuel used in apartments - Fuel oil, kerosene, etc. (%)
House heating fuel used in apartments - Coal or coke (%)
House heating fuel used in apartments - Wood (%)
House heating fuel used in apartments - Solar energy (%)
House heating fuel used in apartments - Other fuel (%)
House heating fuel used in apartments - No fuel used (%)
Household type by relationship:
Households: 416,135
In family households: 333,280 (72,131 male householders , 30,637 female householders )
74,494 spouses , 114,518 children (105,670 natural , 2,626 adopted , 6,222 stepchildren ), 8,423 grandchildren , 5,233 brothers or sisters , 4,625 parents , foster children , 6,388 other relatives , 13,408 non-relatives In nonfamily households: 82,855 (32,101 male householders (22,736 living alone )), 28,576 female householders (21,733 living alone )), 22,178 nonrelatives In group quarters: 5,272 (2,106 institutionalized population)
55,429 married couples with children. single-parent households (5,984 men , 14,140 women ).
93.4% of residents of Washoe Valley speak English at home. of residents speak Spanish at home (81% speak English very well , 9% speak English well , 10% speak English not well ).of residents speak other Indo-European language at home (87% speak English very well , 11% speak English well , 1% don't speak English at all ).of residents speak Asian or Pacific Island language at home (43% speak English very well , 18% speak English well , 31% speak English not well , 8% don't speak English at all ).of residents speak other language at home (100% speak English very well ).
Foreign born population: 591 (3.5%)of them are naturalized citizens )
Median number of rooms in houses and condos:
Median number of rooms in apartments
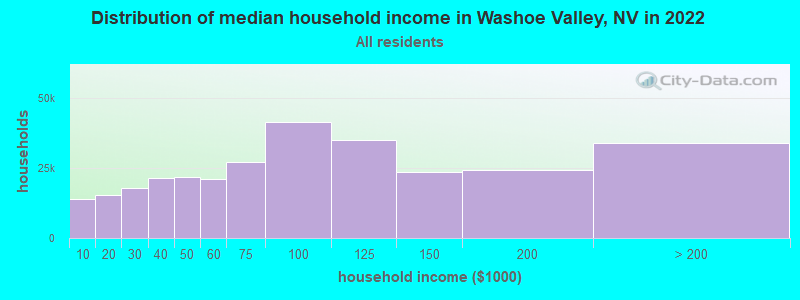
Washoe Valley, NV household income distribution 13,880 Less than $10,00015,408 $10,000 to $19,99917,732 $20,000 to $29,99921,510 $30,000 to $39,99921,846 $40,000 to $49,99921,187 $50,000 to $59,99927,315 $60,000 to $74,99941,517 $75,000 to $99,99935,232 $100,000 to $124,99923,545 $125,000 to $149,99924,283 $150,000 to $199,99934,000 $200,000 or more
Percentage of workers working in this county: 81.8%Number of people working at home: 980 (10.8% of all workers )
Travel time to work (commute)
Less than 5 minutes: 985 to 9 minutes: 24410 to 14 minutes: 33015 to 19 minutes: 88320 to 24 minutes: 1,55725 to 29 minutes: 85130 to 34 minutes: 1,18835 to 39 minutes: 19140 to 44 minutes: 12145 to 59 minutes: 20260 to 89 minutes: 5690 or more minutes: 69
Means of transportation to work:
Drove a car alone: 5,004 (81.8%)Carpooled: 670 (11.0%)Bus or trolley bus : 7 (0.1%)Motorcycle: 15 (0.2%)Bicycle: 12 (0.2%)Walked: 49 (0.8%)Other means: 33 (0.5%)Worked at home: 328 (5.4%)
Year of entry for the foreign-born population in Washoe Valley, Nevada
33 1995 to March 2000 15 1990 to 1994 53 1985 to 1989 65 1980 to 1984 46 1975 to 1979 9 1970 to 1974 54 1965 to 1969 137 Before 1965
Most common places of birth for foreign-born residents (%): Germany Washoe Valley:
18.0% (74)Nevada:
2.1% (6,621)
United Kingdom Washoe Valley:
9.2% (38)Nevada:
2.2% (6,872)
Australia Washoe Valley:
8.5% (35)Nevada:
0.2% (683)
Canada Washoe Valley:
8.0% (33)Nevada:
3.4% (10,690)
Mexico Washoe Valley:
6.3% (26)Nevada:
48.6% (153,946)
Philippines Washoe Valley:
6.1% (25)Nevada:
9.9% (31,491)
Vietnam Washoe Valley:
4.9% (20)Nevada:
1.5% (4,902)
Poland Washoe Valley:
4.6% (19)Nevada:
0.4% (1,347)
Other Western Europe Washoe Valley:
4.1% (17)Nevada:
0.3% (810)
Pakistan Washoe Valley:
4.1% (17)Nevada:
0.3% (1,090)
Guatemala Washoe Valley:
2.9% (12)Nevada:
1.7% (5,463)
Chile Washoe Valley:
2.9% (12)Nevada:
0.3% (957)
Egypt Washoe Valley:
2.7% (11)Nevada:
0.2% (559)
Spain Washoe Valley:
2.4% (10)Nevada:
0.3% (1,037)
Colombia Washoe Valley:
2.4% (10)Nevada:
0.5% (1,581)
Korea Washoe Valley:
2.2% (9)Nevada:
1.9% (6,071)
Peru Washoe Valley:
2.2% (9)Nevada:
0.4% (1,264)
Europe, n.e.c. Washoe Valley:
1.9% (8)Nevada:
0.0% (34)
Czechoslovakia (includes Czech Republic and Slovakia) Washoe Valley:
1.7% (7)Nevada:
0.2% (586)
Japan Washoe Valley:
1.7% (7)Nevada:
1.2% (3,935)
Other South Eastern Asia Washoe Valley:
1.7% (7)Nevada:
0.1% (208)
Place of birth for U.S.-born residents:
This state: 3,047Other state: 7,968Northeast: 784Midwest: 1,438South: 716West: 5,030 55% of Washoe Valley residents lived in the same house 5 years ago.
Out of people who lived in different houses, 58% lived in this county.
Out of people who lived in different counties, 19% lived in Nevada.
Education attainment for males 25 years and older:
No schooling: 9Nursery to 4th grade: 05th and 6th grade: 07th and 8th grade: 559th grade: 3210th grade: 7311th grade: 6512th grade, no diploma: 127High school graduate (or equivalency): 797Less than 1 year of college: 377Some college more than 1 year, no degree: 975Associate degree: 255Bachelor's degree: 668Master's degree: 335Professional school degree: 120Doctorate degree: 97
Education attainment for females 25 years and older:
No schooling: 5Nursery to 4th grade: 05th and 6th grade: 77th and 8th grade: 449th grade: 3710th grade: 3211th grade: 9312th grade, no diploma: 91High school graduate (or equivalency): 959Less than 1 year of college: 376Some college more than 1 year, no degree: 927Associate degree: 389Bachelor's degree: 831Master's degree: 305Professional school degree: 68Doctorate degree: 30
Housing units in structures:
One, detached: 3,643One, attached: 24Two: 103 or 4: 345 to 9: 2310 to 19: 12Mobile homes: 766Boats, RVs, vans, etc.: 9Median worth of mobile homes: $202,877
Housing units lacking complete kitchen facilities: 0.2%Private vs. public school enrollment:
Students in private schools in grades 1 to 8 (elementary and middle school): 57 Students in private schools in grades 9 to 12 (high school): 17 Students in private undergraduate colleges: 57