Housing density: 195 houses/condos per square mile
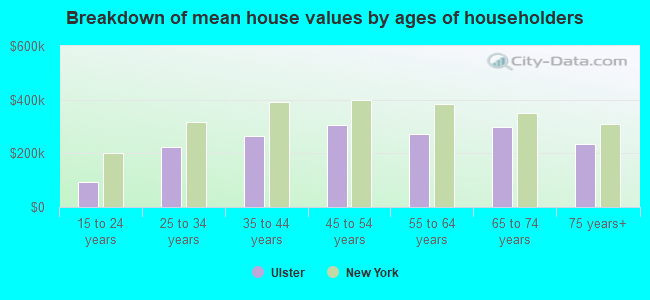
Median price asked for vacant for-sale houses and condos in 2022 in this county: $213,181.
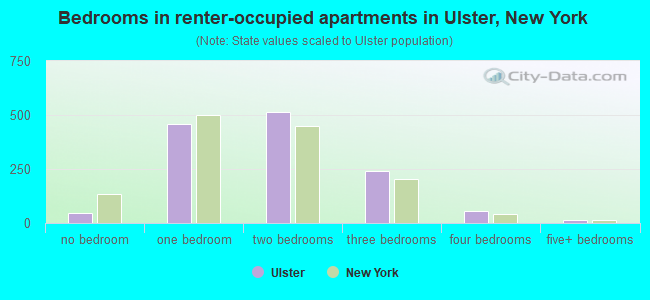
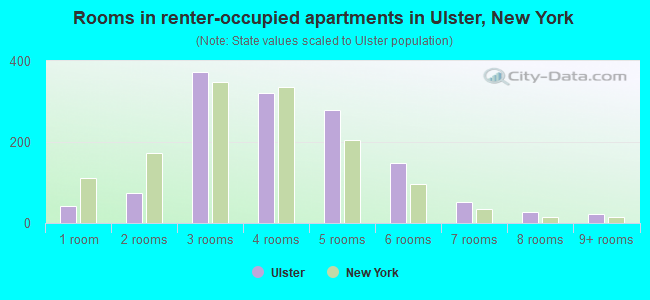
Median contract rent in 2022: $1,243 (lower quartile is $821, upper quartile is $1,758)
Median rent asked for vacant for-rent units in 2022: $1,191
Median gross rent in Ulster, NY in 2022: $1,570
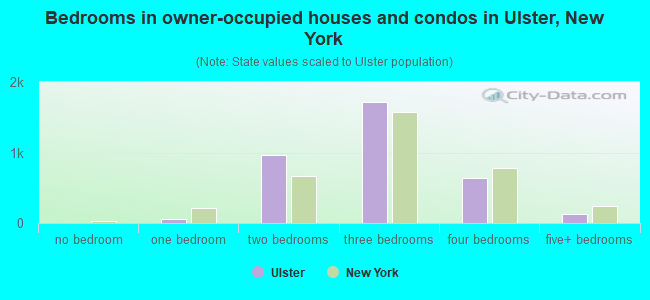
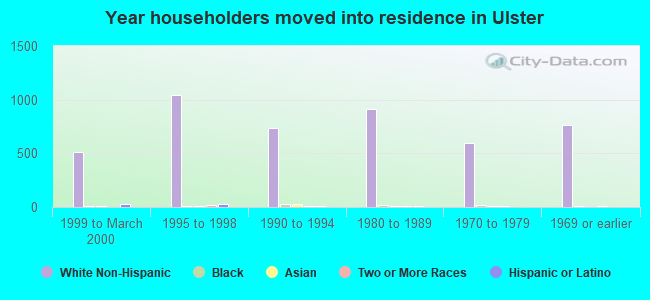
Housing units in Ulster with a mortgage: 1,610 (70 second mortgage, 181 home equity loan, 0 both second mortgage and home equity loan) Houses without a mortgage: 1,078
In family households: 136,249 (29,006 male householders, 15,373 female householders)
32,679 spouses, 46,411 children (43,288 natural, 1,072 adopted, 2,051 stepchildren), 2,688 grandchildren, 1,308 brothers or sisters, 1,585 parents, foster children, 1,522 other relatives, 4,657 non-relatives
In nonfamily households: 34,471 (12,699 male householders (9,405 living alone)), 13,971 female householders (11,227 living alone)), 7,801 nonrelatives
In group quarters: 11,773 (4,349 institutionalized population)
27,635 married couples with children.
9,974 single-parent households (2,588 men, 7,386 women).
93.7% of residents of Ulster speak English at home.
1.7% of residents speak Spanish at home (77% speak English very well, 23% speak English well).
3.4% of residents speak other Indo-European language at home (64% speak English very well, 23% speak English well, 11% speak English not well, 1% don't speak English at all).
0.7% of residents speak Asian or Pacific Island language at home (38% speak English very well, 43% speak English well, 19% speak English not well).
0.5% of residents speak other language at home (79% speak English very well, 21% speak English well).
Foreign born population: 854 (6.6%)
(65.2% of them are naturalized citizens)
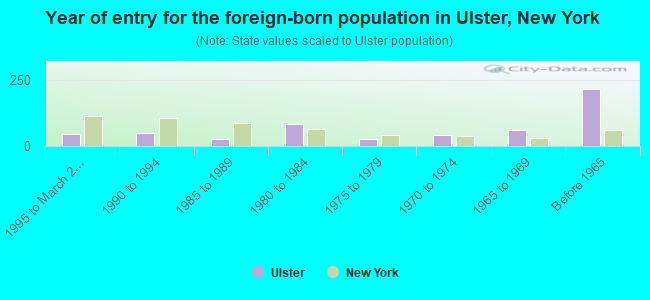
Year of entry for the foreign-born population in Ulster, New York
451995 to March 2000
491990 to 1994
261985 to 1989
831980 to 1984
251975 to 1979
401970 to 1974
601965 to 1969
214Before 1965
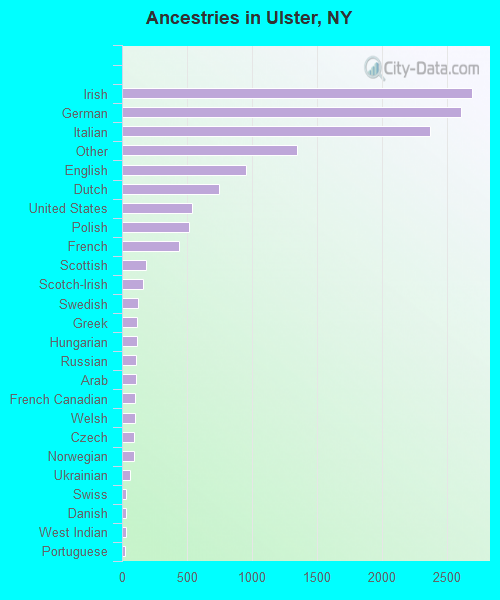
First ancestries reported:
Irish: 2,690 (19.6%)
German: 2,607 (19.0%)
Italian: 2,370 (17.3%)
Other: 1,348 (9.8%)
English: 956 (7.0%)
Dutch: 749 (5.5%)
United States: 539 (3.9%)
Polish: 512 (3.7%)
French: 439 (3.2%)
Scottish: 182 (1.3%)
Scotch-Irish: 163 (1.2%)
Swedish: 123 (0.9%)
Greek: 113 (0.8%)
Hungarian: 112 (0.8%)
Russian: 109 (0.8%)
Arab: 105 (0.8%)
French Canadian: 101 (0.7%)
Welsh: 99 (0.7%)
Czech: 95 (0.7%)
Norwegian: 91 (0.7%)
Ukrainian: 61 (0.4%)
Swiss: 33 (0.2%)
Danish: 31 (0.2%)
West Indian: 29 (0.2%)
Portuguese: 25 (0.2%)
Lithuanian: 19 (0.1%)
Slovak: 8 (0.06%)
Most common places of birth for foreign-born residents (%):
Germany
Ulster:
11.3% (61)
New York:
1.8% (69,327)
Italy
Ulster:
11.1% (60)
New York:
3.8% (147,729)
Pakistan
Ulster:
9.2% (50)
New York:
1.3% (51,055)
United Kingdom
Ulster:
8.3% (45)
New York:
1.6% (62,237)
Dominican Republic
Ulster:
6.3% (34)
New York:
10.5% (408,086)
India
Ulster:
6.1% (33)
New York:
3.0% (117,238)
Canada
Ulster:
5.5% (30)
New York:
1.4% (54,876)
Argentina
Ulster:
3.9% (21)
New York:
0.5% (17,906)
Ireland
Ulster:
3.3% (18)
New York:
1.1% (41,934)
Greece
Ulster:
3.3% (18)
New York:
1.1% (42,335)
Hungary
Ulster:
3.3% (18)
New York:
0.4% (17,401)
Hong Kong
Ulster:
2.6% (14)
New York:
1.0% (37,496)
Taiwan
Ulster:
2.4% (13)
New York:
0.8% (30,473)
Other Western Asia
Ulster:
2.2% (12)
New York:
0.5% (20,012)
Ukraine
Ulster:
2.0% (11)
New York:
2.1% (82,238)
Iraq
Ulster:
2.0% (11)
New York:
0.1% (2,721)
China, excluding Hong Kong and Taiwan
Ulster:
1.8% (10)
New York:
6.0% (233,766)
Vietnam
Ulster:
1.8% (10)
New York:
0.6% (25,141)
Israel
Ulster:
1.8% (10)
New York:
0.8% (29,390)
Brazil
Ulster:
1.8% (10)
New York:
0.6% (22,265)
Place of birth for U.S.-born residents:
This state: 10,318
Other state: 1,646
Northeast: 801
Midwest: 219
South: 470
West: 156
68% of Ulster residents lived in the same house 5 years ago. Out of people who lived in different houses, 65% lived in this county. Out of people who lived in different counties, 72% lived in New York.
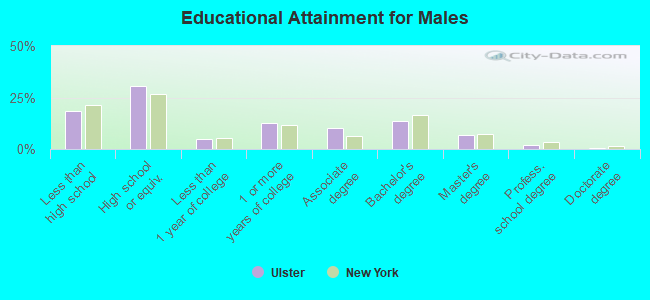
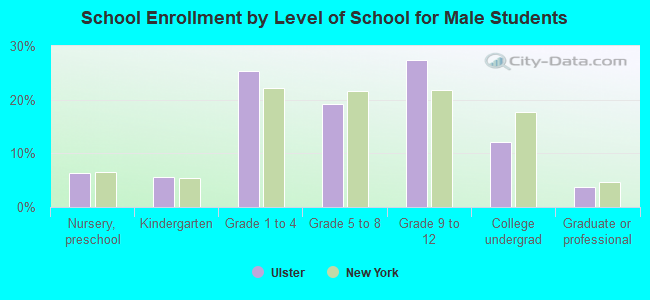
Education attainment for males 25 years and older:
No schooling: 49
Nursery to 4th grade: 7
5th and 6th grade: 17
7th and 8th grade: 142
9th grade: 94
10th grade: 147
11th grade: 104
12th grade, no diploma: 191
High school graduate (or equivalency): 1,265
Less than 1 year of college: 208
Some college more than 1 year, no degree: 524
Associate degree: 420
Bachelor's degree: 567
Master's degree: 285
Professional school degree: 75
Doctorate degree: 21
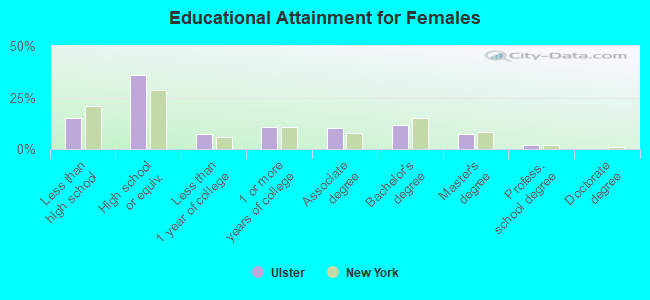
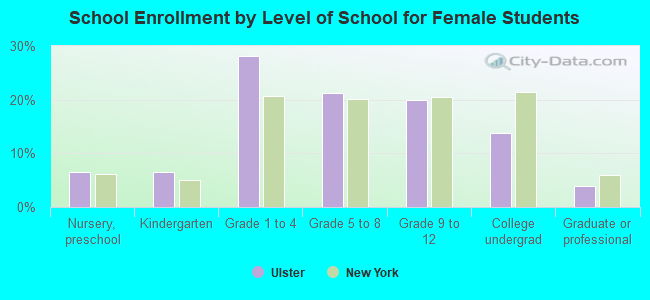
Education attainment for females 25 years and older:
No schooling: 17
Nursery to 4th grade: 14
5th and 6th grade: 0
7th and 8th grade: 183
9th grade: 59
10th grade: 81
11th grade: 161
12th grade, no diploma: 189
High school graduate (or equivalency): 1,687
Less than 1 year of college: 345
Some college more than 1 year, no degree: 497
Associate degree: 475
Bachelor's degree: 543
Master's degree: 331
Professional school degree: 86
Doctorate degree: 5
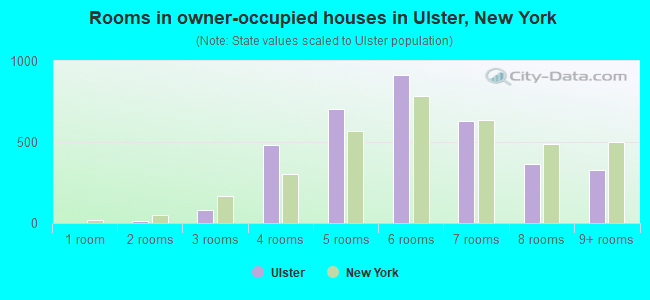
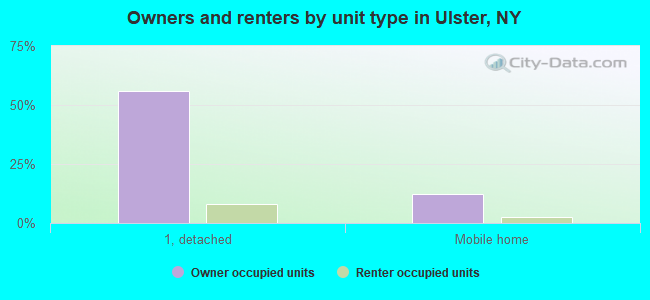
Housing units in structures:
One, detached: 3,353
One, attached: 211
Two: 196
3 or 4: 123
5 to 9: 340
10 to 19: 182
20 to 49: 13
50 or more: 34
Mobile homes: 787
Median worth of mobile homes: $44,648
Housing units lacking complete plumbing facilities: 0.3%
Housing units lacking complete kitchen facilities: 0.1%