Smithfield, VA (Virginia) Houses and Residents
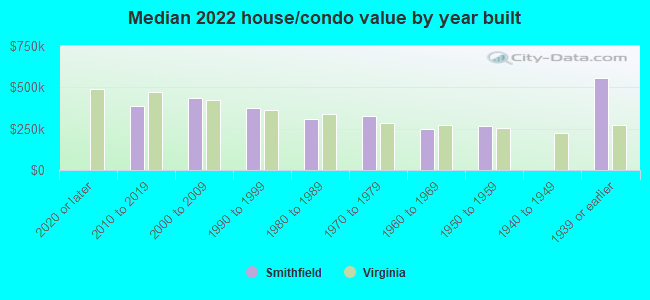
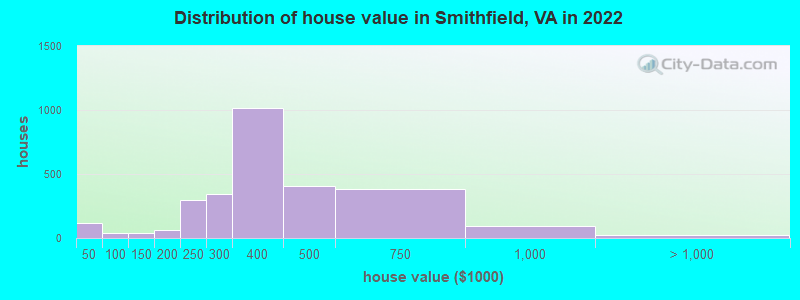
Estimated median house or condo value in 2022: $370,651 (it was $134,000 in 2000 )
Smithfield:
$370,651Virginia:
$365,700
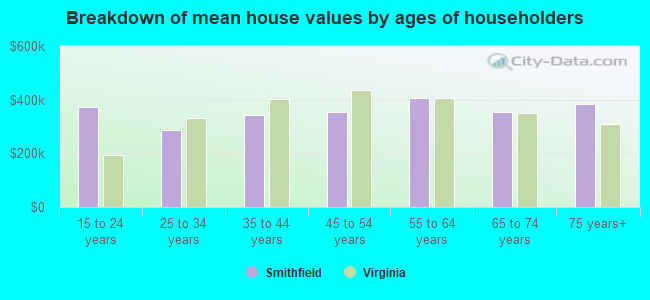
Lower value quartile - upper value quartile: $286,307 - $475,972Mean price in 2022: Detached houses: $433,025 Here:
$433,025State:
$472,865
Townhouses or other attached units: $298,178 Here:
$298,178State:
$457,437
In 3-to-4-unit structures: $218,233 Here:
$218,233State:
$252,346
Mobile homes: $59,389 Here:
$59,389State:
$100,736
Total population: 8,287 (Urban population: 6,051 (all inside urban clusters), Rural population: 82 (all nonfarm) )
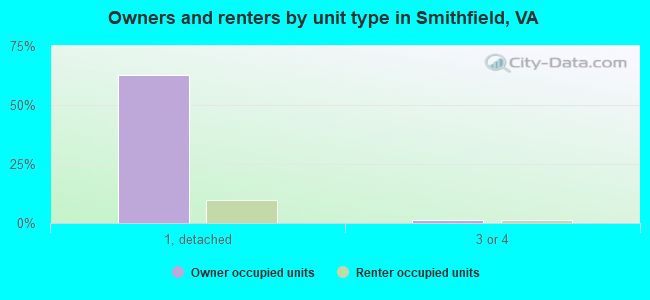
Houses: 3,670 (3,474 occupied: 2,724 owner occupied, 788 renter occupied )
% of renters here:
22%State:
33%
Housing density: 385 houses/condos per square mile
Median price asked for vacant for-sale houses and condos in 2022: $1,019,450.
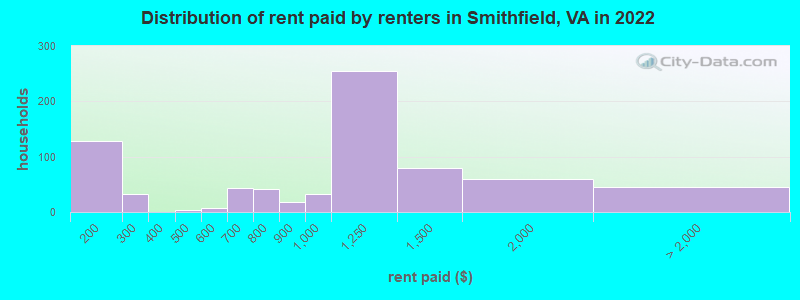
Median contract rent in 2022: $1,053
Median rent asked for vacant for-rent units in 2022: $2,495
Median gross rent in Smithfield, VA in 2022: $1,099
Housing units in Smithfield with a mortgage: 2,035 (144 second mortgage, 0 home equity loan, 122 both second mortgage and home equity loan )Houses without a mortgage: 8
Median household income for houses/condos with a mortgage: $140,855
Median household income for apartments without a mortgage: $64,237
Median monthly housing costs: $1,609
Data:
Median house or condo value ($)
Median house or condo value ($ change since 2000)
Median house or condo value ($) - White
Median house or condo value ($) - Black or African American
Median house or condo value ($) - Asian
Median house or condo value ($) - Hispanic or Latino
Median house or condo value ($) - American Indian and Alaska Native
Median house or condo value ($) - Multirace
Median house or condo value ($) - Other Race
Median price asked for mobile homes ($)
Household density (households per square mile)
Mean house or condo value by units in structure - 1, detached ($)
Mean house or condo value by units in structure - 1, attached ($)
Mean house or condo value by units in structure - 2 ($)
Mean house or condo value by units in structure by units in structure - 3 or 4 ($)
Mean house or condo value by units in structure - 5 or more ($)
Mean house or condo value by units in structure - Boat, RV, van, etc. ($)
Mean house or condo value by units in structure - Mobile home ($)
Median contract rent ($)
Median contract rent - Lower quartile ($)
Median contract rent - Upper quartile ($)
Median gross rent ($)
Urban houses (%)
Rural houses (%)
Houses occupied (%)
Houses occupied (% change since 2000)
Houses owner occupied (%)
Houses owner occupied (% change since 2000)
Houses renter occupied (%)
Houses renter occupied (% change since 2000)
Vacant housing units - For rent (%)
Vacant housing units - For rent (% change since 2000)
Vacant housing units - For sale only (%)
Vacant housing units - For sale only (% change since 2000)
Vacant housing units - Rented or sold, not occupied (%)
Vacant housing units - Rented or sold, not occupied (% change since 2000)
Vacant housing units - For seasonal, recreational, or occasional use (%)
Vacant housing units - For seasonal, recreational, or occasional use (% change since 2000)
Vacant housing units - For migrant workers (%)
Vacant housing units - For migrant workers (% change since 2000)
Vacant housing units - Other vacant (%)
Vacant housing units - Other vacant (% change since 2000)
Median monthly housing costs ($)
Median household income for houses/condos with a mortgage ($)
Median household income for houses/condos without a mortgage ($)
Median household income ($)
Median household income ($) - White
Median household income ($) - Black or African American
Median household income ($) - Asian
Median household income ($) - Hispanic or Latino
Median household income ($) - American Indian and Alaska Native
Median household income ($) - Multirace
Median household income ($) - Other Race
Mortgage status - with mortgage (%)
Mortgage status - with second mortgage (%)
Mortgage status - with home equity loan (%)
Mortgage status - with both second mortgage and home equity loan (%)
Mortgage status - without a mortgage (%)
Median year house/condo built
Median year apartment built
Household type by relationship - Male householder living alone (%)
Household type by relationship - Male householder not living alone (%)
Household type by relationship - Female householder living alone (%)
Household type by relationship - Female householder not living alone (%)
Household type by relationship - Opposite-Sex spouse (%)
Household type by relationship - Same-Sex spouse (%)
Household type by relationship - Opposite-Sex unmarried partner (%)
Household type by relationship - Same-Sex unmarried partner (%)
Household type by relationship - In group quarters (%)
Size of family households - 2-person household (%)
Size of family households - 3-person household (%)
Size of family households - 4-person household (%)
Size of family households - 5-person household (%)
Size of family households - 6-person household (%)
Size of family households - 7-or-more-person household (%)
Size of nonfamily households - 1-person household (%)
Size of nonfamily households - 2-person household (%)
Size of nonfamily households - 3-person household (%)
Size of nonfamily households - 4-person household (%)
Size of nonfamily households - 5-person household (%)
Size of nonfamily households - 6-person household (%)
Size of nonfamily households - 7-or-moreperson household (%)
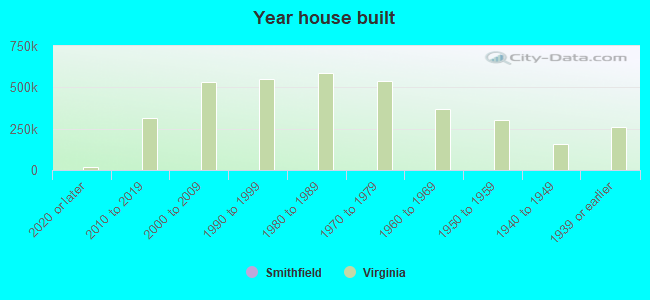
Year house built - Built 2010 or later (%)
Year house built - Built 2000 to 2009 (%)
Year house built - Built 1990 to 1999 (%)
Year house built - Built 1980 to 1989 (%)
Year house built - Built 1970 to 1979 (%)
Year house built - Built 1960 to 1969 (%)
Year house built - Built 1950 to 1959 (%)
Year house built - Built 1940 to 1949 (%)
Year house built - Built 1939 or earlier (%)
Median number of rooms in houses and condos
Median number of rooms in apartments
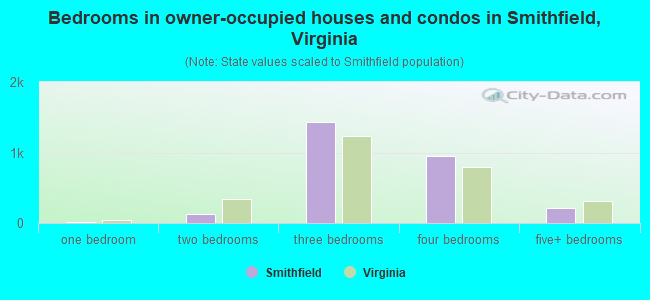
Median number of bedrooms in owner occupied houses
Mean number of bedrooms in owner occupied houses
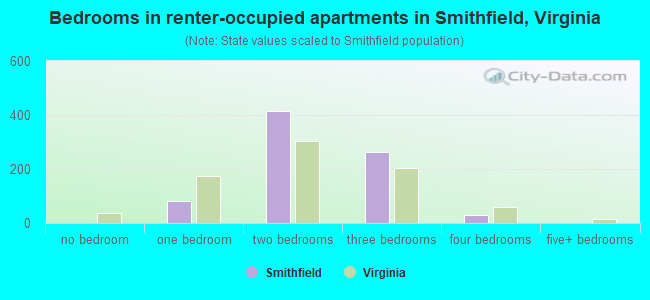
Median number of bedrooms in renter occupied houses
Mean number of bedrooms in renter occupied houses
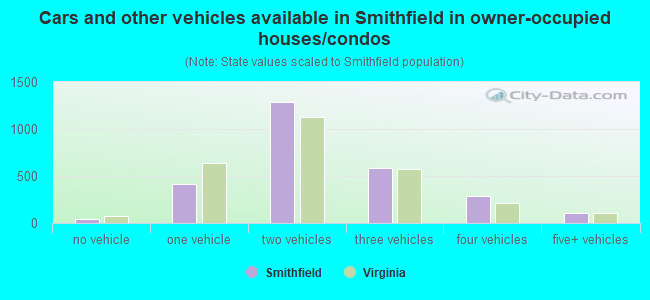
Median number of vehichles in owner occupied houses
Mean number of vehichles in owner occupied houses
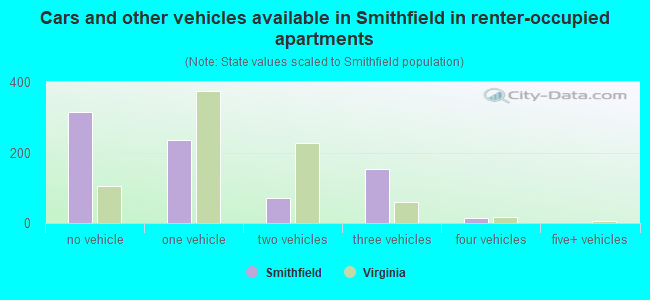
Median number of vehichles in renter occupied houses
Mean number of vehichles in renter occupied houses
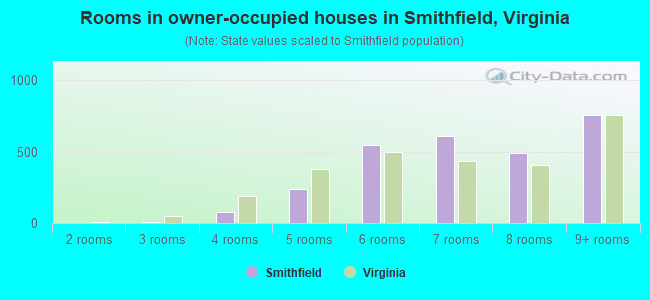
Rooms in owner-occupied houses - 1 room (%)
Rooms in owner-occupied houses - 2 rooms (%)
Rooms in owner-occupied houses - 3 rooms (%)
Rooms in owner-occupied houses - 4 rooms (%)
Rooms in owner-occupied houses - 5 rooms (%)
Rooms in owner-occupied houses - 6 rooms (%)
Rooms in owner-occupied houses - 7 rooms (%)
Rooms in owner-occupied houses - 8 rooms (%)
Rooms in owner-occupied houses - 9+ rooms (%)
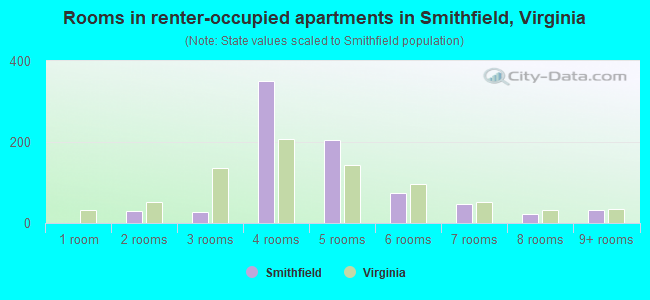
Rooms in renter-occupied houses - 1 room (%)
Rooms in renter-occupied houses - 2 rooms (%)
Rooms in renter-occupied houses - 3 rooms (%)
Rooms in renter-occupied houses - 4 rooms (%)
Rooms in renter-occupied houses - 5 rooms (%)
Rooms in renter-occupied houses - 6 rooms (%)
Rooms in renter-occupied houses - 7 rooms (%)
Rooms in renter-occupied houses - 8 rooms (%)
Rooms in renter-occupied houses - 9+ rooms (%)
Bedrooms in owner-occupied houses - no bedrooms (%)
Bedrooms in owner-occupied houses - 1 bedroom (%)
Bedrooms in owner-occupied houses - 2 bedrooms (%)
Bedrooms in owner-occupied houses - 3 bedrooms (%)
Bedrooms in owner-occupied houses - 4 bedrooms (%)
Bedrooms in owner-occupied houses - 5+ bedrooms (%)
Bedrooms in renter-occupied houses - no bedrooms (%)
Bedrooms in renter-occupied houses - 1 bedroom (%)
Bedrooms in renter-occupied houses - 2 bedrooms (%)
Bedrooms in renter-occupied houses - 3 bedrooms (%)
Bedrooms in renter-occupied houses - 4 bedrooms (%)
Bedrooms in renter-occupied houses - 5+ bedrooms (%)
Vehicles available in owner-occupied houses - no vehicle available (%)
Vehicles available in owner-occupied houses - 1 vehicle available(%)
Vehicles available in owner-occupied houses - 2 Vehicles available (%)
Vehicles available in owner-occupied houses - 3 Vehicles available (%)
Vehicles available in owner-occupied houses - 4 Vehicles available (%)
Vehicles available in owner-occupied houses - 5+ Vehicles available (%)
Vehicles available in renter-occupied houses - no vehicle available (%)
Vehicles available in renter-occupied houses - 1 vehicle available (%)
Vehicles available in renter-occupied houses - 2 Vehicles available (%)
Vehicles available in renter-occupied houses - 3 Vehicles available (%)
Vehicles available in renter-occupied houses - 4 Vehicles available (%)
Vehicles available in renter-occupied houses - 5+ Vehicles available (%)
Housing units in structures - 1, detached (%)
Housing units in structures - 1, attached (%)
Housing units in structures - 2 (%)
Housing units in structures - 3 or 4 (%)
Housing units in structures - 5 to 9 (%)
Housing units in structures - 10 to 19 (%)
Housing units in structures - 20 to 49 (%)
Housing units in structures - 50 or more (%)
Housing units in structures - Mobile home (%)
Housing units in structures - Boat, RV, van, etc. (%)
Housing units in structures - Owners - 1, detached (%)
Housing units in structures - Owners - 1, attached (%)
Housing units in structures - Owners - 2 (%)
Housing units in structures - Owners - 3 or 4 (%)
Housing units in structures - Owners - 5 to 9 (%)
Housing units in structures - Owners - 10 to 19 (%)
Housing units in structures - Owners - 20 to 49 (%)
Housing units in structures - Owners - 50 or more (%)
Housing units in structures - Owners - Mobile home (%)
Housing units in structures - Owners - Boat, RV, van, etc. (%)
Housing units in structures - Renters - 1, detached (%)
Housing units in structures - Renters - 1, attached (%)
Housing units in structures - Renters - 2 (%)
Housing units in structures - Renters - 3 or 4 (%)
Housing units in structures - Renters - 5 to 9 (%)
Housing units in structures - Renters - 10 to 19 (%)
Housing units in structures - Renters - 20 to 49 (%)
Housing units in structures - Renters - 50 or more (%)
Housing units in structures - Renters - Mobile home (%)
Housing units in structures - Renters - Boat, RV, van, etc. (%)
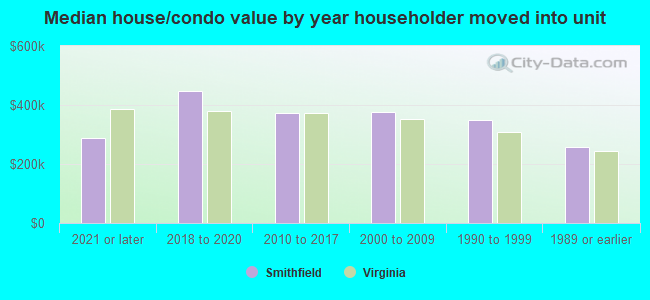
House/condo owner moved in on average (years ago)
Renter moved in on average (years ago)
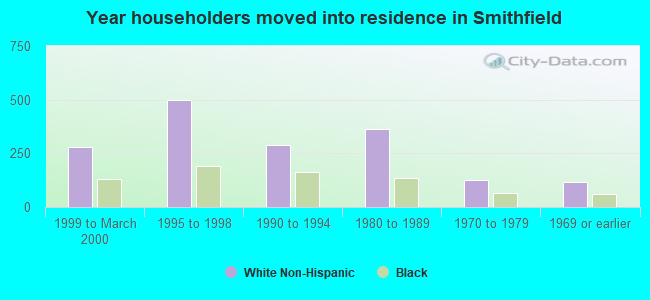
Year householder moved into unit - Moved in 1999 to March 2000 (%)
Year householder moved into unit - Moved in 1999 to March 2000 (%) - White
Year householder moved into unit - Moved in 1999 to March 2000 (%) - Black or African American
Year householder moved into unit - Moved in 1999 to March 2000 (%) - Asian
Year householder moved into unit - Moved in 1999 to March 2000 (%) - Hispanic or Latino
Year householder moved into unit - Moved in 1999 to March 2000 (%) - American Indian and Alaska Native
Year householder moved into unit - Moved in 1999 to March 2000 (%) - Multirace
Year householder moved into unit - Moved in 1999 to March 2000 (%) - Other Race
Year householder moved into unit - Moved in 1995 to 1998 (%)
Year householder moved into unit - Moved in 1995 to 1998 (%) - White
Year householder moved into unit - Moved in 1995 to 1998 (%) - Black or African American
Year householder moved into unit - Moved in 1995 to 1998 (%) - Asian
Year householder moved into unit - Moved in 1995 to 1998 (%) - Hispanic or Latino
Year householder moved into unit - Moved in 1995 to 1998 (%) - American Indian and Alaska Native
Year householder moved into unit - Moved in 1995 to 1998 (%) - Multirace
Year householder moved into unit - Moved in 1995 to 1998 (%) - Other Race
Year householder moved into unit - Moved in 1990 to 1994 (%)
Year householder moved into unit - Moved in 1990 to 1994 (%) - White
Year householder moved into unit - Moved in 1990 to 1994 (%) - Black or African American
Year householder moved into unit - Moved in 1990 to 1994 (%) - Asian
Year householder moved into unit - Moved in 1990 to 1994 (%) - Hispanic or Latino
Year householder moved into unit - Moved in 1990 to 1994 (%) - American Indian and Alaska Native
Year householder moved into unit - Moved in 1990 to 1994 (%) - Multirace
Year householder moved into unit - Moved in 1990 to 1994 (%) - Other Race
Year householder moved into unit - Moved in 1980 to 1989 (%)
Year householder moved into unit - Moved in 1980 to 1989 (%) - White
Year householder moved into unit - Moved in 1980 to 1989 (%) - Black or African American
Year householder moved into unit - Moved in 1980 to 1989 (%) - Asian
Year householder moved into unit - Moved in 1980 to 1989 (%) - Hispanic or Latino
Year householder moved into unit - Moved in 1980 to 1989 (%) - American Indian and Alaska Native
Year householder moved into unit - Moved in 1980 to 1989 (%) - Multirace
Year householder moved into unit - Moved in 1980 to 1989 (%) - Other Race
Year householder moved into unit - Moved in 1970 to 1979 (%)
Year householder moved into unit - Moved in 1970 to 1979 (%) - White
Year householder moved into unit - Moved in 1970 to 1979 (%) - Black or African American
Year householder moved into unit - Moved in 1970 to 1979 (%) - Asian
Year householder moved into unit - Moved in 1970 to 1979 (%) - Hispanic or Latino
Year householder moved into unit - Moved in 1970 to 1979 (%) - American Indian and Alaska Native
Year householder moved into unit - Moved in 1970 to 1979 (%) - Multirace
Year householder moved into unit - Moved in 1970 to 1979 (%) - Other Race
Year householder moved into unit - Moved in 1969 or earlier (%)
Year householder moved into unit - Moved in 1969 or earlier (%) - White
Year householder moved into unit - Moved in 1969 or earlier (%) - Black or African American
Year householder moved into unit - Moved in 1969 or earlier (%) - Asian
Year householder moved into unit - Moved in 1969 or earlier (%) - Hispanic or Latino
Year householder moved into unit - Moved in 1969 or earlier (%) - American Indian and Alaska Native
Year householder moved into unit - Moved in 1969 or earlier (%) - Multirace
Year householder moved into unit - Moved in 1969 or earlier (%) - Other Race
Housing units lacking complete plumbing facilities (%)
Housing units lacking complete kitchen facilities (%)
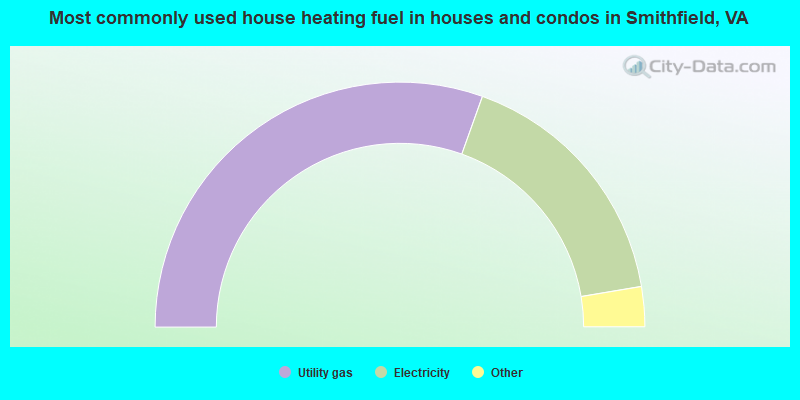
House heating fuel used in houses and condos - Utility gas (%)
House heating fuel used in houses and condos - Bottled, tank, or LP gas (%)
House heating fuel used in houses and condos - Electricity (%)
House heating fuel used in houses and condos - Fuel oil, kerosene, etc. (%)
House heating fuel used in houses and condos - Coal or coke (%)
House heating fuel used in houses and condos - Wood (%)
House heating fuel used in houses and condos - Solar energy (%)
House heating fuel used in houses and condos - Other fuel (%)
House heating fuel used in houses and condos - No fuel used (%)
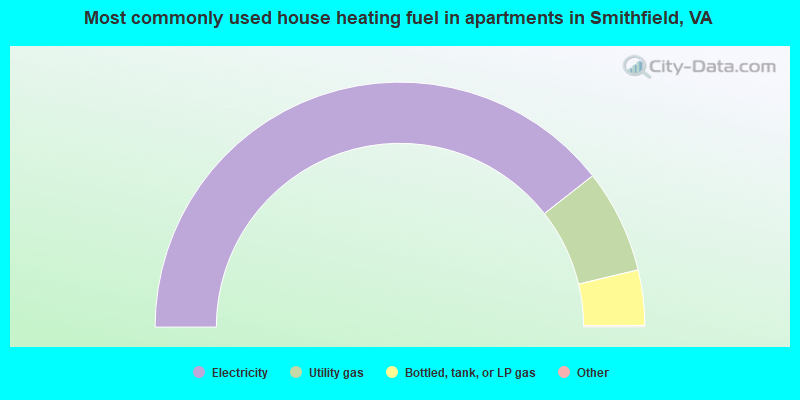
House heating fuel used in apartments - Utility gas (%)
House heating fuel used in apartments - Bottled, tank, or LP gas (%)
House heating fuel used in apartments - Electricity (%)
House heating fuel used in apartments - Fuel oil, kerosene, etc. (%)
House heating fuel used in apartments - Coal or coke (%)
House heating fuel used in apartments - Wood (%)
House heating fuel used in apartments - Solar energy (%)
House heating fuel used in apartments - Other fuel (%)
House heating fuel used in apartments - No fuel used (%)
Latest news about housing in Smithfield, VA collected exclusively by city-data.com from local newspapers, TV, and radio stations
Median year house/condo built: 1995Median year apartment built: 1980Household type by relationship:
Households: 8,684
Male householders: 1,651 (232 living alone ), Female householders: 1,790 (550 living alone )1,887 spouses (1,883 opposite-sex spouses ), 276 unmarried partners , (198 opposite-sex unmarried partners ), 2,610 children (2,348 natural , 98 adopted , 163 stepchildren ), 34 grandchildren , 71 brothers or sisters , 24 parents , 0 foster children , 142 other relatives , 103 non-relatives In group quarters: 90
Size of family households: 1,027 2-persons , 690 3-persons , 544 4-persons , 114 5-persons , 11 6-persons , 14 7-or-more-persons .
Size of nonfamily households: 805 1-person , 260 2-persons , 29 3-persons .
1,167 married couples with children. single-parent households (18 men , 507 women ).
95.2% of residents of Smithfield speak English at home. of residents speak Spanish at home (62% speak English very well , 31% speak English well , 7% speak English not well ).of residents speak other Indo-European language at home (82% speak English very well , 18% speak English well ).of residents speak Asian or Pacific Island language at home (50% speak English well , 50% speak English not well ).
Foreign born population: 304 (3.5%)of them are naturalized citizens )
Median number of rooms in houses and condos:
Median number of rooms in apartments
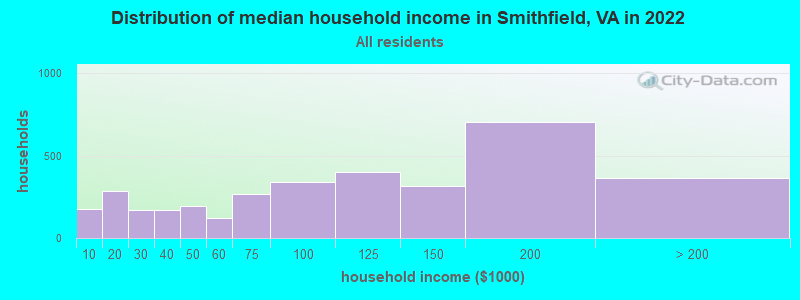
Smithfield, VA household income distribution 178 Less than $10,000284 $10,000 to $19,999173 $20,000 to $29,999172 $30,000 to $39,999196 $40,000 to $49,999123 $50,000 to $59,999269 $60,000 to $74,999341 $75,000 to $99,999403 $100,000 to $124,999316 $125,000 to $149,999705 $150,000 to $199,999365 $200,000 or more
Home value of owner - occupied houses in 2022 in Smithfield, VA 21 Less than $10,00019 $10,000 to $14,9992 $15,000 to $19,99924 $20,000 to $24,99915 $25,000 to $29,9997 $35,000 to $39,99926 $40,000 to $49,9999 $50,000 to $59,99934 $100,000 to $124,9996 $125,000 to $149,99926 $150,000 to $174,99939 $175,000 to $199,999294 $200,000 to $249,999346 $250,000 to $299,9991,012 $300,000 to $399,999409 $400,000 to $499,999379 $500,000 to $749,99993 $750,000 to $999,9998 $1,000,000 to $1,499,99914 $2,000,000 or moreRent paid by renters in 2022 in Smithfield, VA 69 $100 to $14960 $150 to $19932 $250 to $2992 $450 to $4997 $500 to $54943 $650 to $69941 $700 to $74918 $800 to $89932 $900 to $999253 $1,000 to $1,24979 $1,250 to $1,49959 $1,500 to $1,99945 No cash rent
Percentage of workers working in this county: 40.3%Number of people working at home: 649 (15.8% of all workers )
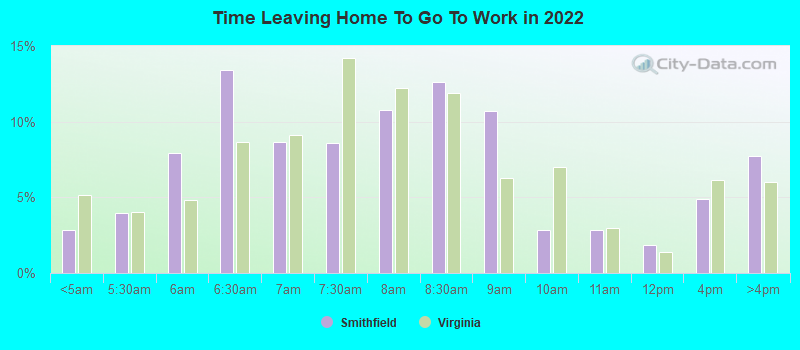
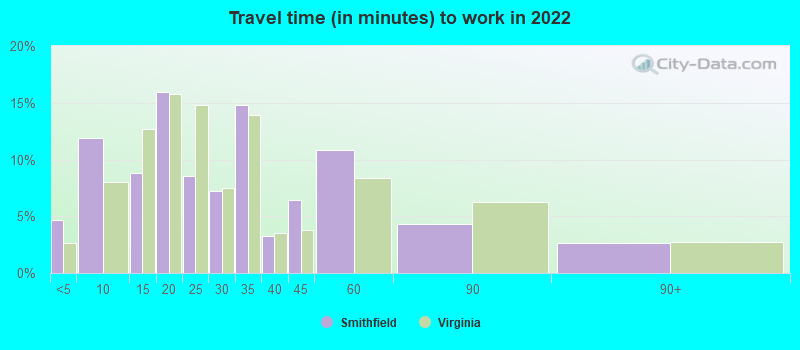
Travel time to work (commute)
Less than 5 minutes: 1625 to 9 minutes: 37510 to 14 minutes: 27615 to 19 minutes: 25520 to 24 minutes: 24125 to 29 minutes: 49930 to 34 minutes: 60335 to 39 minutes: 20640 to 44 minutes: 17645 to 59 minutes: 38560 to 89 minutes: 10190 or more minutes: 120
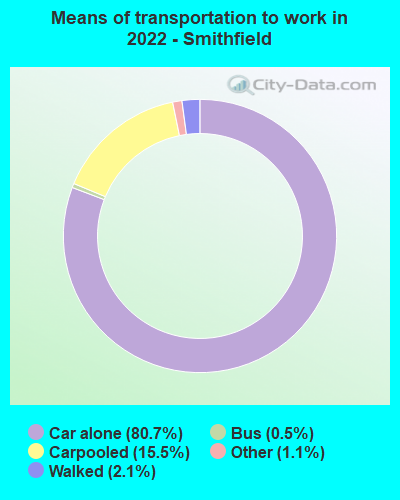
Means of transportation to work:
Drove a car alone: 3,871 (69.9%)Carpooled: 757 (13.7%)Bus : 18 (0.3%)Taxi: 62 (1.1%)Walked: 109 (2.0%)Worked at home: 649 (11.7%)
Unemployment by race in 2022
Unemployment rate for White non-Hispanic residents 1.2% Males1.7% FemalesUnemployment rate for Black residents 8.0% Males9.3% FemalesUnemployment rate for two or more race residents 17.0% Males3.1% FemalesUnemployment rate for Hispanic or Latino residents 11.0% Males45.9% Females
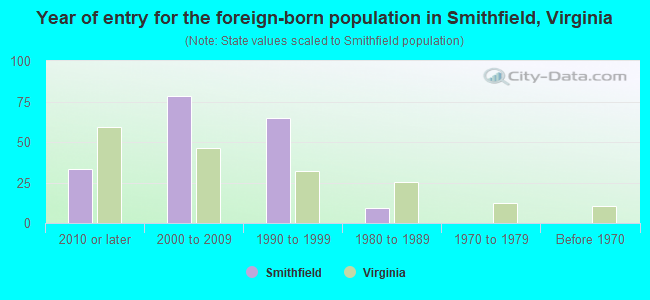
Year of entry for the foreign-born population in Smithfield, Virginia
33 2010 or later 78 2000 to 2009 65 1990 to 1999 9 1980 to 1989 0 1970 to 1979 0 Before 1970
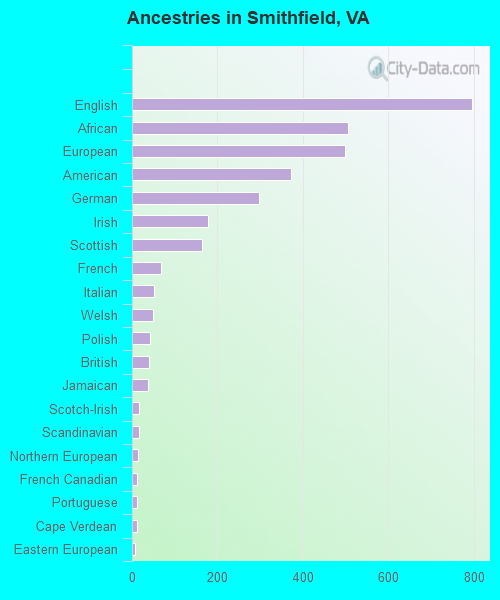
First ancestries reported:
English: 796 (18.9%)
African: 505 (12.0%)
European: 499 (11.9%)
American: 373 (8.9%)
German: 297 (7.1%)
Irish: 177 (4.2%)
Scottish: 163 (3.9%)
French: 69 (1.6%)
Italian: 52 (1.2%)
Welsh: 49 (1.2%)
Polish: 43 (1.0%)
British: 40 (1.0%)
Jamaican: 38 (0.9%)
Scotch-Irish: 17 (0.4%)
Scandinavian: 16 (0.4%)
Northern European: 13 (0.3%)
French Canadian: 12 (0.3%)
Portuguese: 11 (0.3%)
Cape Verdean: 11 (0.3%)
Eastern European: 8 (0.2%)
Hungarian: 7 (0.2%)
Norwegian: 5 (0.1%)
Russian: 5 (0.1%)
Pennsylvania German: 4 (0.10%) Most common places of birth for foreign-born residents (%): Dominican Republic Smithfield:
21.1% (64)Virginia:
0.6% (6,698)
Cuba Smithfield:
20.4% (62)Virginia:
0.5% (5,899)
Russia Smithfield:
14.8% (45)Virginia:
0.9% (9,440)
England Smithfield:
8.9% (27)Virginia:
0.9% (9,842)
Switzerland Smithfield:
7.9% (24)Virginia:
0.1% (961)
Canada Smithfield:
7.9% (24)Virginia:
1.2% (12,984)
Azores Islands Smithfield:
4.6% (14)Virginia:
0.0% (33)
Germany Smithfield:
3.6% (11)Virginia:
1.7% (18,227)
Mexico Smithfield:
3.6% (11)Virginia:
5.3% (57,498)
Jamaica Smithfield:
3.3% (10)Virginia:
1.0% (10,734)
Other South Central Asia Smithfield:
3.0% (9)Virginia:
0.1% (994)
Portugal Smithfield:
3.0% (9)Virginia:
0.2% (1,848)
Korea Smithfield:
1.6% (5)Virginia:
4.9% (52,857)
Place of birth for U.S.-born residents:
This state: 4,747Other state: 3,454Northeast: 850Midwest: 781South: 1,382West: 436 90.4% of Smithfield residents lived in the same house 1 years ago.
Out of people who lived in different houses, 25.9% lived in this county.
Out of people who lived in different counties, 69.4% lived in Virginia.
Smithfield:
90.4%State average:
86.6%
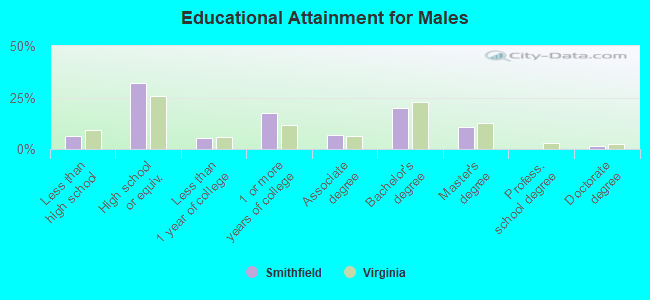
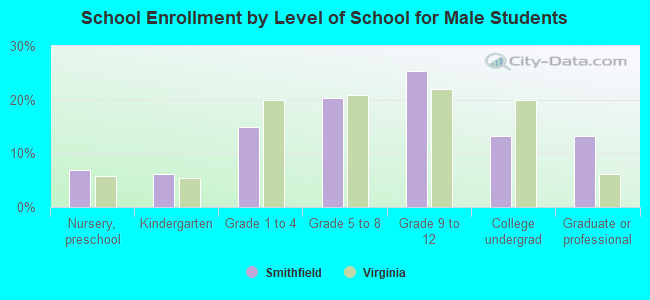
Education attainment for males 25 years and older:
No schooling: 0Nursery to 4th grade: 05th and 6th grade: 47th and 8th grade: 199th grade: 1110th grade: 7411th grade: 1612th grade, no diploma: 71High school graduate (or equivalency): 1,017Less than 1 year of college: 177Some college more than 1 year, no degree: 566Associate degree: 223Bachelor's degree: 629Master's degree: 340Professional school degree: 0Doctorate degree: 51
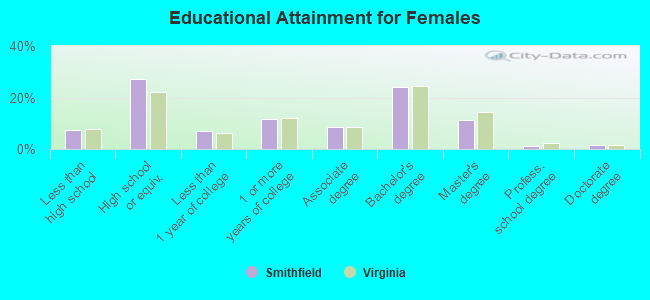
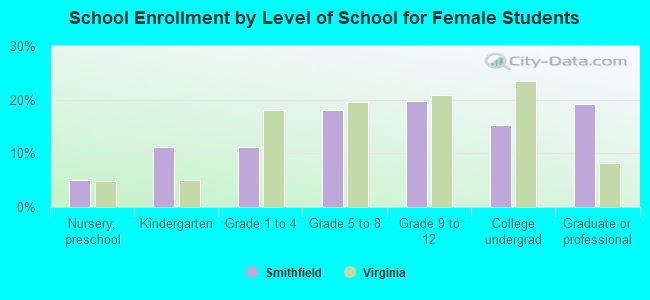
Education attainment for females 25 years and older:
No schooling: 6Nursery to 4th grade: 05th and 6th grade: 197th and 8th grade: 629th grade: 2210th grade: 4711th grade: 7612th grade, no diploma: 1High school graduate (or equivalency): 877Less than 1 year of college: 229Some college more than 1 year, no degree: 379Associate degree: 276Bachelor's degree: 778Master's degree: 359Professional school degree: 32Doctorate degree: 56
Housing units in structures:
One, detached: 2,842One, attached: 155Two: 343 or 4: 595 to 9: 28810 to 19: 21450 or more: 22Mobile homes: 52Median worth of mobile homes: $26,176
Housing units lacking complete kitchen facilities in 2022: 0.2%House/condo owner moved in on average 11 years ago
Renter moved in on average 4 years ago
Private vs. public school enrollment:
Students in private schools in grades 1 to 8 (elementary and middle school): 59 Students in private schools in grades 9 to 12 (high school): 39 Students in private undergraduate colleges: 99