Roma-Los Saenz, TX (Texas) Houses and Residents
| Roma-Los Saenz: | $103,608 |
| Texas: | $275,400 |
Total population: 20,644 (Urban population: 15,235 (all inside urban clusters), Rural population: 3,075 (all nonfarm))
Houses: 6,163 (4,979 occupied: 3,794 owner occupied, 1,185 renter occupied)
| % of renters here: | 24% |
| State: | 38% |
Housing density: 20 houses/condos per square mile
Median price asked for vacant for-sale houses and condos in 2022 in this county: $100,784.
Median contract rent in 2022: $535 (lower quartile is $359, upper quartile is $649)
Median rent asked for vacant for-rent units in 2022: $555
Median gross rent in Roma-Los Saenz, TX in 2022: $709
Housing units in Roma-Los Saenz with a mortgage: 463 (0 second mortgage, 23 home equity loan, 0 both second mortgage and home equity loan)
Houses without a mortgage: 2,906
Compare current foreclosures near Roma-Los Saenz, TX:
| Photo | Address | Area | Beds / Baths | Price | Details |
|---|---|---|---|---|---|

|
#1
Palmview Cir
Rio Grande City, TX 78582
|
1,360 sq. feet
|
2 baths 3 beds |
$109,900
|
show details |

|
#2
Guerra St
Roma, TX 78584
|
- sq. feet
|
- baths - beds |
show details | |

|
#3
Guerra St
Roma, TX 78584
|
- sq. feet
|
- baths - beds |
show details | |

|
#4
Ciprianos Rd
Rio Grande City, TX 78582
|
- sq. feet
|
- baths - beds |
show details | |

|
#5
W Durazno St
Rio Grande City, TX 78582
|
1,451 sq. feet
|
- baths - beds |
show details | |

|
#6
W Ash St
Rio Grande City, TX 78582
|
1,588 sq. feet
|
- baths - beds |
show details | |

|
#7
N Clay St
Rio Grande City, TX 78582
|
- sq. feet
|
- baths - beds |
show details | |

|
#8
N Avasolo St
Rio Grande City, TX 78582
|
- sq. feet
|
- baths - beds |
show details | |

|
#9
Pencil Stick Dr
Rio Grande City, TX 78582
|
2,784 sq. feet
|
- baths - beds |
show details | |

|
#10
Lopez Ln
Rio Grande City, TX 78582
|
1,697 sq. feet
|
- baths - beds |
show details |
| Photo | Address | Area | Beds / Baths | Price | Details |
|---|---|---|---|---|---|

|
#11
Durango St
Rio Grande City, TX 78582
|
- sq. feet
|
- baths - beds |
show details | |

|
#12
Brooks St
Rio Grande City, TX 78582
|
- sq. feet
|
- baths - beds |
show details | |

|
#13
Los Altos St
Roma, TX 78584
|
- sq. feet
|
- baths - beds |
show details | |

|
#14
W Santa Maria St
Rio Grande City, TX 78582
|
- sq. feet
|
- baths - beds |
show details | |

|
#15
Paseo Lindo St
Rio Grande City, TX 78582
|
- sq. feet
|
- baths - beds |
show details | |

|
Check over 1 million property listings on Foreclosure.com!
|
browse all offers | |||

Household type by relationship:
Households: 60,158- In family households: 57,363 (9,495 male householders, 4,985 female householders)
10,357 spouses, 24,018 children (23,174 natural, 234 adopted, 610 stepchildren), 3,607 grandchildren, 756 brothers or sisters, 775 parents, foster children, 1,388 other relatives, 665 non-relatives
- In nonfamily households: 2,795 (1,077 male householders (976 living alone)), 1,444 female householders (1,342 living alone)), 274 nonrelatives
- In group quarters: 810 (747 institutionalized population)
13,460 married couples with children.
3,493 single-parent households (528 men, 2,965 women).
7.4% of residents of Roma-Los Saenz speak English at home.
92.4% of residents speak Spanish at home (38% speak English very well, 27% speak English well, 15% speak English not well, 20% don't speak English at all).
0.1% of residents speak other language at home (100% don't speak English at all).
Foreign born population: 6,767 (30.1%)
(41.5% of them are naturalized citizens)
| Here: | 5.4 |
| State: | 6.3 |
| Here: | 4.1 |
| State: | 4.0 |

- Bedrooms in owner-occupied houses and condos in Roma-Los Saenz, Texas
- 195no bedroom
- 4181 bedroom
- 9062 bedrooms
- 1,7253 bedrooms
- 4694 bedrooms
- 815+ bedrooms

- Bedrooms in renter-occupied apartments in Roma-Los Saenz, Texas
- 135no bedroom
- 2251 bedroom
- 4262 bedrooms
- 3233 bedrooms
- 764 bedrooms
- 05+ bedrooms

- Cars and other vehicles available in Roma-Los Saenz in owner-occupied houses/condos
- 578no vehicle
- 1,2571 vehicle
- 1,4712 vehicles
- 3703 vehicles
- 884 vehicles
- 305+ vehicles

- Cars and other vehicles available in Roma-Los Saenz in renter-occupied apartments
- 268no vehicle
- 6061 vehicle
- 2602 vehicles
- 433 vehicles
- 04 vehicles
- 85+ vehicles

- Rooms in owner-occupied houses in Roma-Los Saenz, Texas
- 441 room
- 2632 rooms
- 5733 rooms
- 6774 rooms
- 8535 rooms
- 6936 rooms
- 3757 rooms
- 2168 rooms
- 1009+ rooms

- Rooms in renter-occupied apartments in Roma-Los Saenz, Texas
- 401 room
- 2132 rooms
- 2173 rooms
- 2734 rooms
- 2025 rooms
- 1556 rooms
- 487 rooms
- 208 rooms
- 179+ rooms


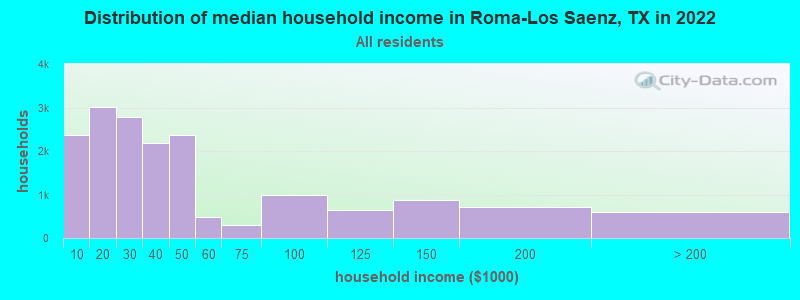
Roma-Los Saenz, TX household income distribution

- 2,359Less than $10,000
- 3,006$10,000 to $19,999
- 2,791$20,000 to $29,999
- 2,189$30,000 to $39,999
- 2,370$40,000 to $49,999
- 472$50,000 to $59,999
- 290$60,000 to $74,999
- 999$75,000 to $99,999
- 647$100,000 to $124,999
- 883$125,000 to $149,999
- 707$150,000 to $199,999
- 595$200,000 or more
Percentage of workers working in this county: 85.1%
Number of people working at home: 1,027 (14.3% of all workers)
Travel time to work (commute)
- Less than 5 minutes: 272
- 5 to 9 minutes: 910
- 10 to 14 minutes: 1,026
- 15 to 19 minutes: 710
- 20 to 24 minutes: 407
- 25 to 29 minutes: 115
- 30 to 34 minutes: 395
- 35 to 39 minutes: 19
- 40 to 44 minutes: 63
- 45 to 59 minutes: 151
- 60 to 89 minutes: 198
- 90 or more minutes: 193
Means of transportation to work:
- Drove a car alone: 3,070 (66.7%)
- Carpooled: 847 (18.4%)
- Bus or trolley bus: 34 (0.7%)
- Walked: 281 (6.1%)
- Other means: 227 (4.9%)
- Worked at home: 147 (3.2%)


- Year of entry for the foreign-born population in Roma-Los Saenz, Texas
- 1,1021995 to March 2000
- 9481990 to 1994
- 1,2071985 to 1989
- 9501980 to 1984
- 1,1741975 to 1979
- 9561970 to 1974
- 5981965 to 1969
- 795Before 1965
Most common places of birth for foreign-born residents (%):
| Roma-Los Saenz: | 99.6% (7,697) |
| Texas: | 64.8% (1,879,369) |
Place of birth for U.S.-born residents:
- This state: 9,696
- Other state: 725
- Northeast: 11
- Midwest: 320
- South: 45
- West: 349
77% of Roma-Los Saenz residents lived in the same house 5 years ago.
Out of people who lived in different houses, 75% lived in this county.
Out of people who lived in different counties, 59% lived in Texas.
Education attainment for males 25 years and older:
- No schooling: 423
- Nursery to 4th grade: 465
- 5th and 6th grade: 757
- 7th and 8th grade: 382
- 9th grade: 382
- 10th grade: 151
- 11th grade: 220
- 12th grade, no diploma: 214
- High school graduate (or equivalency): 532
- Less than 1 year of college: 102
- Some college more than 1 year, no degree: 217
- Associate degree: 82
- Bachelor's degree: 155
- Master's degree: 55
- Professional school degree: 73
- Doctorate degree: 22

Education attainment for females 25 years and older:
- No schooling: 631
- Nursery to 4th grade: 670
- 5th and 6th grade: 924
- 7th and 8th grade: 469
- 9th grade: 432
- 10th grade: 175
- 11th grade: 153
- 12th grade, no diploma: 193
- High school graduate (or equivalency): 768
- Less than 1 year of college: 321
- Some college more than 1 year, no degree: 179
- Associate degree: 45
- Bachelor's degree: 197
- Master's degree: 97
- Professional school degree: 64
- Doctorate degree: 0


Housing units in structures:
- One, detached: 4,896
- One, attached: 225
- Two: 86
- 3 or 4: 148
- 5 to 9: 111
- 10 to 19: 55
- Mobile homes: 617
- Boats, RVs, vans, etc.: 25
Median worth of mobile homes: $31,696
Housing units lacking complete kitchen facilities: 6.4%

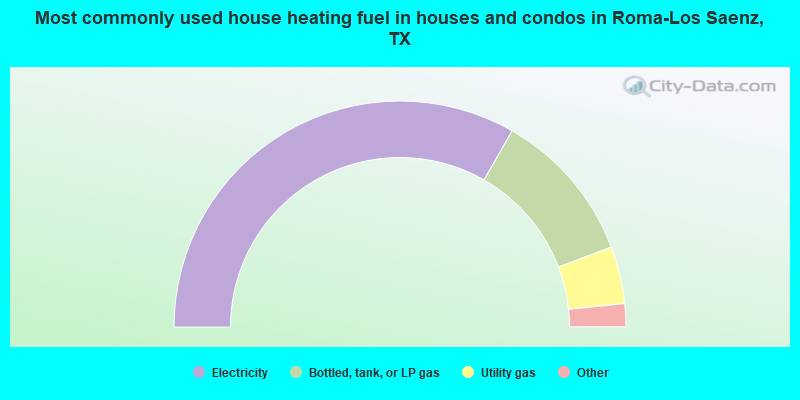
- 66.6%Electricity
- 22.0%Bottled, tank, or LP gas
- 8.2%Utility gas
- 2.2%No fuel used
- 0.9%Other fuel
- 0.2%Wood
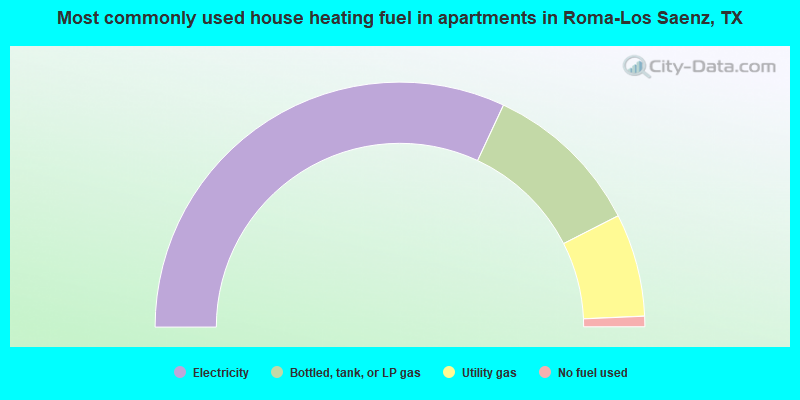
- 63.9%Electricity
- 21.1%Bottled, tank, or LP gas
- 13.6%Utility gas
- 1.4%No fuel used
Private vs. public school enrollment:
| Here: | 0.8% |
| Texas: | 6.8% |
| Here: | 0.0% |
| Texas: | 6.2% |
| Here: | 7.9% |
| Texas: | 15.4% |


