North Liberty, IA (Iowa) Houses and Residents
Estimated median house or condo value in 2022: $269,658 (it was $94,200 in 2000 )
North Liberty:
$269,658Iowa:
$194,600
Lower value quartile - upper value quartile: $193,296 - $368,812Mean price in 2022: Detached houses: $375,088 Here:
$375,088State:
$245,224
Townhouses or other attached units: $182,831 Here:
$182,831State:
$238,767
In 5-or-more-unit structures: $82,530 Here:
$82,530State:
$190,519
Mobile homes: $22,795 Here:
$22,795State:
$51,271
Total population: 15,386 (Urban population: 4,998, Rural population: 383 (18 farm, 365 nonfarm ))
Houses: 8,568 (7,975 occupied: 5,675 owner occupied, 2,309 renter occupied )
% of renters here:
29%State:
28%
Housing density: 1,264 houses/condos per square mile
Median price asked for vacant for-sale houses and condos in 2022: $217,404.
Median contract rent in 2022: $1,039 (lower quartile is $811, upper quartile is $1,283)
Median rent asked for vacant for-rent units in 2022: $1,201
Median gross rent in North Liberty, IA in 2022: $1,159
Housing units in North Liberty with a mortgage: 4,368 (696 second mortgage, 99 home equity loan, 372 both second mortgage and home equity loan )Houses without a mortgage: 0
Median household income for houses/condos with a mortgage: $118,507
Median household income for apartments without a mortgage: $89,946
Median monthly housing costs: $1,471
Data:
Median house or condo value ($)
Median house or condo value ($ change since 2000)
Median house or condo value ($) - White
Median house or condo value ($) - Black or African American
Median house or condo value ($) - Asian
Median house or condo value ($) - Hispanic or Latino
Median house or condo value ($) - American Indian and Alaska Native
Median house or condo value ($) - Multirace
Median house or condo value ($) - Other Race
Median price asked for mobile homes ($)
Household density (households per square mile)
Mean house or condo value by units in structure - 1, detached ($)
Mean house or condo value by units in structure - 1, attached ($)
Mean house or condo value by units in structure - 2 ($)
Mean house or condo value by units in structure by units in structure - 3 or 4 ($)
Mean house or condo value by units in structure - 5 or more ($)
Mean house or condo value by units in structure - Boat, RV, van, etc. ($)
Mean house or condo value by units in structure - Mobile home ($)
Median contract rent ($)
Median contract rent - Lower quartile ($)
Median contract rent - Upper quartile ($)
Median gross rent ($)
Urban houses (%)
Rural houses (%)
Houses occupied (%)
Houses occupied (% change since 2000)
Houses owner occupied (%)
Houses owner occupied (% change since 2000)
Houses renter occupied (%)
Houses renter occupied (% change since 2000)
Vacant housing units - For rent (%)
Vacant housing units - For rent (% change since 2000)
Vacant housing units - For sale only (%)
Vacant housing units - For sale only (% change since 2000)
Vacant housing units - Rented or sold, not occupied (%)
Vacant housing units - Rented or sold, not occupied (% change since 2000)
Vacant housing units - For seasonal, recreational, or occasional use (%)
Vacant housing units - For seasonal, recreational, or occasional use (% change since 2000)
Vacant housing units - For migrant workers (%)
Vacant housing units - For migrant workers (% change since 2000)
Vacant housing units - Other vacant (%)
Vacant housing units - Other vacant (% change since 2000)
Median monthly housing costs ($)
Median household income for houses/condos with a mortgage ($)
Median household income for houses/condos without a mortgage ($)
Median household income ($)
Median household income ($) - White
Median household income ($) - Black or African American
Median household income ($) - Asian
Median household income ($) - Hispanic or Latino
Median household income ($) - American Indian and Alaska Native
Median household income ($) - Multirace
Median household income ($) - Other Race
Mortgage status - with mortgage (%)
Mortgage status - with second mortgage (%)
Mortgage status - with home equity loan (%)
Mortgage status - with both second mortgage and home equity loan (%)
Mortgage status - without a mortgage (%)
Median year house/condo built
Median year apartment built
Household type by relationship - Male householder living alone (%)
Household type by relationship - Male householder not living alone (%)
Household type by relationship - Female householder living alone (%)
Household type by relationship - Female householder not living alone (%)
Household type by relationship - Opposite-Sex spouse (%)
Household type by relationship - Same-Sex spouse (%)
Household type by relationship - Opposite-Sex unmarried partner (%)
Household type by relationship - Same-Sex unmarried partner (%)
Household type by relationship - In group quarters (%)
Size of family households - 2-person household (%)
Size of family households - 3-person household (%)
Size of family households - 4-person household (%)
Size of family households - 5-person household (%)
Size of family households - 6-person household (%)
Size of family households - 7-or-more-person household (%)
Size of nonfamily households - 1-person household (%)
Size of nonfamily households - 2-person household (%)
Size of nonfamily households - 3-person household (%)
Size of nonfamily households - 4-person household (%)
Size of nonfamily households - 5-person household (%)
Size of nonfamily households - 6-person household (%)
Size of nonfamily households - 7-or-moreperson household (%)
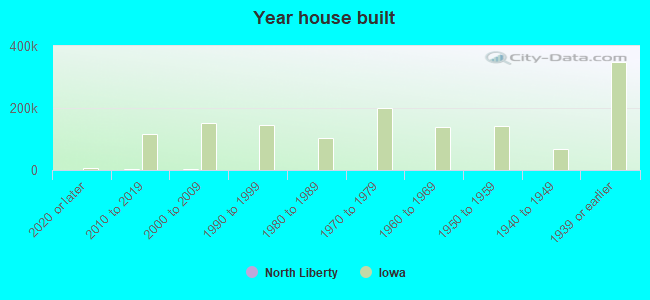
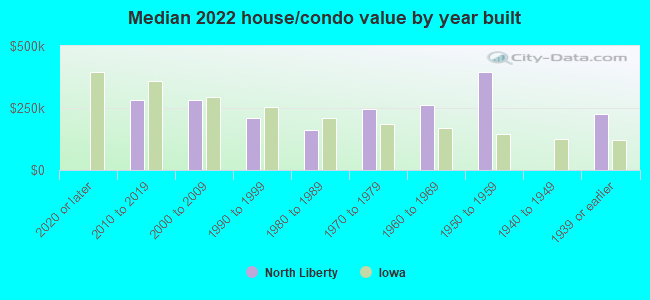
Year house built - Built 2010 or later (%)
Year house built - Built 2000 to 2009 (%)
Year house built - Built 1990 to 1999 (%)
Year house built - Built 1980 to 1989 (%)
Year house built - Built 1970 to 1979 (%)
Year house built - Built 1960 to 1969 (%)
Year house built - Built 1950 to 1959 (%)
Year house built - Built 1940 to 1949 (%)
Year house built - Built 1939 or earlier (%)
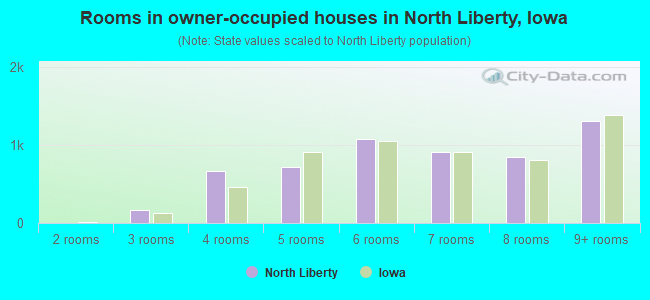
Median number of rooms in houses and condos
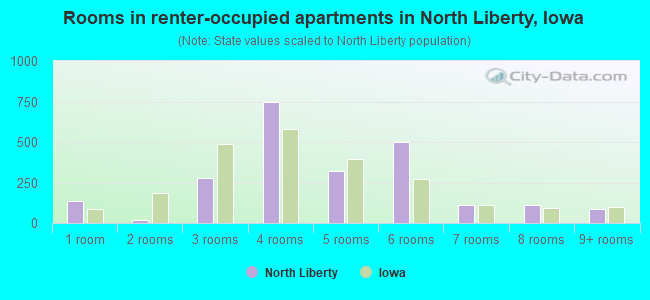
Median number of rooms in apartments
Median number of bedrooms in owner occupied houses
Mean number of bedrooms in owner occupied houses
Median number of bedrooms in renter occupied houses
Mean number of bedrooms in renter occupied houses
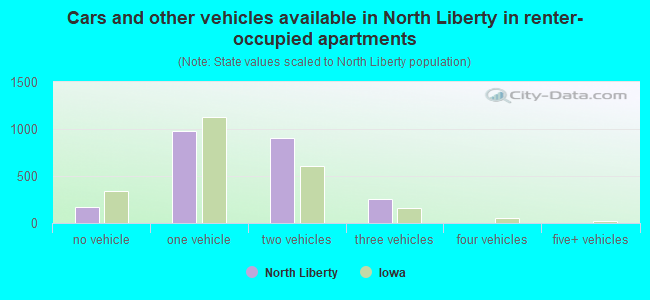
Median number of vehichles in owner occupied houses
Mean number of vehichles in owner occupied houses
Median number of vehichles in renter occupied houses
Mean number of vehichles in renter occupied houses
Rooms in owner-occupied houses - 1 room (%)
Rooms in owner-occupied houses - 2 rooms (%)
Rooms in owner-occupied houses - 3 rooms (%)
Rooms in owner-occupied houses - 4 rooms (%)
Rooms in owner-occupied houses - 5 rooms (%)
Rooms in owner-occupied houses - 6 rooms (%)
Rooms in owner-occupied houses - 7 rooms (%)
Rooms in owner-occupied houses - 8 rooms (%)
Rooms in owner-occupied houses - 9+ rooms (%)
Rooms in renter-occupied houses - 1 room (%)
Rooms in renter-occupied houses - 2 rooms (%)
Rooms in renter-occupied houses - 3 rooms (%)
Rooms in renter-occupied houses - 4 rooms (%)
Rooms in renter-occupied houses - 5 rooms (%)
Rooms in renter-occupied houses - 6 rooms (%)
Rooms in renter-occupied houses - 7 rooms (%)
Rooms in renter-occupied houses - 8 rooms (%)
Rooms in renter-occupied houses - 9+ rooms (%)
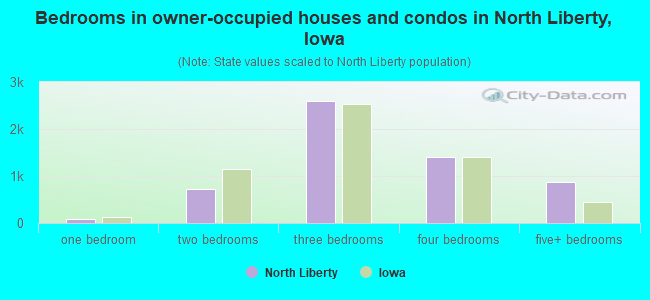
Bedrooms in owner-occupied houses - no bedrooms (%)
Bedrooms in owner-occupied houses - 1 bedroom (%)
Bedrooms in owner-occupied houses - 2 bedrooms (%)
Bedrooms in owner-occupied houses - 3 bedrooms (%)
Bedrooms in owner-occupied houses - 4 bedrooms (%)
Bedrooms in owner-occupied houses - 5+ bedrooms (%)
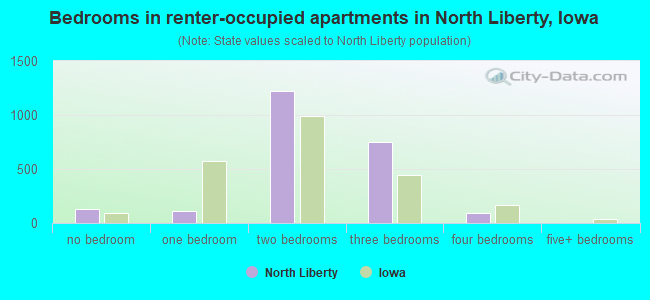
Bedrooms in renter-occupied houses - no bedrooms (%)
Bedrooms in renter-occupied houses - 1 bedroom (%)
Bedrooms in renter-occupied houses - 2 bedrooms (%)
Bedrooms in renter-occupied houses - 3 bedrooms (%)
Bedrooms in renter-occupied houses - 4 bedrooms (%)
Bedrooms in renter-occupied houses - 5+ bedrooms (%)
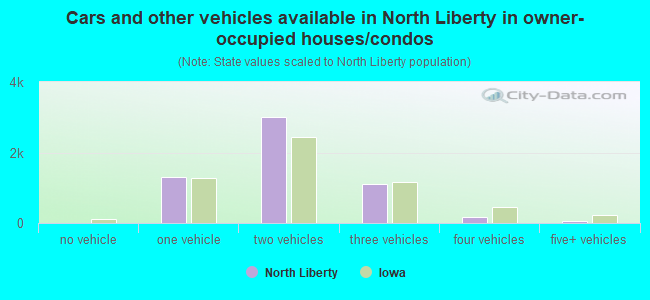
Vehicles available in owner-occupied houses - no vehicle available (%)
Vehicles available in owner-occupied houses - 1 vehicle available(%)
Vehicles available in owner-occupied houses - 2 Vehicles available (%)
Vehicles available in owner-occupied houses - 3 Vehicles available (%)
Vehicles available in owner-occupied houses - 4 Vehicles available (%)
Vehicles available in owner-occupied houses - 5+ Vehicles available (%)
Vehicles available in renter-occupied houses - no vehicle available (%)
Vehicles available in renter-occupied houses - 1 vehicle available (%)
Vehicles available in renter-occupied houses - 2 Vehicles available (%)
Vehicles available in renter-occupied houses - 3 Vehicles available (%)
Vehicles available in renter-occupied houses - 4 Vehicles available (%)
Vehicles available in renter-occupied houses - 5+ Vehicles available (%)
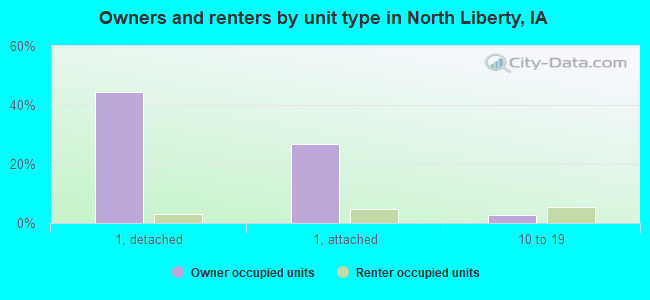
Housing units in structures - 1, detached (%)
Housing units in structures - 1, attached (%)
Housing units in structures - 2 (%)
Housing units in structures - 3 or 4 (%)
Housing units in structures - 5 to 9 (%)
Housing units in structures - 10 to 19 (%)
Housing units in structures - 20 to 49 (%)
Housing units in structures - 50 or more (%)
Housing units in structures - Mobile home (%)
Housing units in structures - Boat, RV, van, etc. (%)
Housing units in structures - Owners - 1, detached (%)
Housing units in structures - Owners - 1, attached (%)
Housing units in structures - Owners - 2 (%)
Housing units in structures - Owners - 3 or 4 (%)
Housing units in structures - Owners - 5 to 9 (%)
Housing units in structures - Owners - 10 to 19 (%)
Housing units in structures - Owners - 20 to 49 (%)
Housing units in structures - Owners - 50 or more (%)
Housing units in structures - Owners - Mobile home (%)
Housing units in structures - Owners - Boat, RV, van, etc. (%)
Housing units in structures - Renters - 1, detached (%)
Housing units in structures - Renters - 1, attached (%)
Housing units in structures - Renters - 2 (%)
Housing units in structures - Renters - 3 or 4 (%)
Housing units in structures - Renters - 5 to 9 (%)
Housing units in structures - Renters - 10 to 19 (%)
Housing units in structures - Renters - 20 to 49 (%)
Housing units in structures - Renters - 50 or more (%)
Housing units in structures - Renters - Mobile home (%)
Housing units in structures - Renters - Boat, RV, van, etc. (%)
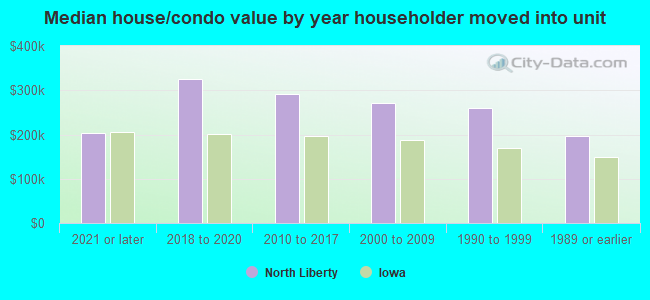
House/condo owner moved in on average (years ago)
Renter moved in on average (years ago)
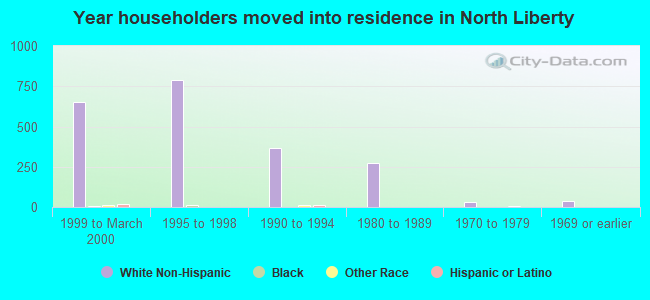
Year householder moved into unit - Moved in 1999 to March 2000 (%)
Year householder moved into unit - Moved in 1999 to March 2000 (%) - White
Year householder moved into unit - Moved in 1999 to March 2000 (%) - Black or African American
Year householder moved into unit - Moved in 1999 to March 2000 (%) - Asian
Year householder moved into unit - Moved in 1999 to March 2000 (%) - Hispanic or Latino
Year householder moved into unit - Moved in 1999 to March 2000 (%) - American Indian and Alaska Native
Year householder moved into unit - Moved in 1999 to March 2000 (%) - Multirace
Year householder moved into unit - Moved in 1999 to March 2000 (%) - Other Race
Year householder moved into unit - Moved in 1995 to 1998 (%)
Year householder moved into unit - Moved in 1995 to 1998 (%) - White
Year householder moved into unit - Moved in 1995 to 1998 (%) - Black or African American
Year householder moved into unit - Moved in 1995 to 1998 (%) - Asian
Year householder moved into unit - Moved in 1995 to 1998 (%) - Hispanic or Latino
Year householder moved into unit - Moved in 1995 to 1998 (%) - American Indian and Alaska Native
Year householder moved into unit - Moved in 1995 to 1998 (%) - Multirace
Year householder moved into unit - Moved in 1995 to 1998 (%) - Other Race
Year householder moved into unit - Moved in 1990 to 1994 (%)
Year householder moved into unit - Moved in 1990 to 1994 (%) - White
Year householder moved into unit - Moved in 1990 to 1994 (%) - Black or African American
Year householder moved into unit - Moved in 1990 to 1994 (%) - Asian
Year householder moved into unit - Moved in 1990 to 1994 (%) - Hispanic or Latino
Year householder moved into unit - Moved in 1990 to 1994 (%) - American Indian and Alaska Native
Year householder moved into unit - Moved in 1990 to 1994 (%) - Multirace
Year householder moved into unit - Moved in 1990 to 1994 (%) - Other Race
Year householder moved into unit - Moved in 1980 to 1989 (%)
Year householder moved into unit - Moved in 1980 to 1989 (%) - White
Year householder moved into unit - Moved in 1980 to 1989 (%) - Black or African American
Year householder moved into unit - Moved in 1980 to 1989 (%) - Asian
Year householder moved into unit - Moved in 1980 to 1989 (%) - Hispanic or Latino
Year householder moved into unit - Moved in 1980 to 1989 (%) - American Indian and Alaska Native
Year householder moved into unit - Moved in 1980 to 1989 (%) - Multirace
Year householder moved into unit - Moved in 1980 to 1989 (%) - Other Race
Year householder moved into unit - Moved in 1970 to 1979 (%)
Year householder moved into unit - Moved in 1970 to 1979 (%) - White
Year householder moved into unit - Moved in 1970 to 1979 (%) - Black or African American
Year householder moved into unit - Moved in 1970 to 1979 (%) - Asian
Year householder moved into unit - Moved in 1970 to 1979 (%) - Hispanic or Latino
Year householder moved into unit - Moved in 1970 to 1979 (%) - American Indian and Alaska Native
Year householder moved into unit - Moved in 1970 to 1979 (%) - Multirace
Year householder moved into unit - Moved in 1970 to 1979 (%) - Other Race
Year householder moved into unit - Moved in 1969 or earlier (%)
Year householder moved into unit - Moved in 1969 or earlier (%) - White
Year householder moved into unit - Moved in 1969 or earlier (%) - Black or African American
Year householder moved into unit - Moved in 1969 or earlier (%) - Asian
Year householder moved into unit - Moved in 1969 or earlier (%) - Hispanic or Latino
Year householder moved into unit - Moved in 1969 or earlier (%) - American Indian and Alaska Native
Year householder moved into unit - Moved in 1969 or earlier (%) - Multirace
Year householder moved into unit - Moved in 1969 or earlier (%) - Other Race
Housing units lacking complete plumbing facilities (%)
Housing units lacking complete kitchen facilities (%)
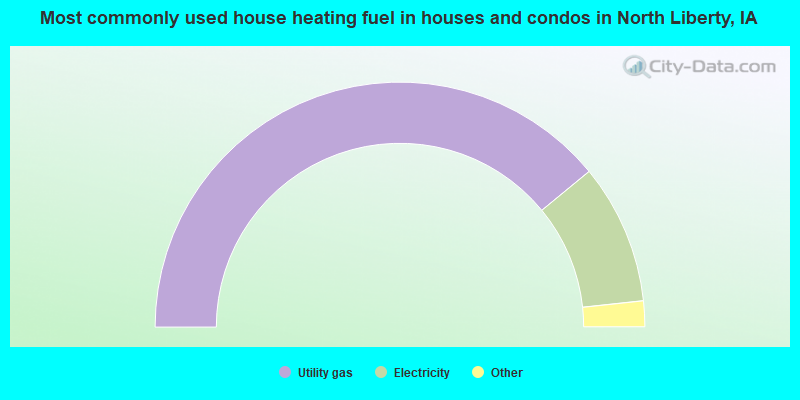
House heating fuel used in houses and condos - Utility gas (%)
House heating fuel used in houses and condos - Bottled, tank, or LP gas (%)
House heating fuel used in houses and condos - Electricity (%)
House heating fuel used in houses and condos - Fuel oil, kerosene, etc. (%)
House heating fuel used in houses and condos - Coal or coke (%)
House heating fuel used in houses and condos - Wood (%)
House heating fuel used in houses and condos - Solar energy (%)
House heating fuel used in houses and condos - Other fuel (%)
House heating fuel used in houses and condos - No fuel used (%)
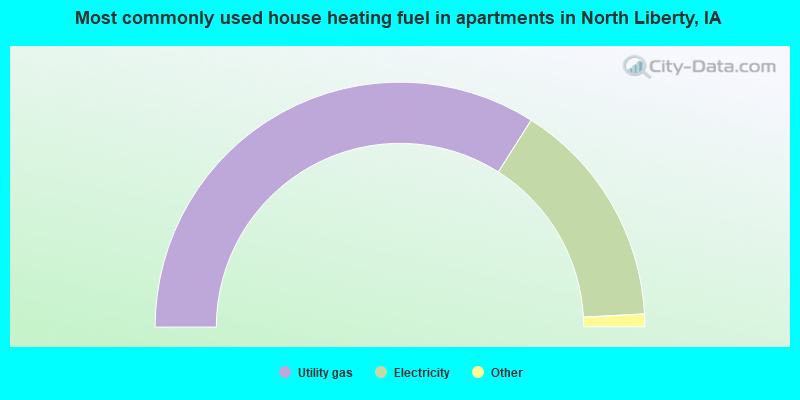
House heating fuel used in apartments - Utility gas (%)
House heating fuel used in apartments - Bottled, tank, or LP gas (%)
House heating fuel used in apartments - Electricity (%)
House heating fuel used in apartments - Fuel oil, kerosene, etc. (%)
House heating fuel used in apartments - Coal or coke (%)
House heating fuel used in apartments - Wood (%)
House heating fuel used in apartments - Solar energy (%)
House heating fuel used in apartments - Other fuel (%)
House heating fuel used in apartments - No fuel used (%)
Median year house/condo built: 2008Median year apartment built: 2007Household type by relationship:
Households: 20,799
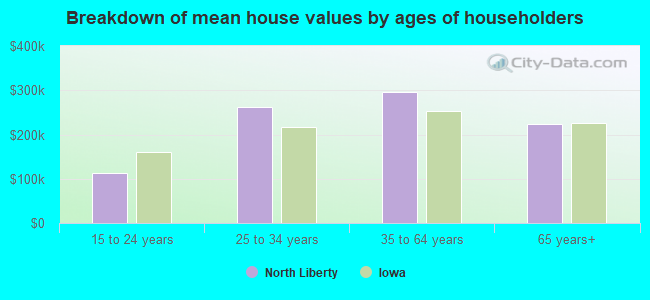
Male householders: 4,172 (812 living alone ), Female householders: 3,723 (834 living alone )4,217 spouses (4,176 opposite-sex spouses ), 966 unmarried partners , (966 opposite-sex unmarried partners ), 6,578 children (6,323 natural , 88 adopted , 166 stepchildren ), 0 grandchildren , 152 brothers or sisters , 127 parents , 0 foster children , 266 other relatives , 531 non-relatives In group quarters: 62
Size of family households: 1,846 2-persons , 1,481 3-persons , 849 4-persons , 420 5-persons , 140 6-persons , 41 7-or-more-persons .
Size of nonfamily households: 1,965 1-person , 939 2-persons , 39 3-persons , 20 4-persons .
4,752 married couples with children. single-parent households (317 men , 565 women ).
88.5% of residents of North Liberty speak English at home. of residents speak Spanish at home (97% speak English very well , 3% speak English not well ).of residents speak other Indo-European language at home (51% speak English very well , 49% speak English not well ).of residents speak Asian or Pacific Island language at home (74% speak English very well , 6% speak English well , 20% speak English not well ).of residents speak other language at home (77% speak English very well , 23% speak English well ).
Foreign born population: 1,610 (7.7%)of them are naturalized citizens )
Median number of rooms in houses and condos:
Median number of rooms in apartments
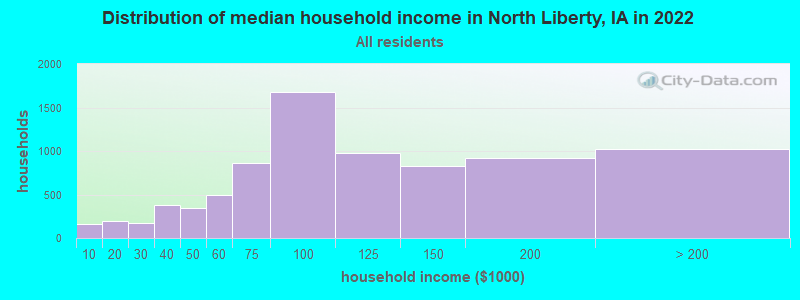
North Liberty, IA household income distribution 156 Less than $10,000191 $10,000 to $19,999177 $20,000 to $29,999376 $30,000 to $39,999350 $40,000 to $49,999494 $50,000 to $59,999862 $60,000 to $74,9991,673 $75,000 to $99,999976 $100,000 to $124,999826 $125,000 to $149,999923 $150,000 to $199,9991,018 $200,000 or more
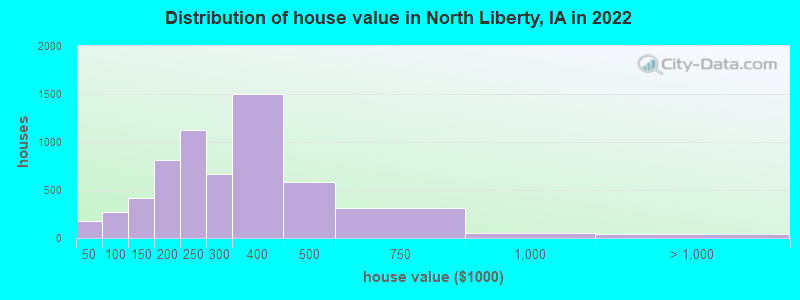
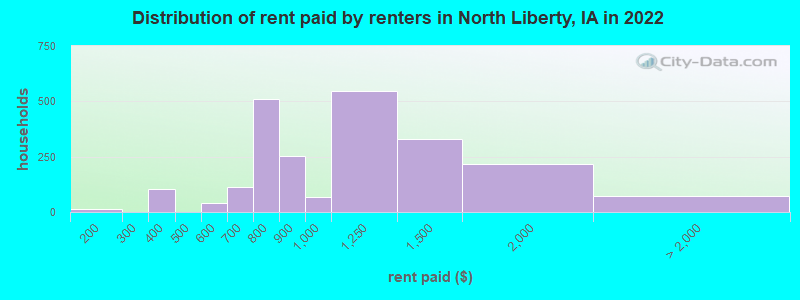
Home value of owner - occupied houses in 2022 in North Liberty, IA 52 Less than $10,00038 $10,000 to $14,99922 $20,000 to $24,99936 $25,000 to $29,99929 $40,000 to $49,999170 $50,000 to $59,99975 $60,000 to $69,999106 $100,000 to $124,999314 $125,000 to $149,999380 $150,000 to $174,999432 $175,000 to $199,9991,123 $200,000 to $249,999666 $250,000 to $299,9991,501 $300,000 to $399,999585 $400,000 to $499,999308 $500,000 to $749,99951 $750,000 to $999,99944 $1,000,000 to $1,499,999Rent paid by renters in 2022 in North Liberty, IA 11 $150 to $19953 $300 to $34952 $350 to $39928 $500 to $54911 $550 to $59984 $600 to $64926 $650 to $69961 $700 to $749448 $750 to $799251 $800 to $89969 $900 to $999547 $1,000 to $1,249331 $1,250 to $1,499219 $1,500 to $1,99924 $2,000 to $2,49928 $3,000 to $3,4998 $3,500 or more10 No cash rent
Percentage of workers working in this county: 83.0%Number of people working at home: 1,726 (14.8% of all workers )
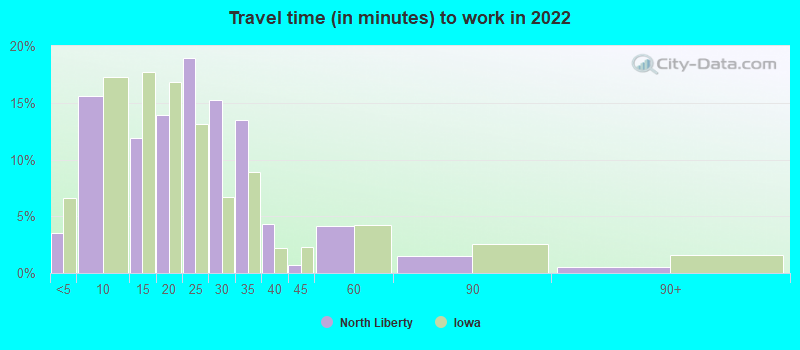
Travel time to work (commute)
Less than 5 minutes: 2685 to 9 minutes: 1,22810 to 14 minutes: 1,15515 to 19 minutes: 1,46220 to 24 minutes: 2,50325 to 29 minutes: 1,33130 to 34 minutes: 95235 to 39 minutes: 40540 to 44 minutes: 30845 to 59 minutes: 38860 to 89 minutes: 18090 or more minutes: 152
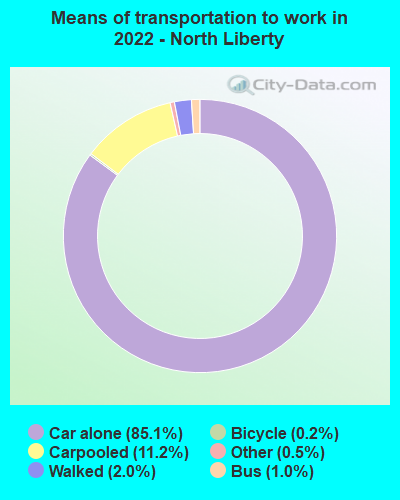
Means of transportation to work:
Drove a car alone: 4,101 (63.7%)Carpooled: 575 (8.9%)Bus : 52 (0.8%)Taxi: 15 (0.2%)Bicycle: 11 (0.2%)Walked: 111 (1.7%)Worked at home: 1,726 (26.8%)
Unemployment by race in 2022
Unemployment rate for White non-Hispanic residents 2.6% FemalesUnemployment rate for Black residents 3.3% MalesUnemployment rate for Hispanic or Latino residents 8.8% Females
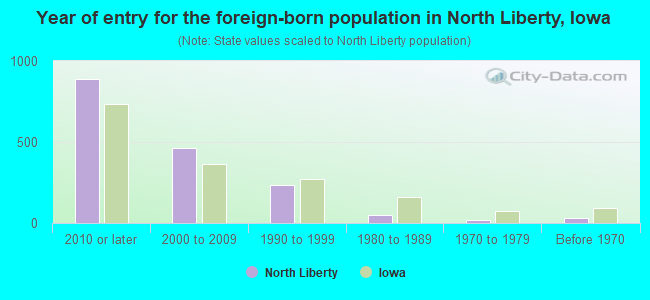
Year of entry for the foreign-born population in North Liberty, Iowa
889 2010 or later 465 2000 to 2009 236 1990 to 1999 51 1980 to 1989 20 1970 to 1979 30 Before 1970
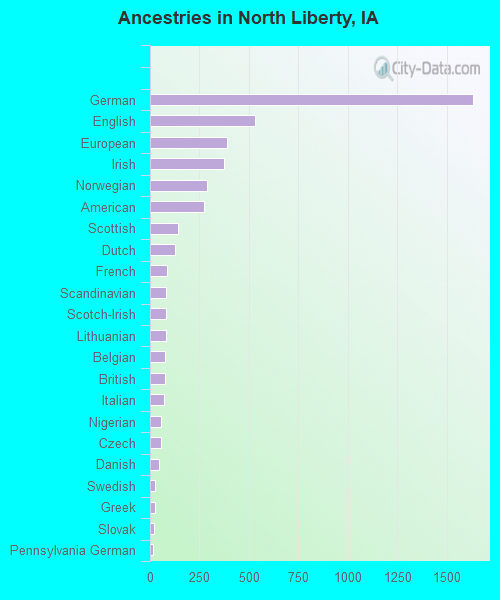
First ancestries reported:
German: 1,631 (24.9%)
English: 530 (8.1%)
European: 390 (6.0%)
Irish: 372 (5.7%)
Norwegian: 289 (4.4%)
American: 273 (4.2%)
Scottish: 140 (2.1%)
Dutch: 125 (1.9%)
French: 87 (1.3%)
Scandinavian: 82 (1.3%)
Scotch-Irish: 80 (1.2%)
Lithuanian: 79 (1.2%)
Belgian: 75 (1.1%)
British: 75 (1.1%)
Italian: 71 (1.1%)
Nigerian: 58 (0.9%)
Czech: 57 (0.9%)
Danish: 45 (0.7%)
Swedish: 24 (0.4%)
Greek: 23 (0.4%)
Slovak: 18 (0.3%)
Pennsylvania German: 15 (0.2%)
Latvian: 12 (0.2%)
African: 11 (0.2%)
Welsh: 9 (0.1%) Most common places of birth for foreign-born residents (%): Democratic Republic of Congo (Zaire) North Liberty:
26.4% (461)Iowa:
2.1% (3,735)
Canada North Liberty:
13.8% (240)Iowa:
1.6% (2,873)
Korea North Liberty:
11.4% (198)Iowa:
2.9% (5,155)
India North Liberty:
11.1% (193)Iowa:
6.2% (11,148)
Mexico North Liberty:
10.2% (178)Iowa:
23.3% (41,625)
Brazil North Liberty:
6.2% (108)Iowa:
0.7% (1,326)
Colombia North Liberty:
4.1% (71)Iowa:
0.7% (1,227)
Cambodia North Liberty:
3.1% (54)Iowa:
0.2% (441)
China, excluding Hong Kong and Taiwan North Liberty:
2.9% (50)Iowa:
4.6% (8,194)
Vietnam North Liberty:
2.5% (43)Iowa:
4.2% (7,428)
Taiwan North Liberty:
1.5% (27)Iowa:
0.2% (435)
Place of birth for U.S.-born residents:
This state: 13,358Other state: 5,958Northeast: 505Midwest: 3,321South: 1,156West: 920 82.8% of North Liberty residents lived in the same house 1 years ago.
Out of people who lived in different houses, 26.5% lived in this county.
Out of people who lived in different counties, 58.3% lived in Iowa.
North Liberty:
82.8%State average:
87.2%
Education attainment for males 25 years and older:
No schooling: 0Nursery to 4th grade: 85th and 6th grade: 07th and 8th grade: 09th grade: 010th grade: 011th grade: 1012th grade, no diploma: 86High school graduate (or equivalency): 776Less than 1 year of college: 324Some college more than 1 year, no degree: 742Associate degree: 626Bachelor's degree: 2,299Master's degree: 1,092Professional school degree: 405Doctorate degree: 290
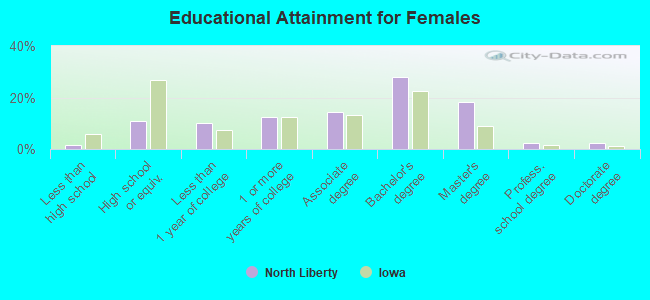
Education attainment for females 25 years and older:
No schooling: 50Nursery to 4th grade: 05th and 6th grade: 07th and 8th grade: 09th grade: 3510th grade: 2411th grade: 012th grade, no diploma: 0High school graduate (or equivalency): 709Less than 1 year of college: 660Some college more than 1 year, no degree: 823Associate degree: 951Bachelor's degree: 1,862Master's degree: 1,196Professional school degree: 143Doctorate degree: 166
Housing units in structures:
One, detached: 4,340One, attached: 2,053Two: 1793 or 4: 1285 to 9: 38910 to 19: 77420 to 49: 6750 or more: 199Mobile homes: 434Housing units lacking complete plumbing facilities in 2022: 1.4%Housing units lacking complete kitchen facilities in 2022: 2.5%Private vs. public school enrollment:
Students in private schools in grades 1 to 8 (elementary and middle school): 162 Students in private schools in grades 9 to 12 (high school): 5 Students in private undergraduate colleges: 440