Housing density: 2,574 houses/condos per square mile
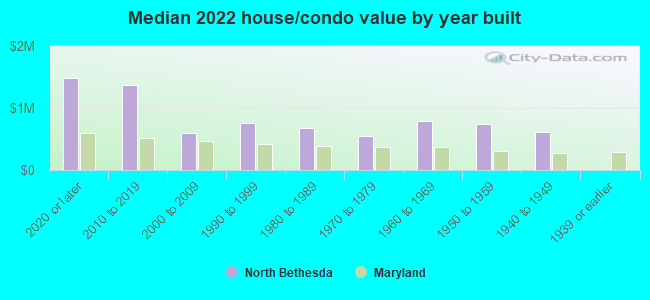
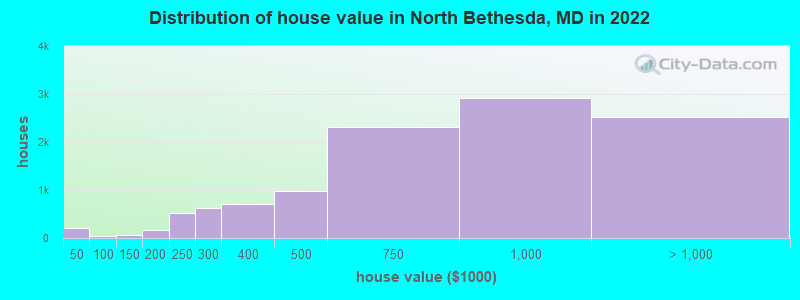
Median price asked for vacant for-sale houses and condos in 2022: $647,794.
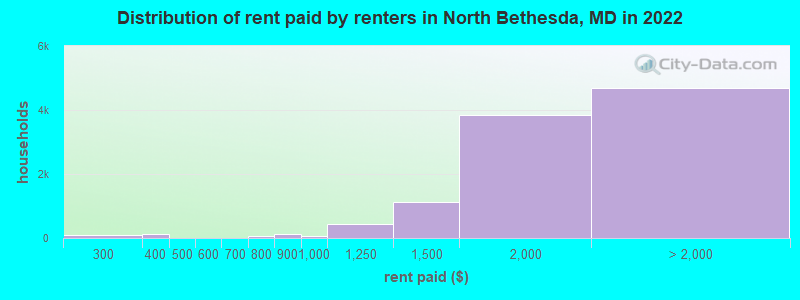
Median contract rent in 2022: $1,908 (lower quartile is $1,550, upper quartile is over $2,000)
Median rent asked for vacant for-rent units in 2022: $2,006
Median gross rent in North Bethesda, MD in 2022: over $2,000
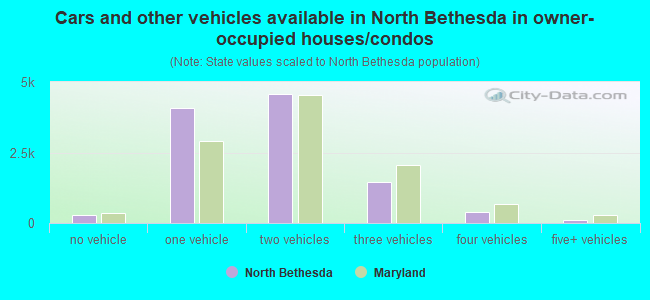
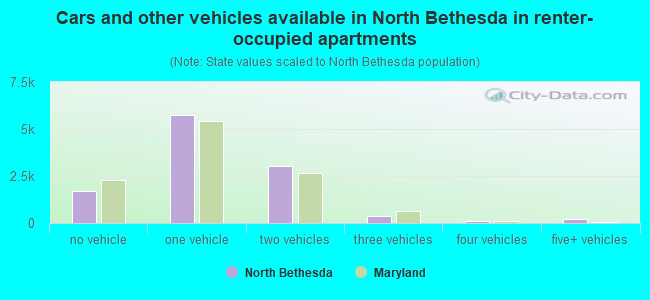
Housing units in North Bethesda with a mortgage: 6,744 (548 second mortgage, 6 home equity loan, 446 both second mortgage and home equity loan) Houses without a mortgage: 216
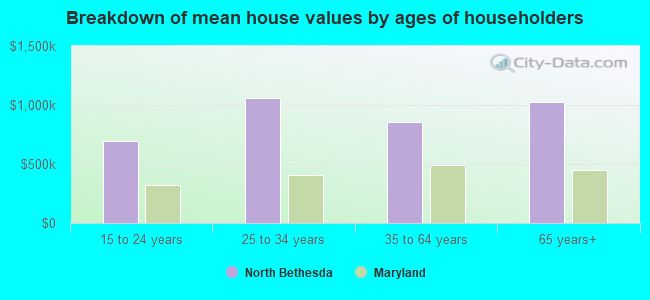
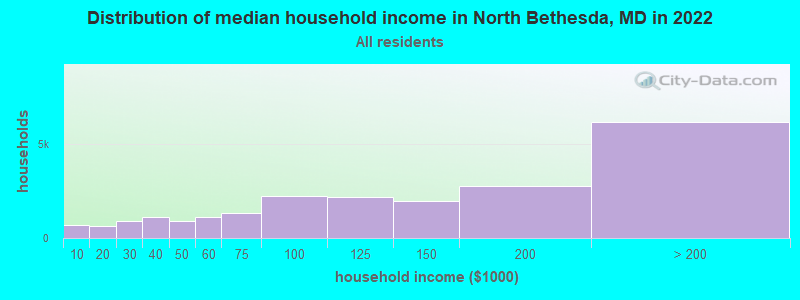
Median household income for houses/condos with a mortgage: $193,215
Median household income for apartments without a mortgage: $138,035
Median monthly housing costs: $2,010
Compare current foreclosures near North Bethesda, MD:
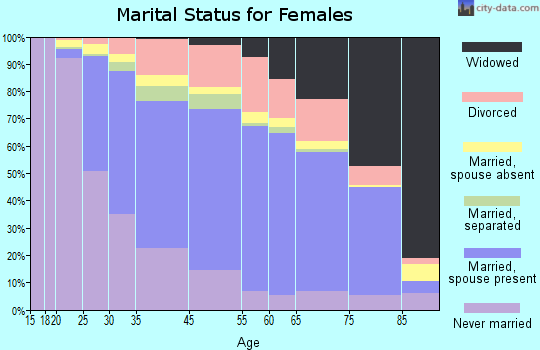
6,824 married couples with children.
1,916 single-parent households (397 men, 1,519 women).
61.4% of residents of North Bethesda speak English at home.
12.8% of residents speak Spanish at home (62% speak English very well, 16% speak English well, 16% speak English not well, 7% don't speak English at all).
12.2% of residents speak other Indo-European language at home (75% speak English very well, 16% speak English well, 9% speak English not well).
9.5% of residents speak Asian or Pacific Island language at home (56% speak English very well, 33% speak English well, 10% speak English not well, 2% don't speak English at all).
3.6% of residents speak other language at home (89% speak English very well, 9% speak English well, 2% speak English not well).
Foreign born population: 16,308 (32.9%)
(55.0% of them are naturalized citizens)
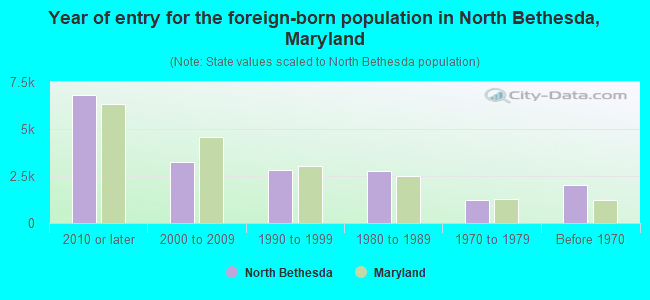
Year of entry for the foreign-born population in North Bethesda, Maryland
6,8062010 or later
3,2422000 to 2009
2,8251990 to 1999
2,7681980 to 1989
1,2261970 to 1979
2,020Before 1970
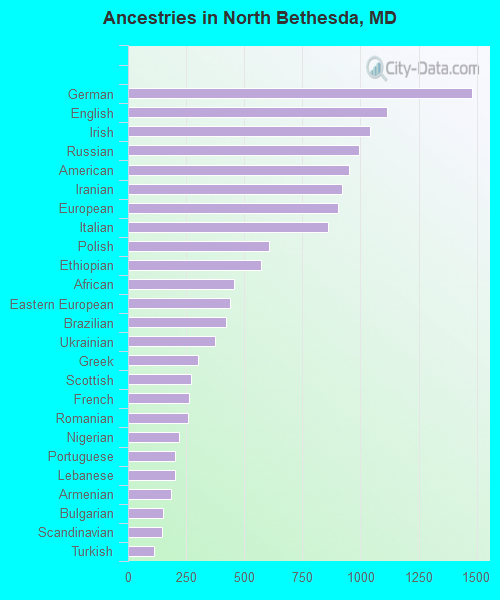
First ancestries reported:
German: 1,479 (4.9%)
English: 1,113 (3.7%)
Irish: 1,041 (3.5%)
Russian: 993 (3.3%)
American: 952 (3.2%)
Iranian: 922 (3.1%)
European: 904 (3.0%)
Italian: 859 (2.9%)
Polish: 605 (2.0%)
Ethiopian: 573 (1.9%)
African: 458 (1.5%)
Eastern European: 437 (1.5%)
Brazilian: 421 (1.4%)
Ukrainian: 374 (1.2%)
Greek: 299 (1.0%)
Scottish: 270 (0.9%)
French: 263 (0.9%)
Romanian: 257 (0.9%)
Nigerian: 218 (0.7%)
Portuguese: 204 (0.7%)
Lebanese: 201 (0.7%)
Armenian: 186 (0.6%)
Bulgarian: 151 (0.5%)
Scandinavian: 148 (0.5%)
Turkish: 110 (0.4%)
Slovak: 92 (0.3%)
Jamaican: 92 (0.3%)
Egyptian: 90 (0.3%)
British: 90 (0.3%)
Iraqi: 82 (0.3%)
Scotch-Irish: 79 (0.3%)
Dutch: 72 (0.2%)
Austrian: 70 (0.2%)
Sudanese: 70 (0.2%)
Lithuanian: 68 (0.2%)
Finnish: 65 (0.2%)
Israeli: 57 (0.2%)
Hungarian: 57 (0.2%)
Welsh: 53 (0.2%)
Trinidadian and Tobagonian: 52 (0.2%)
Serbian: 47 (0.2%)
Swedish: 47 (0.2%)
Croatian: 45 (0.2%)
Arab: 44 (0.1%)
Northern European: 37 (0.1%)
Ghanaian: 37 (0.1%)
Jordanian: 28 (0.09%)
Zimbabwean: 28 (0.09%)
Haitian: 28 (0.09%)
Czech: 24 (0.08%)
Norwegian: 24 (0.08%)
Moroccan: 21 (0.07%)
Slavic: 21 (0.07%)
French Canadian: 20 (0.07%)
Latvian: 19 (0.06%)
Kenyan: 16 (0.05%)
Albanian: 16 (0.05%)
Bahamian: 16 (0.05%)
Belgian: 15 (0.05%)
West Indian: 13 (0.04%)
Czechoslovakian: 10 (0.03%)
U.S. Virgin Islander: 9 (0.03%)
Syrian: 8 (0.03%)
Danish: 8 (0.03%)
Palestinian: 7 (0.02%)
Guyanese: 7 (0.02%)
Swiss: 6 (0.02%)
Senegalese: 6 (0.02%)
Canadian: 2 (0.01%)
Most common places of birth for foreign-born residents (%):
El Salvador
North Bethesda:
5.8% (951)
Maryland:
12.0% (115,412)
China, excluding Hong Kong and Taiwan
North Bethesda:
5.2% (844)
Maryland:
4.6% (44,742)
Iran
North Bethesda:
5.1% (837)
Maryland:
1.3% (12,074)
India
North Bethesda:
5.0% (809)
Maryland:
6.4% (61,725)
Philippines
North Bethesda:
4.7% (771)
Maryland:
3.8% (36,698)
Korea
North Bethesda:
4.5% (741)
Maryland:
3.4% (32,635)
Japan
North Bethesda:
4.5% (736)
Maryland:
0.5% (4,995)
Russia
North Bethesda:
3.9% (638)
Maryland:
1.0% (9,481)
Honduras
North Bethesda:
3.8% (618)
Maryland:
2.5% (24,026)
Brazil
North Bethesda:
3.1% (503)
Maryland:
1.2% (11,980)
Bolivia
North Bethesda:
3.1% (503)
Maryland:
0.7% (7,000)
Moldova
North Bethesda:
2.7% (443)
Maryland:
0.1% (767)
Ethiopia
North Bethesda:
2.4% (393)
Maryland:
3.2% (30,870)
Taiwan
North Bethesda:
2.4% (392)
Maryland:
0.9% (8,520)
Peru
North Bethesda:
2.1% (339)
Maryland:
1.8% (17,161)
Ukraine
North Bethesda:
2.0% (333)
Maryland:
0.7% (6,326)
Germany
North Bethesda:
1.8% (289)
Maryland:
1.2% (11,265)
France
North Bethesda:
1.8% (286)
Maryland:
0.4% (4,217)
Other Eastern Europe
North Bethesda:
1.7% (284)
Maryland:
0.3% (3,199)
Bangladesh
North Bethesda:
1.7% (280)
Maryland:
0.7% (7,124)
Vietnam
North Bethesda:
1.6% (262)
Maryland:
1.9% (18,716)
Place of birth for U.S.-born residents:
This state: 10,167
Other state: 21,930
Northeast: 6,742
Midwest: 2,611
South: 10,081
West: 2,491
83.5% of North Bethesda residents lived in the same house 1 years ago. Out of people who lived in different houses, 33.4% lived in this county. Out of people who lived in different counties, 28.2% lived in Maryland.
North Bethesda:
83.5%
State average:
88.5%
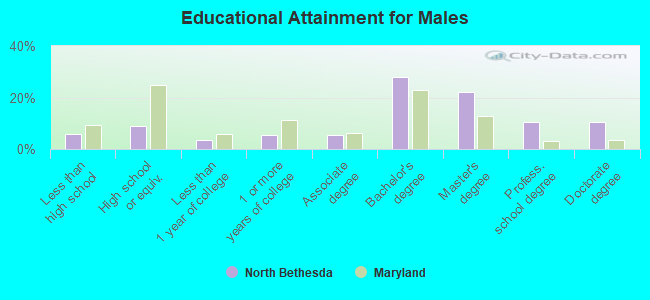
Education attainment for males 25 years and older:
No schooling: 525
Nursery to 4th grade: 60
5th and 6th grade: 59
7th and 8th grade: 59
9th grade: 117
10th grade: 24
11th grade: 95
12th grade, no diploma: 92
High school graduate (or equivalency): 1,581
Less than 1 year of college: 582
Some college more than 1 year, no degree: 960
Associate degree: 923
Bachelor's degree: 4,857
Master's degree: 3,877
Professional school degree: 1,856
Doctorate degree: 1,824
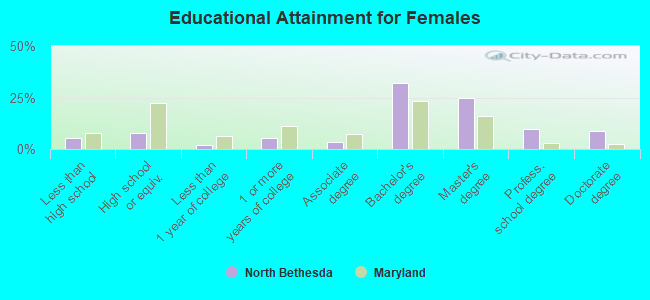
Education attainment for females 25 years and older:
No schooling: 333
Nursery to 4th grade: 22
5th and 6th grade: 98
7th and 8th grade: 38
9th grade: 44
10th grade: 20
11th grade: 171
12th grade, no diploma: 335
High school graduate (or equivalency): 1,548
Less than 1 year of college: 410
Some college more than 1 year, no degree: 1,007
Associate degree: 698
Bachelor's degree: 6,217
Master's degree: 4,836
Professional school degree: 1,895
Doctorate degree: 1,737
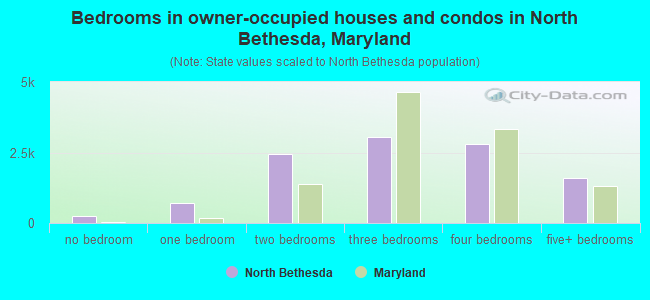
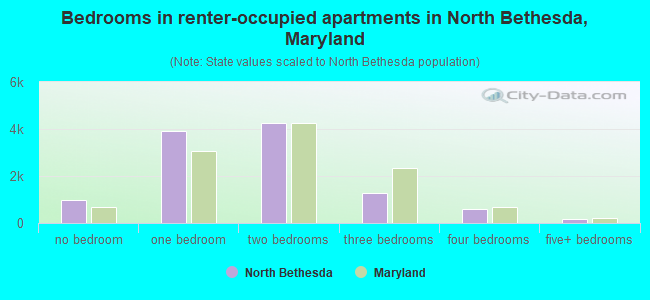
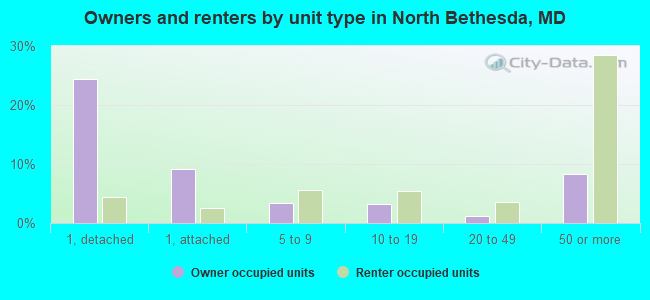
Housing units in structures:
One, detached: 6,776
One, attached: 2,618
Two: 97
3 or 4: 271
5 to 9: 1,870
10 to 19: 2,034
20 to 49: 1,172
50 or more: 8,358
Mobile homes: 9
Housing units lacking complete plumbing facilities in 2022: 0.2%
Housing units lacking complete kitchen facilities in 2022: 0.4%
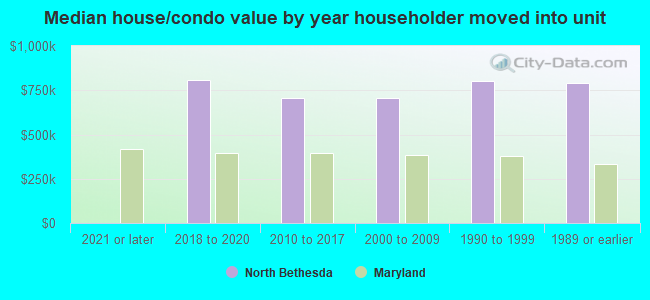
House/condo owner moved in on average 10 years ago