Mitchellville, MD (Maryland) Houses and Residents
| Mitchellville: | $493,932 |
| Maryland: | $398,100 |
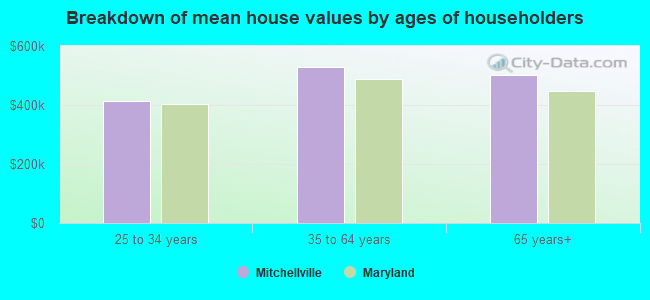
Mean price in 2022:
Detached houses: $512,799
Here: $512,799 State: $526,819 Townhouses or other attached units: $317,782
Here: $317,782 State: $328,305 In 3-to-4-unit structures: $264,887
Here: $264,887 State: $295,378 In 5-or-more-unit structures: $207,150
Here: $207,150 State: $350,378
Total population: 10,967 (Urban population: 9,638, Rural population: 0)
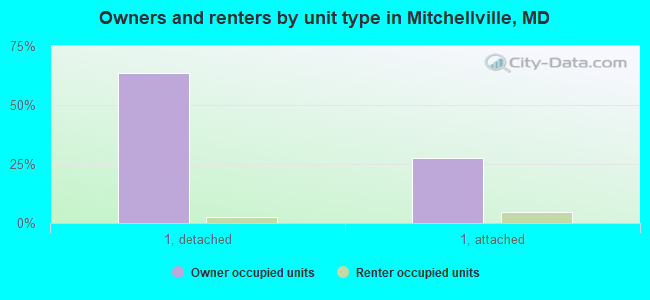
Houses: 4,256 (4,058 occupied: 3,848 owner occupied, 229 renter occupied)
| % of renters here: | 6% |
| State: | 32% |
Housing density: 855 houses/condos per square mile
Median price asked for vacant for-sale houses and condos in 2022 in this county: $422,373.
Median contract rent in 2022: $1,762 (lower quartile is $1,565, upper quartile is over $2,000)
Median rent asked for vacant for-rent units in 2022: $2,109
Median gross rent in Mitchellville, MD in 2022: $1,959
Housing units in Mitchellville with a mortgage: 3,179 (355 second mortgage, 34 home equity loan, 287 both second mortgage and home equity loan)
Houses without a mortgage: 55
Median household income for houses/condos with a mortgage: $154,675
Median household income for apartments without a mortgage: $104,098
Median monthly housing costs: $2,385
Compare current foreclosures near Mitchellville, MD:
| Photo | Address | Area | Beds / Baths | Price | Details |
|---|---|---|---|---|---|

|
#1
Crafford Pl
Fort Washington, MD 20744
|
1,890 sq. feet
|
1 baths 3 beds |
$265,900
|
show details |

|
#2
17th St NW Apt 504
Washington, DC 20009
|
800 sq. feet
|
1 baths 1 beds |
$405,000
|
show details |

|
#3
Pickett Dr
Suitland, MD 20746
|
1,296 sq. feet
|
1 baths 2 beds |
$335,000
|
show details |

|
#4
Applegarth Pl
Capitol Heights, MD 20743
|
1,200 sq. feet
|
1 baths 3 beds |
$314,900
|
show details |

|
#5
Eastern Ave NE
Washington, DC 20011
|
1,024 sq. feet
|
1 baths 3 beds |
$395,000
|
show details |

|
#6
Elkhorn Ln
Bowie, MD 20716
|
1,514 sq. feet
|
2 baths 3 beds |
$415,000
|
show details |

|
#7
Hammersmith Cir
Silver Spring, MD 20906
|
1,152 sq. feet
|
1 baths 3 beds |
$328,600
|
show details |

|
#8
Mandan Rd Apt 103 Unit 621
Greenbelt, MD 20770
|
1,420 sq. feet
|
2 baths 3 beds |
$179,900
|
show details |

|
#9
Bay Ridge Rd
Edgewater, MD 21037
|
2,951 sq. feet
|
3 baths 3 beds |
$615,000
|
show details |

|
#10
19th St NW
Washington, DC 20036
|
2,515 sq. feet
|
6 baths 8 beds |
$1,574,900
|
show details |
| Photo | Address | Area | Beds / Baths | Price | Details |
|---|---|---|---|---|---|

|
#11
Pooks Hill Rd Apt 1612s
Bethesda, MD 20814
|
1,250 sq. feet
|
1 baths 2 beds |
$289,000
|
show details |

|
#12
Henson Ln
Temple Hills, MD 20748
|
1,566 sq. feet
|
2 baths 3 beds |
$300,000
|
show details |

|
#13
Carousel Ct
Upper Marlboro, MD 20772
|
2,112 sq. feet
|
2 baths 3 beds |
$385,000
|
show details |

|
#14
Fitzgibbon Ct
Bowie, MD 20721
|
1,300 sq. feet
|
2 baths 3 beds |
$369,200
|
show details |

|
#15
Monroe St NW
Washington, DC 20010
|
- sq. feet
|
2 baths 2 beds |
$665,000
|
show details |

|
#16
Sand Cherry Way
Clinton, MD 20735
|
3,328 sq. feet
|
2 baths 5 beds |
$613,600
|
show details |

|
#17
Heming Ln
Bowie, MD 20716
|
1,800 sq. feet
|
2 baths 3 beds |
$400,000
|
show details |

|
#18
3rd St
Lanham, MD 20706
|
1,104 sq. feet
|
2 baths 3 beds |
$369,200
|
show details |

|
#19
Cathedral Ave NW Apt 108
Washington, DC 20016
|
765 sq. feet
|
1 baths 1 beds |
$269,900
|
show details |

|
#20
Addison Rd
Capitol Heights, MD 20743
|
1,400 sq. feet
|
1 baths 3 beds |
$260,000
|
show details |
| Photo | Address | Area | Beds / Baths | Price | Details |
|---|---|---|---|---|---|

|
#21
Buchanan St NE
Washington, DC 20017
|
1,240 sq. feet
|
2 baths 3 beds |
$325,000
|
show details |

|
#22
Rolling Meadows Rd
Upper Marlboro, MD 20772
|
2,459 sq. feet
|
2 baths 3 beds |
$405,000
|
show details |

|
#23
Delaware Ave SW Apt N720
Washington, DC 20024
|
- sq. feet
|
1 baths 1 beds |
$149,900
|
show details |

|
#24
T St SE Apt 3
Washington, DC 20020
|
- sq. feet
|
2 baths 4 beds |
$307,500
|
show details |

|
#25
Wilson Bridge Dr Unit #6770 A-2
Oxon Hill, MD 20745
|
- sq. feet
|
1 baths 1 beds |
$99,750
|
show details |

|
#26
Brooke Ln
Upper Marlboro, MD 20772
|
- sq. feet
|
5 baths 6 beds |
$949,000
|
show details |

|
#27
Oakwood St SE Apt B5
Washington, DC 20032
|
628 sq. feet
|
1 baths 1 beds |
show details | |

|
#28
Holbrook Ter NE
Washington, DC 20002
|
3,164 sq. feet
|
4 baths 8 beds |
show details | |

|
#29
Oakland Mills Rd
Columbia, MD 21046
|
- sq. feet
|
3 baths 4 beds |
show details | |

|
#30
K St NW
Washington, DC 20001
|
1,360 sq. feet
|
3 baths 4 beds |
show details |
| Photo | Address | Area | Beds / Baths | Price | Details |
|---|---|---|---|---|---|

|
#31
G St SE
Washington, DC 20019
|
832 sq. feet
|
1 baths 3 beds |
show details | |

|
#32
Kennedy St NW
Washington, DC 20011
|
1,520 sq. feet
|
1 baths 4 beds |
show details | |

|
#33
Lamont St NW
Washington, DC 20010
|
2,718 sq. feet
|
3 baths 6 beds |
show details | |

|
#34
H St SE
Washington, DC 20019
|
1,064 sq. feet
|
1 baths 3 beds |
show details | |

|
#35
Shepherd St NW
Washington, DC 20011
|
1,330 sq. feet
|
2 baths 2 beds |
show details | |

|
#36
Half St SW
Washington, DC 20024
|
1,280 sq. feet
|
1 baths 2 beds |
show details | |

|
#37
Alabama Ave SE
Washington, DC 20020
|
1,152 sq. feet
|
2 baths 3 beds |
show details | |

|
#38
Ripon Pl
Upper Marlboro, MD 20772
|
1,080 sq. feet
|
3 baths 3 beds |
show details | |

|
#39
Monroe St NW
Washington, DC 20010
|
2,639 sq. feet
|
4 baths 8 beds |
show details | |

|
#40
Weather Worn Way Unit B
Columbia, MD 21046
|
1,146 sq. feet
|
2 baths - beds |
show details |
| Photo | Address | Area | Beds / Baths | Price | Details |
|---|---|---|---|---|---|

|
#41
Ely Pl SE
Washington, DC 20019
|
3,796 sq. feet
|
4 baths 8 beds |
show details | |

|
#42
11th St NW
Washington, DC 20001
|
1,698 sq. feet
|
1 baths 3 beds |
show details | |

|
#43
E St NW Apt 1022
Washington, DC 20004
|
822 sq. feet
|
1 baths 1 beds |
show details | |

|
#44
E St NW Apt 230
Washington, DC 20004
|
861 sq. feet
|
1 baths 1 beds |
show details | |

|
#45
Navahoe St
Hyattsville, MD 20783
|
1,068 sq. feet
|
2 baths 3 beds |
show details | |

|
#46
Delafield Pl NW
Washington, DC 20011
|
1,743 sq. feet
|
2 baths 4 beds |
show details | |

|
#47
Southern Ave SE
Washington, DC 20019
|
1,492 sq. feet
|
1 baths 3 beds |
show details | |

|
#48
Alaska Ave NW Apt 201
Washington, DC 20012
|
865 sq. feet
|
2 baths 2 beds |
show details | |

|
#49
Corcoran St NW # 1
Washington, DC 20009
|
1,771 sq. feet
|
3 baths 2 beds |
show details | |

|
Check over 1 million property listings on Foreclosure.com!
|
browse all offers | |||

Latest news about housing in Mitchellville, MD collected exclusively by city-data.com from local newspapers, TV, and radio stations


Median year apartment built: 1991
Household type by relationship:
Households: 11,973- Male householders: 1,600 (183 living alone), Female householders: 2,361 (451 living alone)
2,247 spouses (2,247 opposite-sex spouses), 85 unmarried partners, (85 opposite-sex unmarried partners), 3,635 children (3,439 natural, 105 adopted, 90 stepchildren), 355 grandchildren, 478 brothers or sisters, 341 parents, 0 foster children, 471 other relatives, 294 non-relatives
- In group quarters: 100
Size of family households: 1,096 2-persons, 908 3-persons, 890 4-persons, 323 5-persons, 75 6-persons, 86 7-or-more-persons.
Size of nonfamily households: 624 1-person, 114 2-persons.
1,233 married couples with children.
391 single-parent households (84 men, 307 women).
84.1% of residents of Mitchellville speak English at home.
2.1% of residents speak Spanish at home (61% speak English very well, 35% speak English well, 4% speak English not well).
4.7% of residents speak other Indo-European language at home (66% speak English very well, 23% speak English well, 1% speak English not well, 11% don't speak English at all).
1.2% of residents speak Asian or Pacific Island language at home (90% speak English very well, 10% speak English well).
7.7% of residents speak other language at home (91% speak English very well, 6% speak English well, 1% speak English not well, 3% don't speak English at all).
Foreign born population: 2,304 (19.2%)
(78.0% of them are naturalized citizens)
| Here: | 9.7 |
| State: | 7.3 |
| Here: | 7.2 |
| State: | 4.2 |
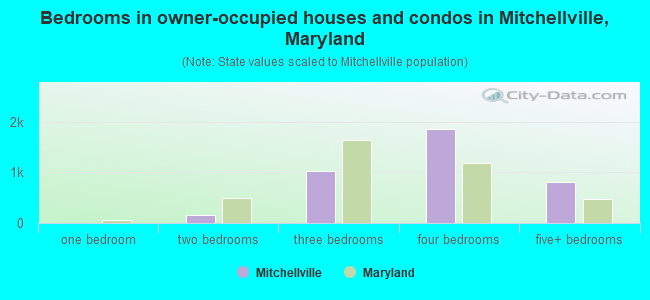
- Bedrooms in owner-occupied houses and condos in Mitchellville, Maryland
- 7no bedroom
- 01 bedroom
- 1602 bedrooms
- 1,0193 bedrooms
- 1,8584 bedrooms
- 8045+ bedrooms

- Bedrooms in renter-occupied apartments in Mitchellville, Maryland
- 0no bedroom
- 131 bedroom
- 102 bedrooms
- 1203 bedrooms
- 774 bedrooms
- 85+ bedrooms
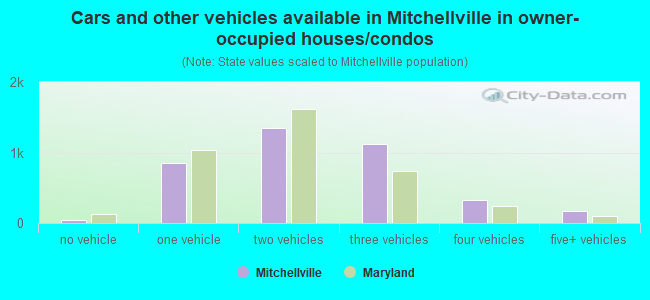
- Cars and other vehicles available in Mitchellville in owner-occupied houses/condos
- 41no vehicle
- 8511 vehicle
- 1,3452 vehicles
- 1,1213 vehicles
- 3254 vehicles
- 1665+ vehicles
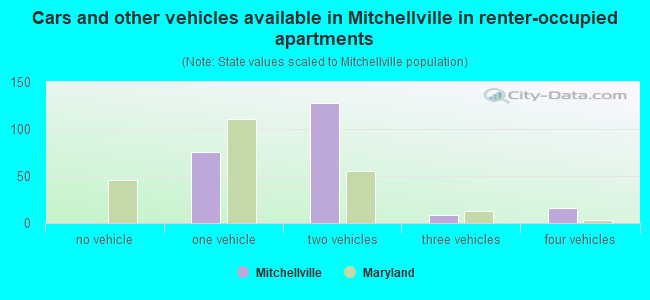
- Cars and other vehicles available in Mitchellville in renter-occupied apartments
- 0no vehicle
- 761 vehicle
- 1282 vehicles
- 83 vehicles
- 164 vehicles
- 05+ vehicles
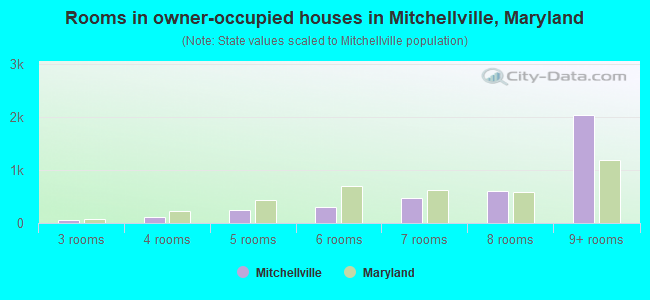
- Rooms in owner-occupied houses in Mitchellville, Maryland
- 71 room
- 02 rooms
- 633 rooms
- 1204 rooms
- 2535 rooms
- 3086 rooms
- 4667 rooms
- 5958 rooms
- 2,0359+ rooms
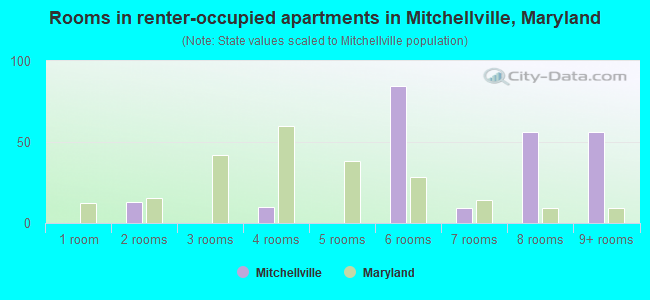
- Rooms in renter-occupied apartments in Mitchellville, Maryland
- 01 room
- 132 rooms
- 03 rooms
- 104 rooms
- 05 rooms
- 846 rooms
- 97 rooms
- 568 rooms
- 569+ rooms


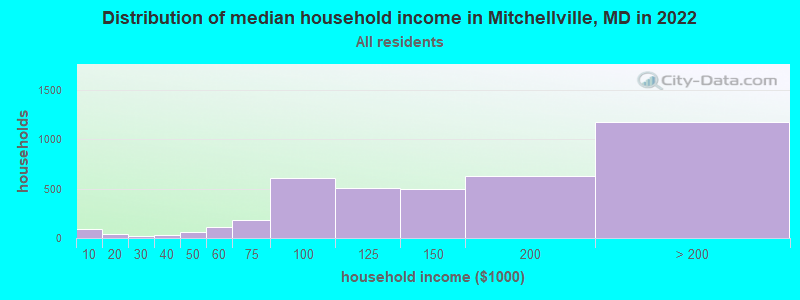
Mitchellville, MD household income distribution

- 89Less than $10,000
- 41$10,000 to $19,999
- 23$20,000 to $29,999
- 30$30,000 to $39,999
- 61$40,000 to $49,999
- 114$50,000 to $59,999
- 184$60,000 to $74,999
- 610$75,000 to $99,999
- 501$100,000 to $124,999
- 498$125,000 to $149,999
- 628$150,000 to $199,999
- 1,173$200,000 or more
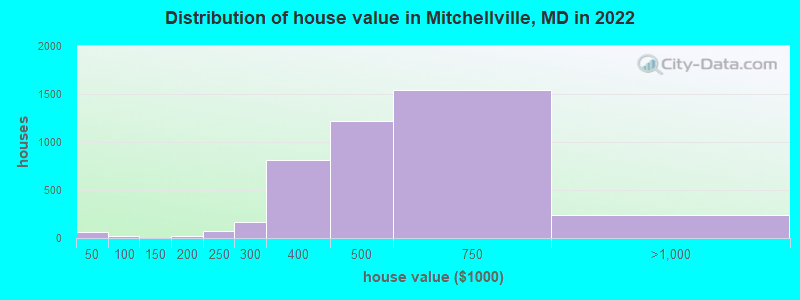
Home value of owner - occupied houses in 2022 in Mitchellville, MD
-
- 32Less than $10,000
- 12$30,000 to $34,999
- 21$40,000 to $49,999
- 16$150,000 to $174,999
- 75$200,000 to $249,999
- 163$250,000 to $299,999
- 812$300,000 to $399,999
- 1,217$400,000 to $499,999
- 1,542$500,000 to $749,999
- 216$750,000 to $999,999
- 21$2,000,000 or more
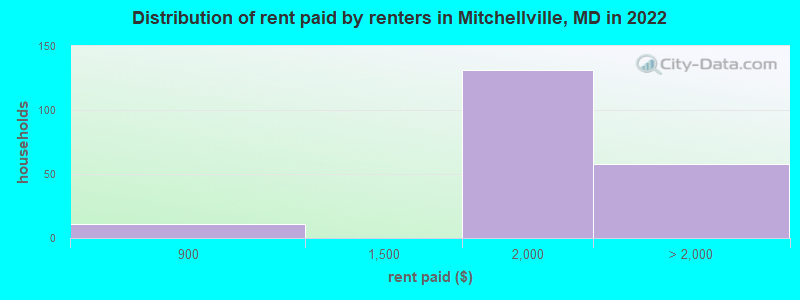
Rent paid by renters in 2022 in Mitchellville, MD
-
- 10$800 to $899
- 130$1,500 to $1,999
- 46$2,000 to $2,499
- 11$2,500 to $2,999
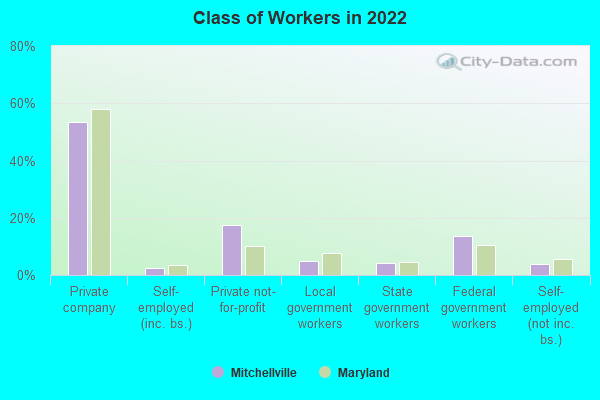
Percentage of workers working in this county: 51.7%
Number of people working at home: 1,243 (20.1% of all workers)
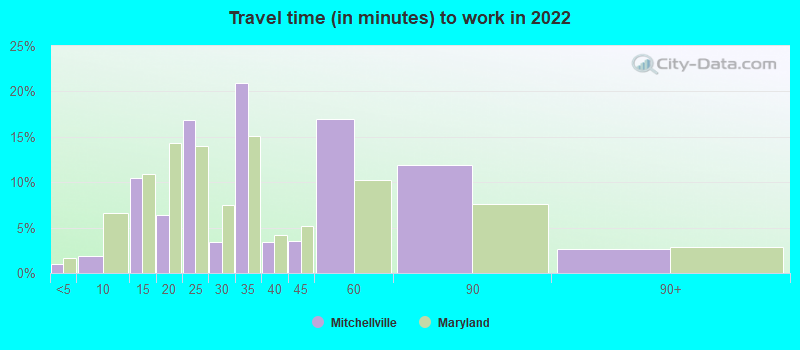
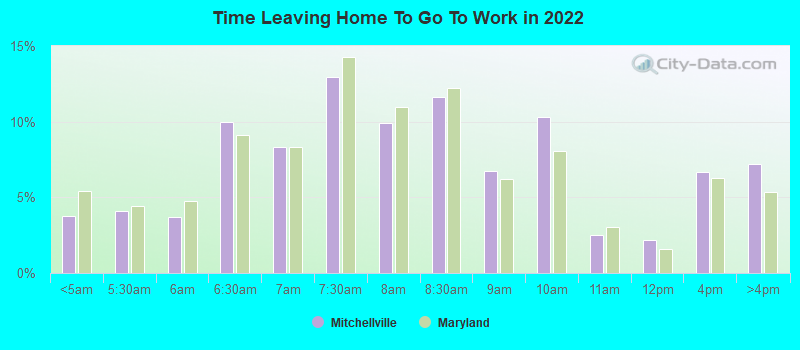
Travel time to work (commute)
- Less than 5 minutes: 80
- 5 to 9 minutes: 24
- 10 to 14 minutes: 534
- 15 to 19 minutes: 493
- 20 to 24 minutes: 475
- 25 to 29 minutes: 246
- 30 to 34 minutes: 948
- 35 to 39 minutes: 268
- 40 to 44 minutes: 308
- 45 to 59 minutes: 902
- 60 to 89 minutes: 576
- 90 or more minutes: 149
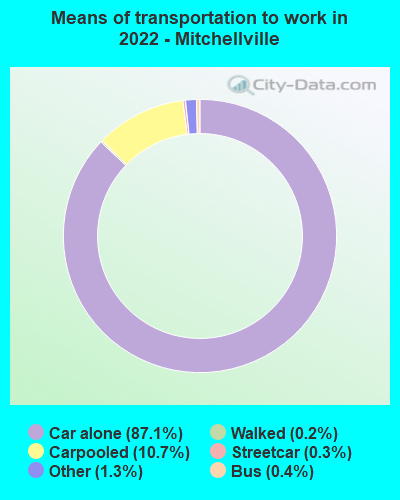
Means of transportation to work:
- Drove a car alone: 3,983 (69.1%)
- Carpooled: 445 (7.7%)
- Bus: 11 (0.2%)
- Subway or elevated rail: 10 (0.2%)
- Taxi: 75 (1.3%)
- Walked: 8 (0.1%)
- Worked at home: 1,243 (21.6%)
- Unemployment by race in 2022
- Unemployment rate for Black residents
- 8.8%Males
- 5.5%Females
- Unemployment rate for Asian residents
- 33.3%Females
- Unemployment rate for other race residents
- 8.4%Females
- Unemployment rate for Hispanic or Latino residents
- 8.0%Females
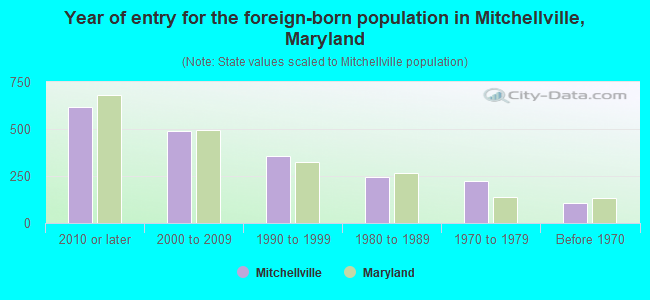
- Year of entry for the foreign-born population in Mitchellville, Maryland
- 6152010 or later
- 4922000 to 2009
- 3591990 to 1999
- 2431980 to 1989
- 2261970 to 1979
- 107Before 1970

First ancestries reported:
- Nigerian: 637 (7.9%)
- Jamaican: 310 (3.9%)
- African: 190 (2.4%)
- Ugandan: 171 (2.1%)
- Haitian: 131 (1.6%)
- Ethiopian: 113 (1.4%)
- American: 100 (1.2%)
- German: 72 (0.9%)
- Kenyan: 65 (0.8%)
- Ghanaian: 55 (0.7%)
- English: 49 (0.6%)
- Irish: 36 (0.4%)
- Guyanese: 29 (0.4%)
- U.S. Virgin Islander: 25 (0.3%)
- Trinidadian and Tobagonian: 22 (0.3%)
- Hungarian: 11 (0.1%)
- Barbadian: 9 (0.1%)
- Sierra Leonean: 6 (0.07%)
Most common places of birth for foreign-born residents (%):
| Mitchellville: | 22.3% (506) |
| Maryland: | 4.6% (44,825) |
| Mitchellville: | 16.2% (369) |
| Maryland: | 2.5% (23,969) |
| Mitchellville: | 12.8% (290) |
| Maryland: | 2.8% (27,444) |
| Mitchellville: | 7.5% (171) |
| Maryland: | 0.1% (1,429) |
| Mitchellville: | 5.7% (129) |
| Maryland: | 0.2% (1,672) |
| Mitchellville: | 5.5% (125) |
| Maryland: | 0.3% (2,949) |
| Mitchellville: | 5.1% (117) |
| Maryland: | 0.9% (9,100) |
| Mitchellville: | 3.2% (73) |
| Maryland: | 3.8% (36,698) |
| Mitchellville: | 3.1% (70) |
| Maryland: | 3.2% (30,870) |
| Mitchellville: | 2.6% (60) |
| Maryland: | 1.1% (10,233) |
| Mitchellville: | 2.3% (53) |
| Maryland: | 0.8% (8,109) |
| Mitchellville: | 2.2% (50) |
| Maryland: | 1.2% (11,481) |
| Mitchellville: | 1.8% (42) |
| Maryland: | 12.0% (115,412) |
| Mitchellville: | 1.8% (40) |
| Maryland: | 6.4% (61,725) |
| Mitchellville: | 1.8% (40) |
| Maryland: | 1.8% (17,774) |
| Mitchellville: | 1.6% (37) |
| Maryland: | 1.9% (18,716) |
Place of birth for U.S.-born residents:
- This state: 2,797
- Other state: 6,504
- Northeast: 1,032
- Midwest: 357
- South: 4,916
- West: 127
92.4% of Mitchellville residents lived in the same house 1 years ago.
Out of people who lived in different houses, 42.4% lived in this county.
Out of people who lived in different counties, 26.9% lived in Maryland.
| Mitchellville: | 92.4% |
| State average: | 88.5% |
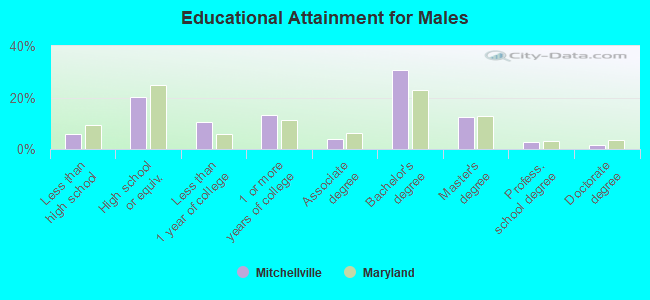
Education attainment for males 25 years and older:
- No schooling: 35
- Nursery to 4th grade: 32
- 5th and 6th grade: 16
- 7th and 8th grade: 23
- 9th grade: 5
- 10th grade: 41
- 11th grade: 2
- 12th grade, no diploma: 75
- High school graduate (or equivalency): 827
- Less than 1 year of college: 421
- Some college more than 1 year, no degree: 529
- Associate degree: 150
- Bachelor's degree: 1,241
- Master's degree: 498
- Professional school degree: 109
- Doctorate degree: 58
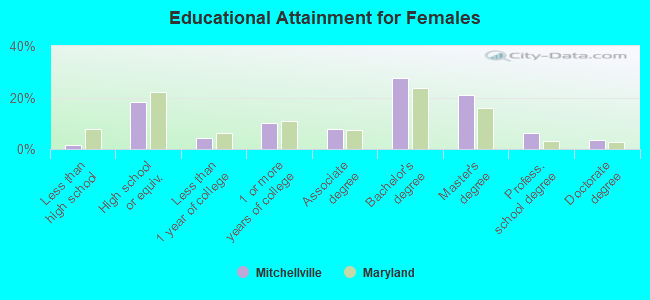
Education attainment for females 25 years and older:
- No schooling: 36
- Nursery to 4th grade: 17
- 5th and 6th grade: 0
- 7th and 8th grade: 6
- 9th grade: 0
- 10th grade: 0
- 11th grade: 24
- 12th grade, no diploma: 0
- High school graduate (or equivalency): 888
- Less than 1 year of college: 209
- Some college more than 1 year, no degree: 498
- Associate degree: 373
- Bachelor's degree: 1,347
- Master's degree: 1,027
- Professional school degree: 301
- Doctorate degree: 166


Housing units in structures:
- One, detached: 3,027
- One, attached: 1,156
- 3 or 4: 44
- 5 to 9: 28
Housing units lacking complete kitchen facilities in 2022: 0.2%
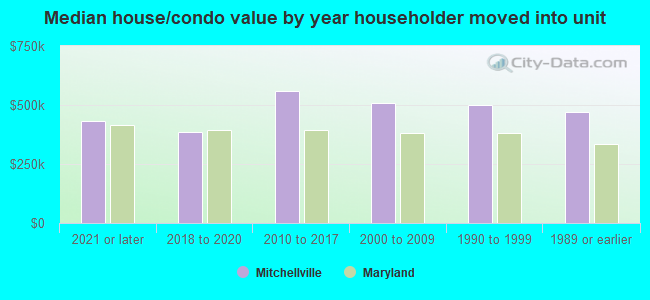
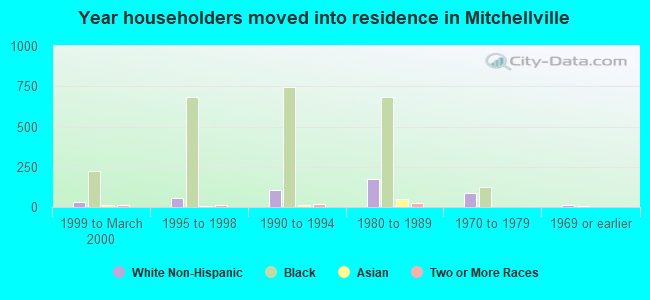
House/condo owner moved in on average 15 years ago
Renter moved in on average 5 years ago
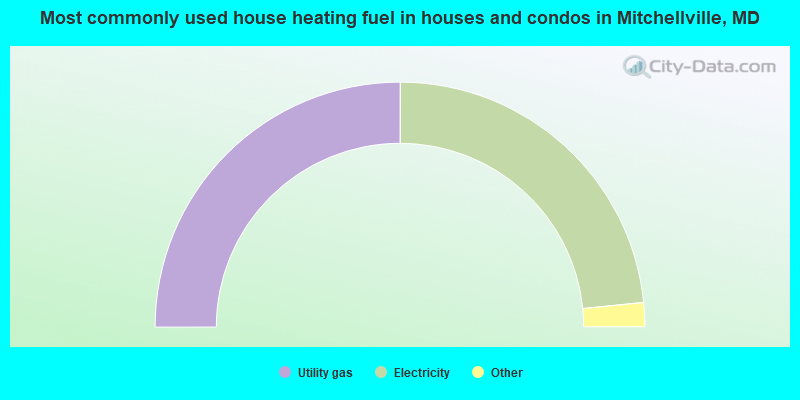
- 50.1%Utility gas
- 46.8%Electricity
- 1.7%Fuel oil, kerosene, etc.
- 0.9%Solar energy
- 0.6%Bottled, tank, or LP gas
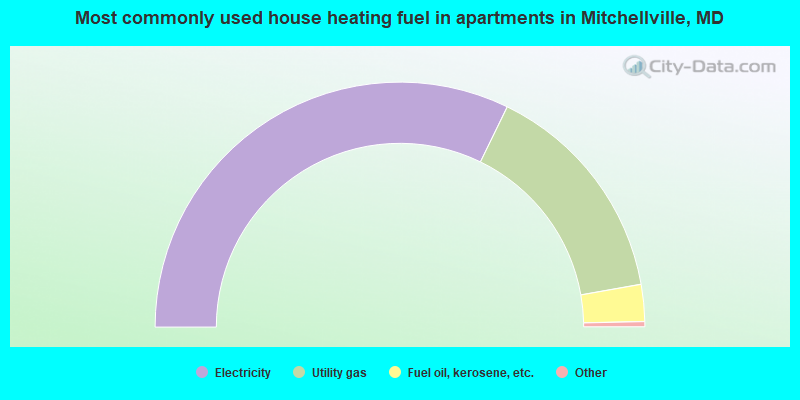
- 64.9%Electricity
- 30.2%Utility gas
- 4.9%Fuel oil, kerosene, etc.
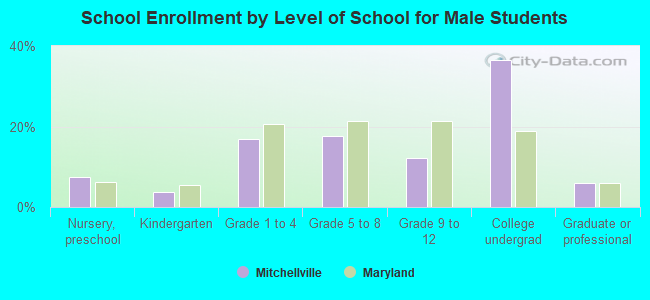
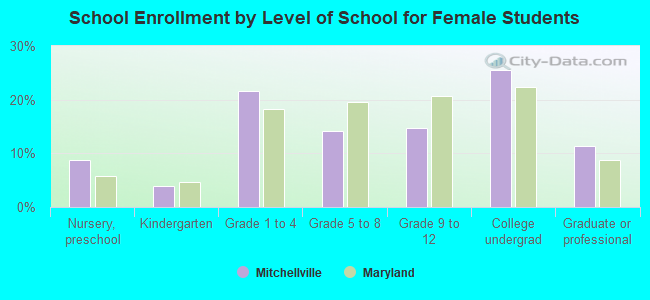
Private vs. public school enrollment:
| Here: | 13.3% |
| Maryland: | 15.2% |
| Here: | 28.6% |
| Maryland: | 14.4% |
| Here: | 29.0% |
| Maryland: | 20.2% |