Ithaca, NY (New York) Houses and Residents
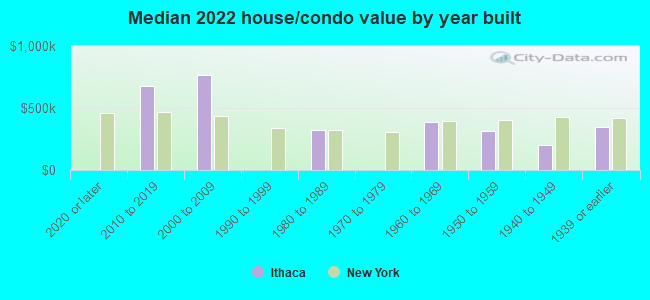
| Ithaca: | $347,245 |
| New York: | $400,400 |
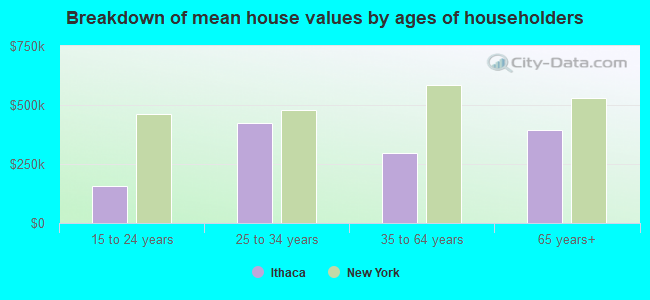
Mean price in 2022:
Detached houses: $360,063
Here: $360,063 State: $476,719 Townhouses or other attached units: $281,940
Here: $281,940 State: $699,270 In 2-unit structures: $585,666
Here: $585,666 State: $713,077 In 3-to-4-unit structures: $364,366
Here: $364,366 State: $764,568 In 5-or-more-unit structures: $398,166
Here: $398,166 State: $912,009 Mobile homes: $17,558
Here: $17,558 State: $88,925
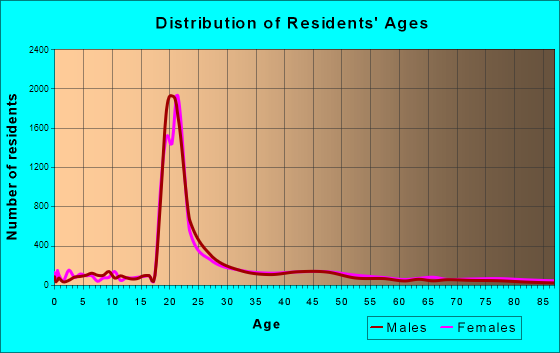
Total population: 30,720 (Urban population: 29,006, Rural population: 0)
Houses: 15,322 (13,591 occupied: 3,529 owner occupied, 9,433 renter occupied)
| % of renters here: | 73% |
| State: | 46% |
Housing density: 2,805 houses/condos per square mile
Median price asked for vacant for-sale houses and condos in 2022: $173,658.
Median contract rent in 2022: $1,148 (lower quartile is $911, upper quartile is $1,820)
Median rent asked for vacant for-rent units in 2022: $1,751
Median gross rent in Ithaca, NY in 2022: $1,366
Housing units in Ithaca with a mortgage: 1,952 (239 second mortgage, 0 home equity loan, 259 both second mortgage and home equity loan)
Houses without a mortgage: 92
Median household income for houses/condos with a mortgage: $161,755
Median household income for apartments without a mortgage: $95,103
Median monthly housing costs: $1,383
Compare current foreclosures near Ithaca, NY:
| Photo | Address | Area | Beds / Baths | Price | Details |
|---|---|---|---|---|---|

|
#1
Hillview Pl
Ithaca, NY 14850
|
1,765 sq. feet
|
2 baths 6 beds |
show details | |

|
#2
Highland Rd
Ithaca, NY 14850
|
1,614 sq. feet
|
2 baths 4 beds |
show details | |

|
#3
E Shore Cir
Ithaca, NY 14850
|
891 sq. feet
|
1 baths 2 beds |
show details | |

|
#4
Iradell Rd
Ithaca, NY 14850
|
1,571 sq. feet
|
1 baths 4 beds |
show details | |

|
#5
N Aurora St
Ithaca, NY 14850
|
1,378 sq. feet
|
2 baths 3 beds |
show details | |

|
#6
Cliff St
Ithaca, NY 14850
|
1,456 sq. feet
|
2 baths 3 beds |
show details | |

|
#7
Mecklenburg Rd
Ithaca, NY 14850
|
860 sq. feet
|
1 baths 1 beds |
show details | |

|
#8
Curtis Rd
Ithaca, NY 14850
|
1,792 sq. feet
|
2 baths 3 beds |
show details | |

|
#9
Grandview Dr
Ithaca, NY 14850
|
1,540 sq. feet
|
3 baths 3 beds |
show details | |

|
#10
Snyder Hill Rd
Ithaca, NY 14850
|
1,346 sq. feet
|
2 baths 3 beds |
show details |
| Photo | Address | Area | Beds / Baths | Price | Details |
|---|---|---|---|---|---|

|
#11
Comfort Rd # 11d
Ithaca, NY 14850
|
2,715 sq. feet
|
2 baths 5 beds |
show details | |

|
#12
Ringwood Rd
Ithaca, NY 14850
|
1,432 sq. feet
|
2 baths 3 beds |
show details | |

|
#13
Hayts Rd
Ithaca, NY 14850
|
3,132 sq. feet
|
1 baths 5 beds |
show details | |

|
#14
Danby Rd
Ithaca, NY 14850
|
- sq. feet
|
2 baths 2 beds |
show details | |

|
#15
College Ave
Ithaca, NY 14850
|
50,291 sq. feet
|
- baths - beds |
show details | |

|
#16
College Ave
Ithaca, NY 14850
|
5,296 sq. feet
|
- baths - beds |
show details | |

|
#17
Nelson Rd
Ithaca, NY 14850
|
2,106 sq. feet
|
- baths - beds |
show details | |
|
|
#18
Hudson St
Ithaca, NY 14850
|
- sq. feet
|
- baths - beds |
show details | |

|
#19
Holly Creek Ln
Ithaca, NY 14850
|
- sq. feet
|
- baths - beds |
show details | |

|
#20
Village Cir # 6
Ithaca, NY 14850
|
- sq. feet
|
- baths - beds |
show details |
| Photo | Address | Area | Beds / Baths | Price | Details |
|---|---|---|---|---|---|

|
#21
Slaterville Rd
Ithaca, NY 14850
|
- sq. feet
|
- baths - beds |
show details | |

|
#22
Simsbury Dr
Ithaca, NY 14850
|
- sq. feet
|
- baths - beds |
show details | |

|
#23
Hudson St # 2
Ithaca, NY 14850
|
- sq. feet
|
- baths - beds |
show details | |

|
#24
Etna Rd
Ithaca, NY 14850
|
- sq. feet
|
- baths 3 beds |
show details | |

|
#25
Hancock St
Ithaca, NY 14850
|
- sq. feet
|
- baths - beds |
show details | |

|
#26
E State St
Ithaca, NY 14850
|
- sq. feet
|
- baths - beds |
show details | |

|
#27
Eastern Heights Dr
Ithaca, NY 14850
|
- sq. feet
|
- baths - beds |
show details | |

|
#28
Enfield Center Rd E
Ithaca, NY 14850
|
1,008 sq. feet
|
- baths - beds |
show details | |

|
#29
Atwater Rd
King Ferry, NY 13081
|
1,332 sq. feet
|
1 baths 3 beds |
$142,500
|
show details |

|
#30
Danby Rd
Willseyville, NY 13864
|
757 sq. feet
|
1 baths 2 beds |
$21,900
|
show details |
| Photo | Address | Area | Beds / Baths | Price | Details |
|---|---|---|---|---|---|

|
#31
Williams St
Groton, NY 13073
|
2,289 sq. feet
|
3 baths 5 beds |
show details | |

|
#32
South St
Dryden, NY 13053
|
1,605 sq. feet
|
1 baths 3 beds |
show details | |

|
#33
Spring Street Ext
Groton, NY 13073
|
1,454 sq. feet
|
1 baths 4 beds |
show details | |

|
#34
Barrows St
Groton, NY 13073
|
1,413 sq. feet
|
2 baths 3 beds |
show details | |

|
#35
Eleanor Ln
Spencer, NY 14883
|
1,000 sq. feet
|
1 baths 3 beds |
show details | |

|
#36
Hulbert Hollow Rd
Spencer, NY 14883
|
912 sq. feet
|
1 baths 3 beds |
show details | |

|
#37
State Route 228
Alpine, NY 14805
|
1,184 sq. feet
|
1 baths 2 beds |
show details | |

|
#38
County Road 1
Trumansburg, NY 14886
|
1,152 sq. feet
|
1 baths 4 beds |
show details | |

|
#39
Gee Hill Rd
Dryden, NY 13053
|
999 sq. feet
|
1 baths 2 beds |
show details | |

|
#40
Candor Rd
Spencer, NY 14883
|
1,784 sq. feet
|
1 baths 4 beds |
show details |
| Photo | Address | Area | Beds / Baths | Price | Details |
|---|---|---|---|---|---|

|
#41
Emmons Rd
Lansing, NY 14882
|
1,362 sq. feet
|
1 baths 3 beds |
show details | |

|
#42
E Main St
Dryden, NY 13053
|
2,609 sq. feet
|
2 baths 5 beds |
show details | |

|
#43
Shaffer Rd
Newfield, NY 14867
|
1,851 sq. feet
|
2 baths 4 beds |
show details | |

|
#44
Benson Rd
Freeville, NY 13068
|
1,488 sq. feet
|
2 baths 2 beds |
show details | |

|
#45
Deer Run Rd
Newfield, NY 14867
|
1,586 sq. feet
|
2 baths 3 beds |
show details | |

|
#46
W Dryden Rd
Freeville, NY 13068
|
1,936 sq. feet
|
1 baths 4 beds |
show details | |

|
#47
Gunzen Dr
Cortland, NY 13045
|
1,588 sq. feet
|
1 baths 3 beds |
show details | |

|
#48
Bird Cemetery Rd
Locke, NY 13092
|
1,914 sq. feet
|
1 baths 3 beds |
show details | |

|
#49
Candor Rd
Spencer, NY 14883
|
2,856 sq. feet
|
1 baths 5 beds |
show details | |

|
Check over 1 million property listings on Foreclosure.com!
|
browse all offers | |||

Latest news about housing in Ithaca, NY collected exclusively by city-data.com from local newspapers, TV, and radio stations

 | jobs and housing in Ithaca? (3 replies) |
| McGraw House in Ithaca (19 replies) |
| Report: Capital Region is New York's fourth most expensive for household spending (2 replies) |
| Ithaca for Homesteading? (3 replies) |
| Ithaca, NY homes (17 replies) |
| Buyer Beware - Ithaca NY (64 replies) |
Median year apartment built: 1973
Household type by relationship:
Households: 32,038- Male householders: 6,853 (2,896 living alone), Female householders: 6,666 (2,596 living alone)
2,599 spouses (2,478 opposite-sex spouses), 787 unmarried partners, (677 opposite-sex unmarried partners), 2,721 children (2,657 natural, 42 adopted, 21 stepchildren), 41 grandchildren, 45 brothers or sisters, 39 parents, 0 foster children, 118 other relatives, 4,434 non-relatives
- In group quarters: 7,729
Size of family households: 1,616 2-persons, 986 3-persons, 671 4-persons, 234 5-persons, 22 6-persons, 51 7-or-more-persons.
Size of nonfamily households: 5,288 1-person, 2,458 2-persons, 664 3-persons, 166 4-persons, 107 5-persons, 60 6-persons, 233 7-or-more-persons.
1,218 married couples with children.
790 single-parent households (188 men, 602 women).
74.5% of residents of Ithaca speak English at home.
3.7% of residents speak Spanish at home (89% speak English very well, 2% speak English well, 8% speak English not well).
7.9% of residents speak other Indo-European language at home (85% speak English very well, 12% speak English well, 2% speak English not well).
11.5% of residents speak Asian or Pacific Island language at home (78% speak English very well, 18% speak English well, 4% speak English not well).
2.0% of residents speak other language at home (80% speak English very well, 19% speak English well).
Foreign born population: 7,399 (23.1%)
(23.8% of them are naturalized citizens)
| Here: | 7.0 |
| State: | 6.3 |
| Here: | 3.6 |
| State: | 3.8 |
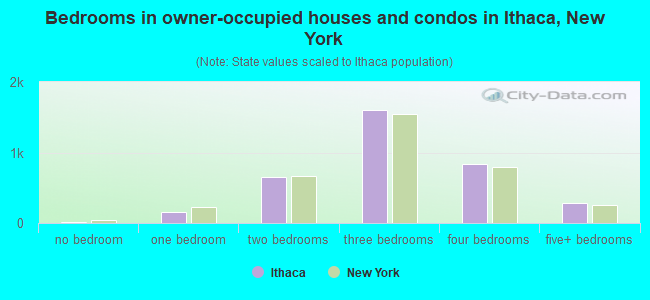
- Bedrooms in owner-occupied houses and condos in Ithaca, New York
- 17no bedroom
- 1511 bedroom
- 6492 bedrooms
- 1,5963 bedrooms
- 8374 bedrooms
- 2805+ bedrooms
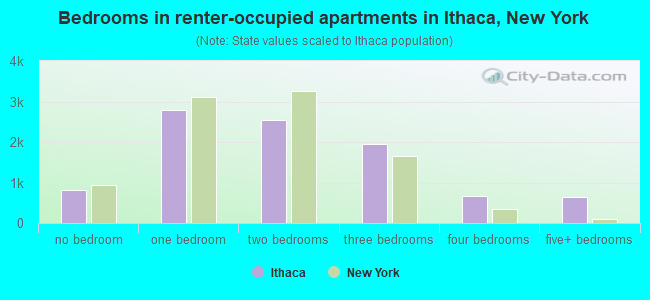
- Bedrooms in renter-occupied apartments in Ithaca, New York
- 820no bedroom
- 2,7851 bedroom
- 2,5502 bedrooms
- 1,9623 bedrooms
- 6624 bedrooms
- 6545+ bedrooms
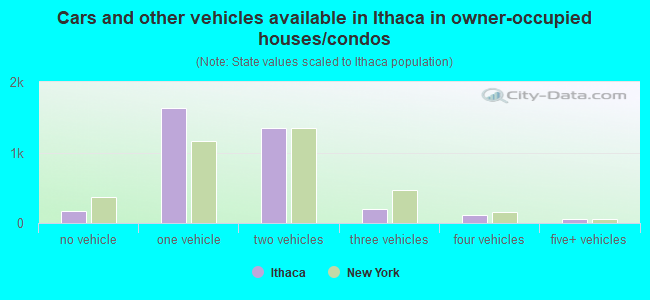
- Cars and other vehicles available in Ithaca in owner-occupied houses/condos
- 169no vehicle
- 1,6311 vehicle
- 1,3502 vehicles
- 2053 vehicles
- 1144 vehicles
- 615+ vehicles
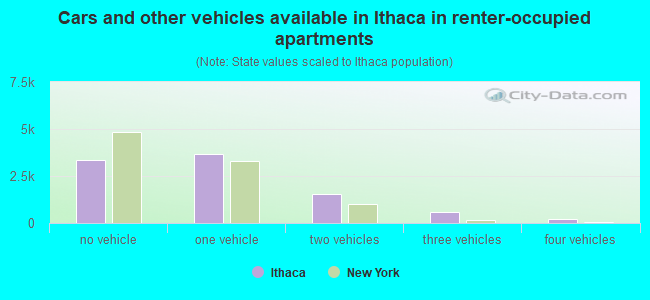
- Cars and other vehicles available in Ithaca in renter-occupied apartments
- 3,368no vehicle
- 3,6511 vehicle
- 1,5662 vehicles
- 6013 vehicles
- 2164 vehicles
- 325+ vehicles
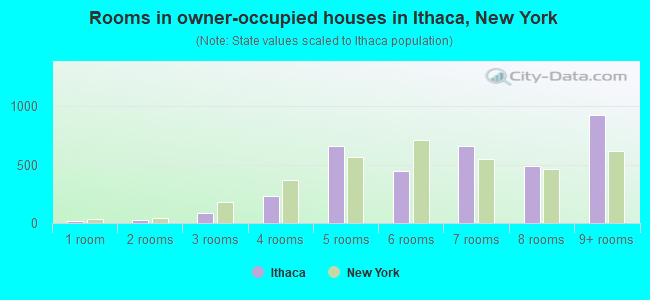
- Rooms in owner-occupied houses in Ithaca, New York
- 171 room
- 242 rooms
- 893 rooms
- 2304 rooms
- 6585 rooms
- 4426 rooms
- 6557 rooms
- 4908 rooms
- 9259+ rooms
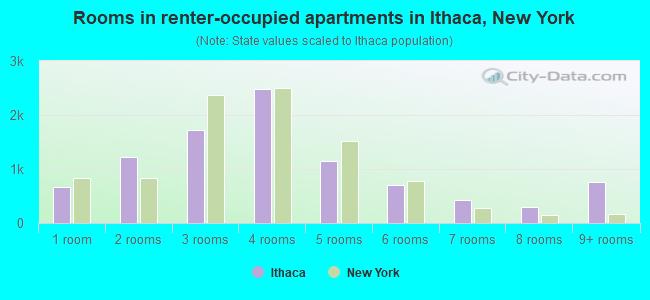
- Rooms in renter-occupied apartments in Ithaca, New York
- 6731 room
- 1,2262 rooms
- 1,7213 rooms
- 2,4884 rooms
- 1,1465 rooms
- 7046 rooms
- 4177 rooms
- 2968 rooms
- 7619+ rooms
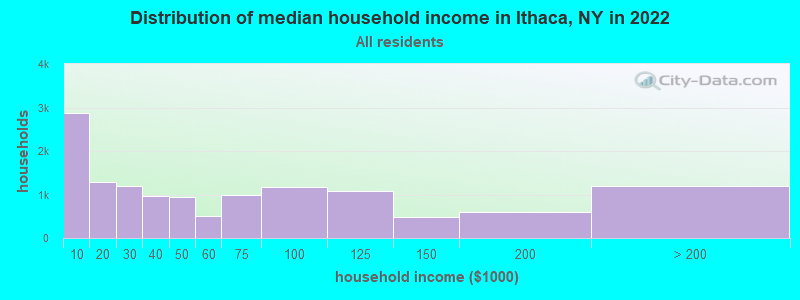
Ithaca, NY household income distribution

- 2,872Less than $10,000
- 1,276$10,000 to $19,999
- 1,205$20,000 to $29,999
- 961$30,000 to $39,999
- 939$40,000 to $49,999
- 508$50,000 to $59,999
- 997$60,000 to $74,999
- 1,183$75,000 to $99,999
- 1,071$100,000 to $124,999
- 476$125,000 to $149,999
- 598$150,000 to $199,999
- 1,205$200,000 or more
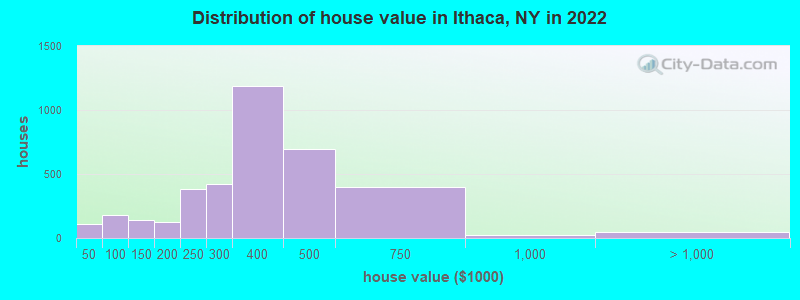
Home value of owner - occupied houses in 2022 in Ithaca, NY
-
- 26Less than $10,000
- 41$10,000 to $14,999
- 6$15,000 to $19,999
- 15$20,000 to $24,999
- 13$25,000 to $29,999
- 3$35,000 to $39,999
- 14$50,000 to $59,999
- 164$80,000 to $89,999
- 124$100,000 to $124,999
- 19$125,000 to $149,999
- 11$150,000 to $174,999
- 113$175,000 to $199,999
- 379$200,000 to $249,999
- 422$250,000 to $299,999
- 1,186$300,000 to $399,999
- 694$400,000 to $499,999
- 401$500,000 to $749,999
- 26$750,000 to $999,999
- 49$2,000,000 or more
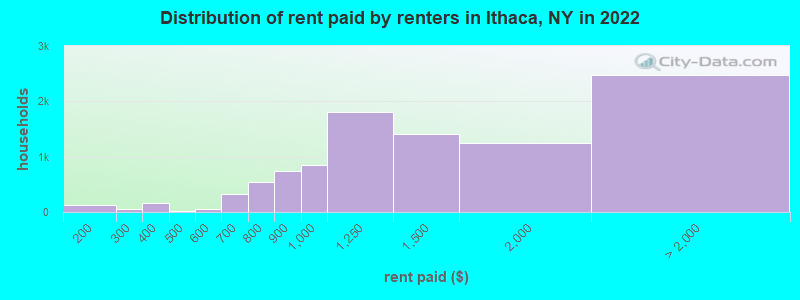
Rent paid by renters in 2022 in Ithaca, NY
-
- 7Less than $100
- 31$100 to $149
- 99$150 to $199
- 34$200 to $249
- 14$250 to $299
- 40$300 to $349
- 114$350 to $399
- 14$400 to $449
- 11$500 to $549
- 35$550 to $599
- 81$600 to $649
- 248$650 to $699
- 128$700 to $749
- 406$750 to $799
- 736$800 to $899
- 841$900 to $999
- 1,810$1,000 to $1,249
- 1,417$1,250 to $1,499
- 1,248$1,500 to $1,999
- 1,428$2,000 to $2,499
- 385$2,500 to $2,999
- 49$3,000 to $3,499
- 199$3,500 or more
- 415No cash rent
Percentage of workers working in this county: 96.9%
Number of people working at home: 3,409 (24.3% of all workers)
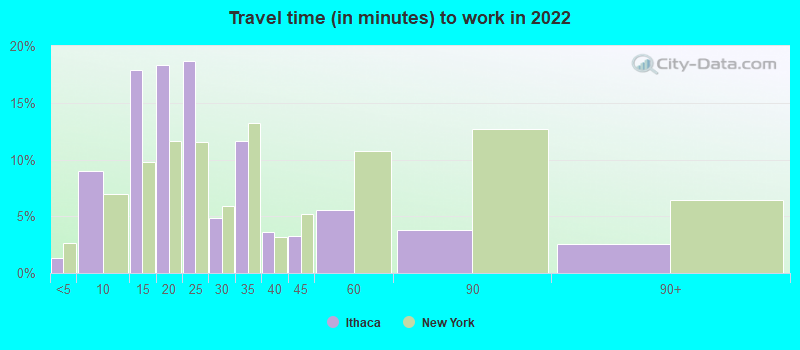
Travel time to work (commute)
- Less than 5 minutes: 191
- 5 to 9 minutes: 1,603
- 10 to 14 minutes: 2,745
- 15 to 19 minutes: 2,132
- 20 to 24 minutes: 1,841
- 25 to 29 minutes: 269
- 30 to 34 minutes: 1,082
- 35 to 39 minutes: 127
- 40 to 44 minutes: 239
- 45 to 59 minutes: 174
- 60 to 89 minutes: 262
- 90 or more minutes: 187
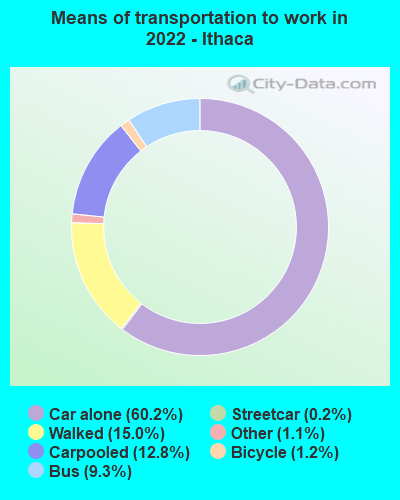
Means of transportation to work:
- Drove a car alone: 15,851 (52.4%)
- Carpooled: 3,983 (13.2%)
- Bus: 2,192 (7.3%)
- Subway or elevated rail: 56 (0.2%)
- Light rail, streetcar or trolley: 13 (0.0%)
- Ferryboat: 15 (0.0%)
- Taxi: 356 (1.2%)
- Bicycle: 310 (1.0%)
- Walked: 4,150 (13.7%)
- Worked at home: 3,409 (11.3%)
- Unemployment by race in 2022
- Unemployment rate for White non-Hispanic residents
- 4.5%Males
- 5.5%Females
- Unemployment rate for Black residents
- 39.1%Males
- 6.3%Females
- Unemployment rate for American Indian and Alaska Native residents
- 41.3%Males
- Unemployment rate for Asian residents
- 5.3%Males
- Unemployment rate for other race residents
- 11.7%Males
- 1.8%Females
- Unemployment rate for two or more race residents
- 18.0%Females
- Unemployment rate for Hispanic or Latino residents
- 5.1%Males
- 13.2%Females
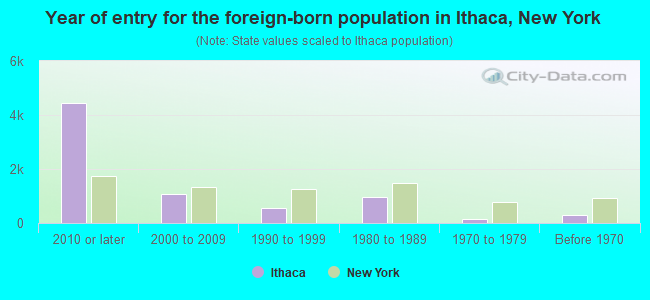
- Year of entry for the foreign-born population in Ithaca, New York
- 4,4392010 or later
- 1,0642000 to 2009
- 5571990 to 1999
- 9521980 to 1989
- 1371970 to 1979
- 288Before 1970
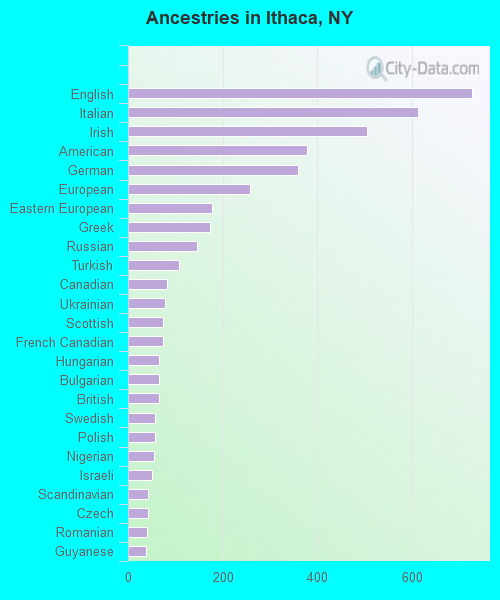
First ancestries reported:
- English: 727 (7.8%)
- Italian: 614 (6.6%)
- Irish: 505 (5.4%)
- American: 378 (4.1%)
- German: 360 (3.9%)
- European: 259 (2.8%)
- Eastern European: 177 (1.9%)
- Greek: 174 (1.9%)
- Russian: 145 (1.6%)
- Turkish: 107 (1.2%)
- Canadian: 82 (0.9%)
- Ukrainian: 78 (0.8%)
- Scottish: 74 (0.8%)
- French Canadian: 73 (0.8%)
- Hungarian: 66 (0.7%)
- Bulgarian: 66 (0.7%)
- British: 65 (0.7%)
- Swedish: 58 (0.6%)
- Polish: 58 (0.6%)
- Nigerian: 54 (0.6%)
- Israeli: 51 (0.5%)
- Scandinavian: 43 (0.5%)
- Czech: 42 (0.5%)
- Romanian: 40 (0.4%)
- Guyanese: 39 (0.4%)
- Danish: 36 (0.4%)
- Iranian: 32 (0.3%)
- Dutch: 31 (0.3%)
- Portuguese: 28 (0.3%)
- French: 25 (0.3%)
- Armenian: 22 (0.2%)
- Pennsylvania German: 22 (0.2%)
- Scotch-Irish: 21 (0.2%)
- Austrian: 19 (0.2%)
- Norwegian: 18 (0.2%)
- South African: 18 (0.2%)
- Egyptian: 17 (0.2%)
- Latvian: 14 (0.2%)
- Brazilian: 13 (0.1%)
- Syrian: 12 (0.1%)
- African: 11 (0.1%)
- Belizean: 10 (0.1%)
- Macedonian: 9 (0.10%)
- Senegalese: 6 (0.06%)
- Sierra Leonean: 4 (0.04%)
- Swiss: 4 (0.04%)
- Finnish: 4 (0.04%)
- Ethiopian: 3 (0.03%)
Most common places of birth for foreign-born residents (%):
| Ithaca: | 20.9% (1,275) |
| New York: | 9.1% (410,910) |
| Ithaca: | 10.4% (634) |
| New York: | 3.5% (158,432) |
| Ithaca: | 7.8% (479) |
| New York: | 1.3% (59,107) |
| Ithaca: | 5.6% (339) |
| New York: | 1.8% (82,786) |
| Ithaca: | 4.1% (253) |
| New York: | 0.8% (33,869) |
| Ithaca: | 3.7% (225) |
| New York: | 1.7% (78,421) |
| Ithaca: | 3.2% (194) |
| New York: | 0.9% (42,220) |
| Ithaca: | 2.1% (130) |
| New York: | 0.5% (23,058) |
| Ithaca: | 2.0% (122) |
| New York: | 0.4% (17,363) |
| Ithaca: | 1.9% (117) |
| New York: | 1.8% (81,374) |
| Ithaca: | 1.8% (112) |
| New York: | 0.7% (30,658) |
| Ithaca: | 1.6% (95) |
| New York: | 0.9% (38,713) |
| Ithaca: | 1.5% (93) |
| New York: | 1.7% (75,802) |
| Ithaca: | 1.5% (93) |
| New York: | 2.6% (117,288) |
Place of birth for U.S.-born residents:
- This state: 12,048
- Other state: 12,458
- Northeast: 4,835
- Midwest: 2,696
- South: 2,292
- West: 2,516
53.8% of Ithaca residents lived in the same house 1 years ago.
Out of people who lived in different houses, 21.7% lived in this county.
Out of people who lived in different counties, 49.2% lived in New York.
| Ithaca: | 53.8% |
| State average: | 89.6% |
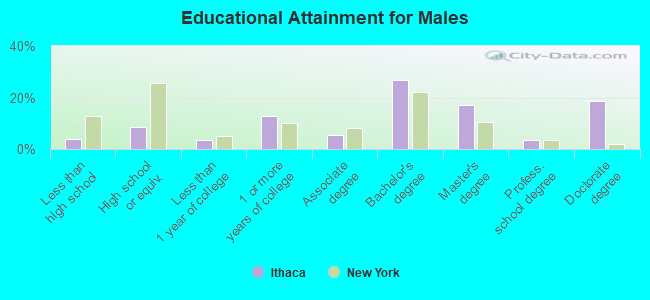
Education attainment for males 25 years and older:
- No schooling: 45
- Nursery to 4th grade: 8
- 5th and 6th grade: 9
- 7th and 8th grade: 32
- 9th grade: 0
- 10th grade: 3
- 11th grade: 34
- 12th grade, no diploma: 113
- High school graduate (or equivalency): 559
- Less than 1 year of college: 216
- Some college more than 1 year, no degree: 828
- Associate degree: 350
- Bachelor's degree: 1,733
- Master's degree: 1,115
- Professional school degree: 235
- Doctorate degree: 1,222
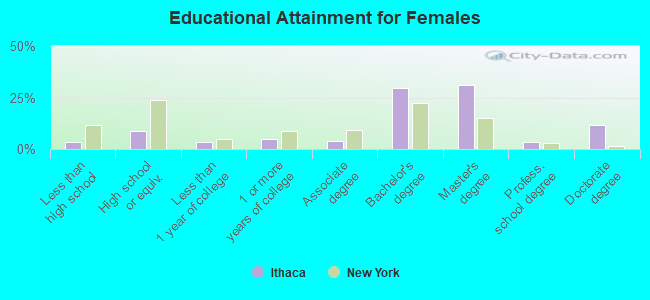
Education attainment for females 25 years and older:
- No schooling: 72
- Nursery to 4th grade: 51
- 5th and 6th grade: 58
- 7th and 8th grade: 11
- 9th grade: 4
- 10th grade: 0
- 11th grade: 5
- 12th grade, no diploma: 39
- High school graduate (or equivalency): 632
- Less than 1 year of college: 262
- Some college more than 1 year, no degree: 341
- Associate degree: 285
- Bachelor's degree: 2,116
- Master's degree: 2,241
- Professional school degree: 253
- Doctorate degree: 821
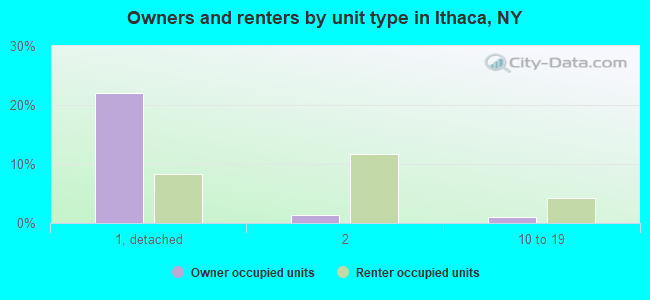
Housing units in structures:
- One, detached: 4,501
- One, attached: 450
- Two: 2,118
- 3 or 4: 1,639
- 5 to 9: 2,025
- 10 to 19: 1,101
- 20 to 49: 1,547
- 50 or more: 1,780
- Mobile homes: 156
Median worth of mobile homes: $19,166
Housing units lacking complete kitchen facilities in 2022: 1.6%
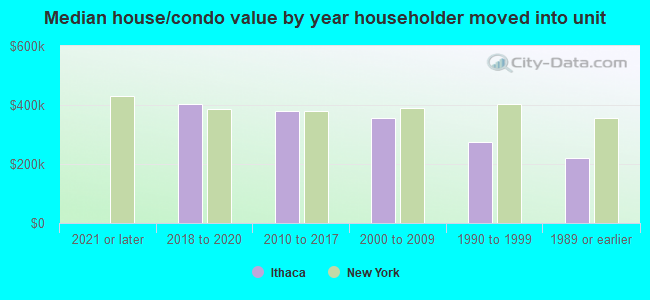
House/condo owner moved in on average 10 years ago
Renter moved in on average -1 years ago
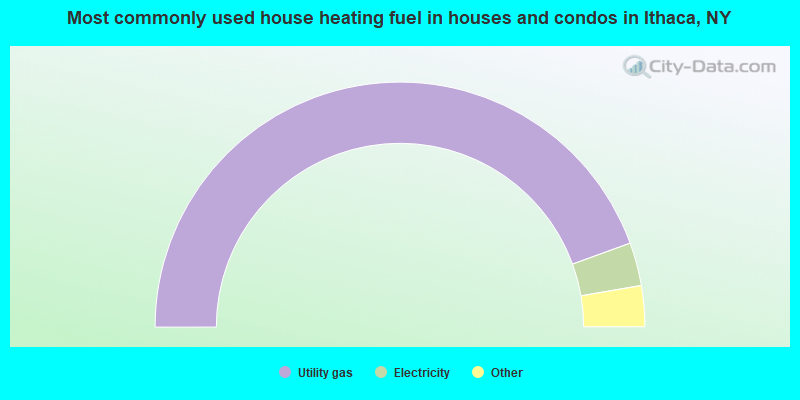
- 88.9%Utility gas
- 5.7%Electricity
- 2.9%Wood
- 1.3%Fuel oil, kerosene, etc.
- 0.8%Bottled, tank, or LP gas
- 0.3%No fuel used
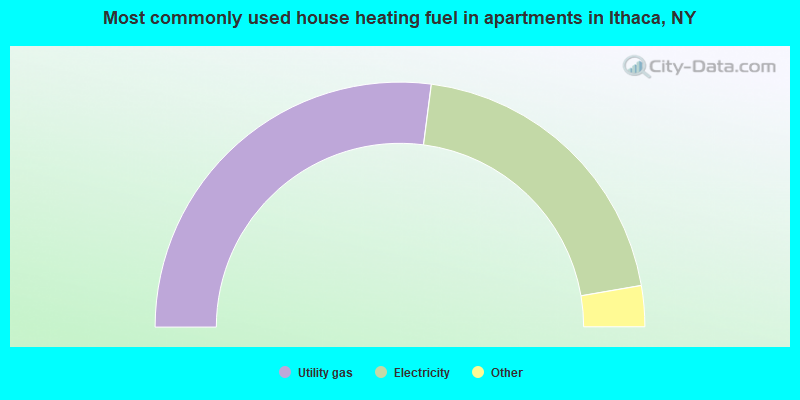
- 54.1%Utility gas
- 40.5%Electricity
- 2.4%Bottled, tank, or LP gas
- 1.2%Other fuel
- 0.9%No fuel used
- 0.8%Fuel oil, kerosene, etc.
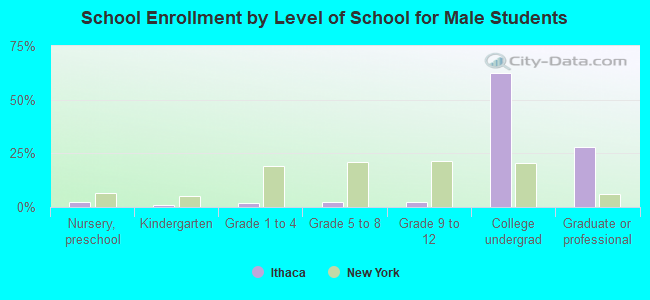
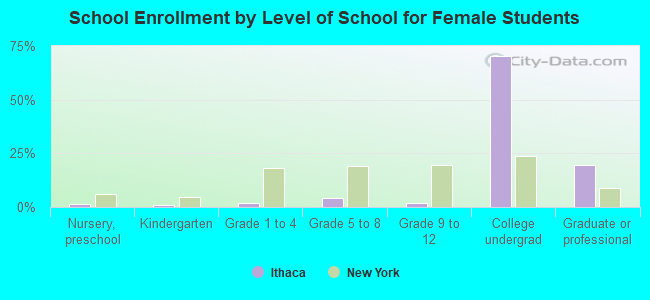
Private vs. public school enrollment:
| Here: | 14.8% |
| New York: | 15.6% |
| Here: | 5.8% |
| New York: | 15.0% |
| Here: | 89.6% |
| New York: | 39.2% |