Dallas, GA (Georgia) Houses and Residents
| Dallas: | $257,907 |
| Georgia: | $297,400 |
Total population: 12,629 (Urban population: 4,939, Rural population: 33 (all nonfarm))
Houses: 6,455 (5,782 occupied: 3,265 owner occupied, 2,590 renter occupied)
| % of renters here: | 44% |
| State: | 34% |
Housing density: 1,431 houses/condos per square mile
Median price asked for vacant for-sale houses and condos in 2022: $255,802.
Median contract rent in 2022: $1,038 (lower quartile is $595, upper quartile is $1,476)
Median rent asked for vacant for-rent units in 2022: $2,327
Median gross rent in Dallas, GA in 2022: $1,223
Housing units in Dallas with a mortgage: 2,098 (95 second mortgage, 0 home equity loan, 89 both second mortgage and home equity loan)
Houses without a mortgage: 0
Median household income for houses/condos with a mortgage: $69,708
Median household income for apartments without a mortgage: $43,827
Median monthly housing costs: $1,152
Compare current foreclosures in Dallas, GA:
| Photo | Address | Area | Beds / Baths | Price | Details |
|---|---|---|---|---|---|

|
#1
Crescent Brook Xing
Dallas, GA 30157
|
2,402 sq. feet
|
3 baths 3 beds |
show details | |

|
#2
Seals Dr
Dallas, GA 30157
|
1,262 sq. feet
|
2 baths 3 beds |
show details | |

|
#3
Timothy Dr
Dallas, GA 30132
|
1,391 sq. feet
|
3 baths 4 beds |
show details | |

|
#4
Ladora Dr
Dallas, GA 30157
|
1,426 sq. feet
|
2 baths 3 beds |
show details | |

|
#5
Wyndham Lakes Dr NW
Dallas, GA 30157
|
2,050 sq. feet
|
2 baths 3 beds |
show details | |

|
#6
Grace Arbor Ln
Dallas, GA 30132
|
- sq. feet
|
5 baths 5 beds |
show details | |

|
#7
Old County Farm Rd
Dallas, GA 30132
|
1,344 sq. feet
|
1 baths 3 beds |
show details | |

|
#8
Overlook Dr
Dallas, GA 30157
|
2,104 sq. feet
|
2 baths 3 beds |
show details | |

|
#9
Beams Way
Dallas, GA 30157
|
1,522 sq. feet
|
2 baths 3 beds |
show details | |

|
#10
Bainbridge Ct
Dallas, GA 30132
|
1,773 sq. feet
|
2 baths 3 beds |
show details |
| Photo | Address | Area | Beds / Baths | Price | Details |
|---|---|---|---|---|---|

|
#11
Lemuel Ln
Dallas, GA 30157
|
1,381 sq. feet
|
2 baths 3 beds |
show details | |

|
#12
Viola Dr
Dallas, GA 30157
|
1,383 sq. feet
|
2 baths 3 beds |
show details | |

|
#13
Watson Dr
Dallas, GA 30132
|
1,584 sq. feet
|
2 baths 3 beds |
show details | |

|
#14
Riders Rdg
Dallas, GA 30132
|
1,488 sq. feet
|
2 baths 3 beds |
show details | |

|
#15
Ivy Trace Ln
Dallas, GA 30157
|
1,200 sq. feet
|
2 baths 3 beds |
show details | |

|
#16
Homestead Dr
Dallas, GA 30157
|
2,690 sq. feet
|
2 baths 3 beds |
show details | |

|
#17
Bainbridge Cir
Dallas, GA 30132
|
1,227 sq. feet
|
2 baths 3 beds |
show details | |

|
#18
Spring Dale Ln
Dallas, GA 30157
|
1,720 sq. feet
|
2 baths 3 beds |
show details | |

|
#19
Dare Ln
Dallas, GA 30157
|
1,326 sq. feet
|
2 baths 3 beds |
show details | |

|
#20
Eagle Pointe Dr
Dallas, GA 30132
|
2,166 sq. feet
|
2 baths 3 beds |
show details |
| Photo | Address | Area | Beds / Baths | Price | Details |
|---|---|---|---|---|---|

|
#21
Ivy Terrace Dr
Dallas, GA 30157
|
1,200 sq. feet
|
2 baths 3 beds |
show details | |

|
#22
Parkmont Ln
Dallas, GA 30132
|
2,237 sq. feet
|
2 baths 3 beds |
show details | |

|
#23
Millstone Gln
Dallas, GA 30157
|
2,327 sq. feet
|
2 baths 4 beds |
show details | |

|
#24
Twin Oaks Ln
Dallas, GA 30157
|
1,262 sq. feet
|
2 baths 3 beds |
show details | |

|
#25
Brookview Dr
Dallas, GA 30132
|
1,538 sq. feet
|
2 baths 3 beds |
show details | |

|
#26
Silver Fox Trl
Dallas, GA 30157
|
2,115 sq. feet
|
2 baths 3 beds |
show details | |

|
#27
Foxdale Way
Dallas, GA 30132
|
2,391 sq. feet
|
2 baths 3 beds |
show details | |

|
#28
Harris Oaks
Dallas, GA 30157
|
1,319 sq. feet
|
2 baths 3 beds |
show details | |

|
#29
Benson Rd
Dallas, GA 30132
|
2,640 sq. feet
|
2 baths 3 beds |
show details | |

|
#30
Jenna Ln
Dallas, GA 30157
|
1,548 sq. feet
|
2 baths 3 beds |
show details |
| Photo | Address | Area | Beds / Baths | Price | Details |
|---|---|---|---|---|---|

|
#31
Dazzling Ct
Dallas, GA 30132
|
3,395 sq. feet
|
3 baths 5 beds |
show details | |

|
#32
Fieldcrest Dr
Dallas, GA 30132
|
1,694 sq. feet
|
2 baths 3 beds |
show details | |

|
#33
Spring Ridge Dr
Dallas, GA 30157
|
1,562 sq. feet
|
2 baths 3 beds |
show details | |

|
#34
Silver Spring St
Dallas, GA 30157
|
1,570 sq. feet
|
2 baths 3 beds |
show details | |

|
#35
Stone Creek Dr
Dallas, GA 30157
|
1,721 sq. feet
|
2 baths 3 beds |
show details | |

|
#36
Brooks St
Dallas, GA 30157
|
1,420 sq. feet
|
2 baths 3 beds |
show details | |

|
#37
Fairview Dr
Dallas, GA 30157
|
1,318 sq. feet
|
2 baths 3 beds |
show details | |

|
#38
Huntleigh Shores Ln
Dallas, GA 30132
|
2,508 sq. feet
|
2 baths 3 beds |
show details | |

|
#39
Woodbridge Dr
Dallas, GA 30157
|
1,218 sq. feet
|
2 baths 3 beds |
show details | |

|
#40
Brookvalley Cmns
Dallas, GA 30157
|
2,188 sq. feet
|
2 baths 3 beds |
show details |
| Photo | Address | Area | Beds / Baths | Price | Details |
|---|---|---|---|---|---|

|
#41
Henderson Ridge Ct
Dallas, GA 30157
|
2,225 sq. feet
|
2 baths 3 beds |
show details | |

|
#42
Jeremiah Way
Dallas, GA 30132
|
1,194 sq. feet
|
2 baths 3 beds |
show details | |

|
#43
Estate Ct
Dallas, GA 30157
|
1,414 sq. feet
|
2 baths 3 beds |
show details | |

|
#44
Farm Brook Ln
Dallas, GA 30157
|
1,104 sq. feet
|
2 baths 3 beds |
show details | |

|
#45
Twin Oaks Ln
Dallas, GA 30157
|
1,192 sq. feet
|
2 baths 3 beds |
show details | |

|
#46
Jeremiah Way
Dallas, GA 30132
|
2,348 sq. feet
|
2 baths 3 beds |
show details | |

|
#47
Muskogee Dr
Dallas, GA 30132
|
1,680 sq. feet
|
2 baths 3 beds |
show details | |

|
#48
Steeple Chase Trl
Dallas, GA 30132
|
1,522 sq. feet
|
3 baths 3 beds |
show details | |

|
#49
Lady Allison Ln
Dallas, GA 30157
|
1,220 sq. feet
|
2 baths 3 beds |
show details | |

|
Check over 1 million property listings on Foreclosure.com!
|
browse all offers | |||

Latest news about housing in Dallas, GA collected exclusively by city-data.com from local newspapers, TV, and radio stations


Median year apartment built: 1998
Household type by relationship:
Households: 14,834- Male householders: 2,267 (696 living alone), Female householders: 3,459 (1,257 living alone)
2,454 spouses (2,454 opposite-sex spouses), 356 unmarried partners, (356 opposite-sex unmarried partners), 4,453 children (3,871 natural, 178 adopted, 403 stepchildren), 588 grandchildren, 181 brothers or sisters, 341 parents, 0 foster children, 154 other relatives, 367 non-relatives
- In group quarters: 211
Size of family households: 1,003 2-persons, 1,445 3-persons, 801 4-persons, 343 5-persons, 124 6-persons, 38 7-or-more-persons.
Size of nonfamily households: 1,754 1-person, 267 2-persons, 6 3-persons.
2,073 married couples with children.
1,127 single-parent households (227 men, 900 women).
87.5% of residents of Dallas speak English at home.
6.6% of residents speak Spanish at home (72% speak English very well, 11% speak English well, 17% don't speak English at all).
1.1% of residents speak other Indo-European language at home (78% speak English very well, 22% speak English well).
3.5% of residents speak Asian or Pacific Island language at home (52% speak English very well, 46% speak English well, 1% speak English not well).
1.2% of residents speak other language at home (100% speak English very well).
Foreign born population: 1,312 (8.8%)
(49.6% of them are naturalized citizens)
| Here: | 6.2 |
| State: | 6.8 |
| Here: | 4.7 |
| State: | 4.6 |

- Bedrooms in owner-occupied houses and condos in Dallas, Georgia
- 0no bedroom
- 291 bedroom
- 4352 bedrooms
- 1,9153 bedrooms
- 4534 bedrooms
- 4345+ bedrooms

- Bedrooms in renter-occupied apartments in Dallas, Georgia
- 0no bedroom
- 4821 bedroom
- 9422 bedrooms
- 8503 bedrooms
- 2124 bedrooms
- 1045+ bedrooms

- Cars and other vehicles available in Dallas in owner-occupied houses/condos
- 133no vehicle
- 1,0371 vehicle
- 1,4012 vehicles
- 5203 vehicles
- 1074 vehicles
- 675+ vehicles

- Cars and other vehicles available in Dallas in renter-occupied apartments
- 294no vehicle
- 1,3981 vehicle
- 6962 vehicles
- 1063 vehicles
- 114 vehicles
- 855+ vehicles

- Rooms in owner-occupied houses in Dallas, Georgia
- 01 room
- 02 rooms
- 353 rooms
- 2374 rooms
- 8875 rooms
- 8476 rooms
- 4847 rooms
- 2008 rooms
- 5759+ rooms

- Rooms in renter-occupied apartments in Dallas, Georgia
- 01 room
- 1442 rooms
- 1833 rooms
- 7354 rooms
- 5675 rooms
- 5496 rooms
- 2077 rooms
- 1348 rooms
- 729+ rooms


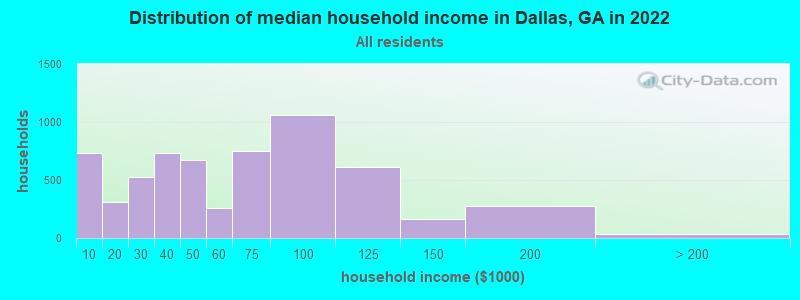
Dallas, GA household income distribution

- 732Less than $10,000
- 313$10,000 to $19,999
- 526$20,000 to $29,999
- 729$30,000 to $39,999
- 669$40,000 to $49,999
- 257$50,000 to $59,999
- 748$60,000 to $74,999
- 1,060$75,000 to $99,999
- 609$100,000 to $124,999
- 166$125,000 to $149,999
- 273$150,000 to $199,999
- 36$200,000 or more
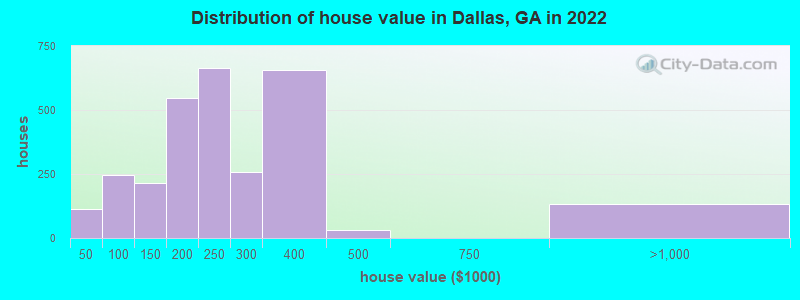
Home value of owner - occupied houses in 2022 in Dallas, GA
-
- 11Less than $10,000
- 42$25,000 to $29,999
- 59$30,000 to $34,999
- 170$50,000 to $59,999
- 24$60,000 to $69,999
- 21$70,000 to $79,999
- 30$90,000 to $99,999
- 141$100,000 to $124,999
- 71$125,000 to $149,999
- 407$150,000 to $174,999
- 139$175,000 to $199,999
- 665$200,000 to $249,999
- 258$250,000 to $299,999
- 657$300,000 to $399,999
- 33$400,000 to $499,999
- 133$750,000 to $999,999
Rent paid by renters in 2022 in Dallas, GA
-
- 15Less than $100
- 93$100 to $149
- 74$150 to $199
- 25$200 to $249
- 19$250 to $299
- 120$300 to $349
- 125$400 to $449
- 41$450 to $499
- 94$550 to $599
- 16$700 to $749
- 28$750 to $799
- 129$800 to $899
- 178$900 to $999
- 287$1,000 to $1,249
- 531$1,250 to $1,499
- 429$1,500 to $1,999
- 145$2,500 to $2,999
- 77No cash rent


Percentage of workers working in this county: 42.7%
Number of people working at home: 744 (11.1% of all workers)
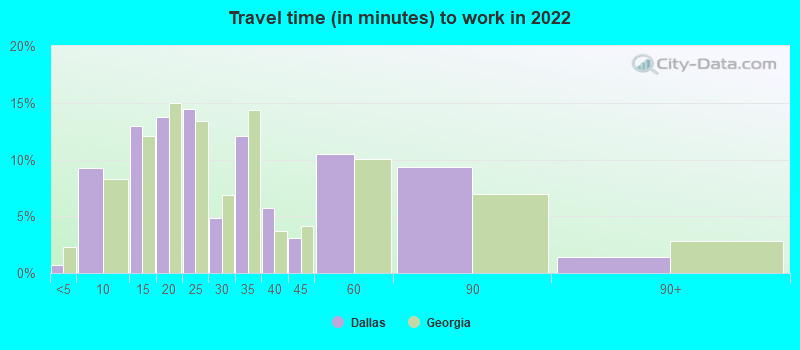
Travel time to work (commute)
- Less than 5 minutes: 20
- 5 to 9 minutes: 446
- 10 to 14 minutes: 355
- 15 to 19 minutes: 446
- 20 to 24 minutes: 420
- 25 to 29 minutes: 330
- 30 to 34 minutes: 865
- 35 to 39 minutes: 253
- 40 to 44 minutes: 183
- 45 to 59 minutes: 1,274
- 60 to 89 minutes: 1,282
- 90 or more minutes: 133
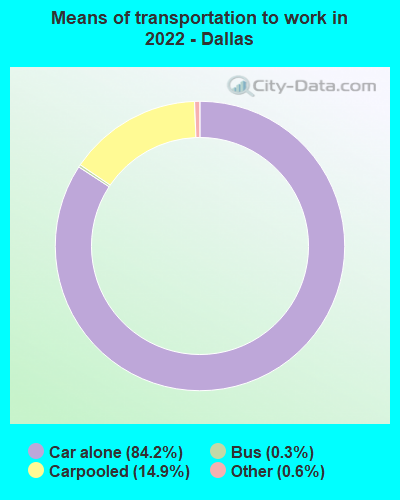
Means of transportation to work:
- Drove a car alone: 5,305 (73.9%)
- Carpooled: 979 (13.6%)
- Bus: 16 (0.2%)
- Taxi: 38 (0.5%)
- Worked at home: 744 (10.4%)

- Unemployment by race in 2022
- Unemployment rate for White non-Hispanic residents
- 4.1%Males
- 1.1%Females
- Unemployment rate for Black residents
- 0.5%Males
- 12.4%Females
- Unemployment rate for other race residents
- 33.7%Females
- Unemployment rate for Hispanic or Latino residents
- 4.8%Females

- Year of entry for the foreign-born population in Dallas, Georgia
- 4292010 or later
- 1622000 to 2009
- 2381990 to 1999
- 161980 to 1989
- 01970 to 1979
- 20Before 1970

First ancestries reported:
- American: 1,560 (19.7%)
- English: 1,001 (12.7%)
- Irish: 329 (4.2%)
- European: 195 (2.5%)
- Bahamian: 192 (2.4%)
- Nigerian: 163 (2.1%)
- German: 135 (1.7%)
- Haitian: 132 (1.7%)
- Italian: 129 (1.6%)
- Trinidadian and Tobagonian: 127 (1.6%)
- African: 86 (1.1%)
- Scotch-Irish: 74 (0.9%)
- Scottish: 65 (0.8%)
- Greek: 26 (0.3%)
- Norwegian: 10 (0.1%)
- Liberian: 10 (0.1%)
Most common places of birth for foreign-born residents (%):
| Dallas: | 23.1% (279) |
| Georgia: | 0.1% (841) |
| Dallas: | 18.4% (222) |
| Georgia: | 0.8% (8,613) |
| Dallas: | 15.3% (185) |
| Georgia: | 1.1% (11,847) |
| Dallas: | 11.6% (140) |
| Georgia: | 2.5% (27,846) |
| Dallas: | 9.8% (119) |
| Georgia: | 1.8% (20,700) |
| Dallas: | 9.8% (118) |
| Georgia: | 1.7% (18,651) |
| Dallas: | 8.2% (99) |
| Georgia: | 0.4% (4,350) |
| Dallas: | 4.2% (51) |
| Georgia: | 0.8% (8,684) |
| Dallas: | 3.8% (46) |
| Georgia: | 0.7% (7,969) |
| Dallas: | 2.5% (30) |
| Georgia: | 0.3% (2,804) |
| Dallas: | 2.0% (24) |
| Georgia: | 0.2% (2,552) |
| Dallas: | 2.0% (24) |
| Georgia: | 1.6% (17,476) |
| Dallas: | 1.6% (19) |
| Georgia: | 1.6% (17,851) |
Place of birth for U.S.-born residents:
- This state: 8,111
- Other state: 5,203
- Northeast: 1,324
- Midwest: 896
- South: 2,453
- West: 535
82.0% of Dallas residents lived in the same house 1 years ago.
Out of people who lived in different houses, 31.9% lived in this county.
Out of people who lived in different counties, 98.1% lived in Georgia.
| Dallas: | 82.0% |
| State average: | 86.6% |
Education attainment for males 25 years and older:
- No schooling: 128
- Nursery to 4th grade: 20
- 5th and 6th grade: 0
- 7th and 8th grade: 10
- 9th grade: 148
- 10th grade: 18
- 11th grade: 105
- 12th grade, no diploma: 191
- High school graduate (or equivalency): 1,813
- Less than 1 year of college: 433
- Some college more than 1 year, no degree: 657
- Associate degree: 400
- Bachelor's degree: 699
- Master's degree: 91
- Professional school degree: 0
- Doctorate degree: 0

Education attainment for females 25 years and older:
- No schooling: 40
- Nursery to 4th grade: 0
- 5th and 6th grade: 0
- 7th and 8th grade: 36
- 9th grade: 59
- 10th grade: 29
- 11th grade: 55
- 12th grade, no diploma: 78
- High school graduate (or equivalency): 1,750
- Less than 1 year of college: 432
- Some college more than 1 year, no degree: 1,018
- Associate degree: 581
- Bachelor's degree: 477
- Master's degree: 255
- Professional school degree: 102
- Doctorate degree: 112


Housing units in structures:
- One, detached: 4,465
- One, attached: 232
- Two: 297
- 3 or 4: 194
- 5 to 9: 339
- 10 to 19: 109
- 20 to 49: 212
- 50 or more: 261
- Mobile homes: 342
House/condo owner moved in on average 6 years ago
Renter moved in on average 0 years ago

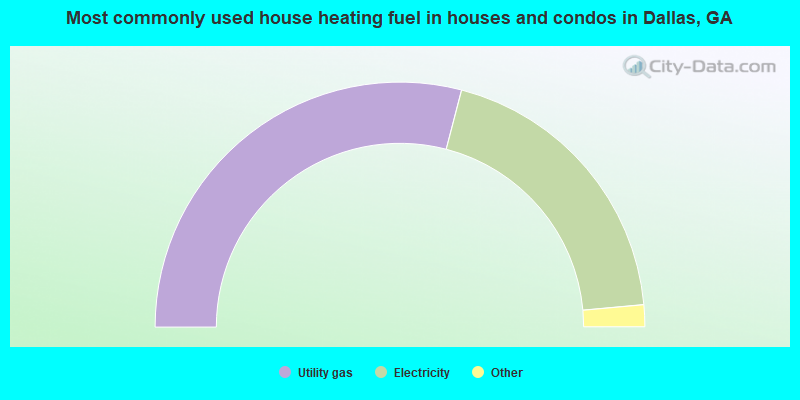
- 58.1%Utility gas
- 39.0%Electricity
- 1.7%Bottled, tank, or LP gas
- 1.1%Wood
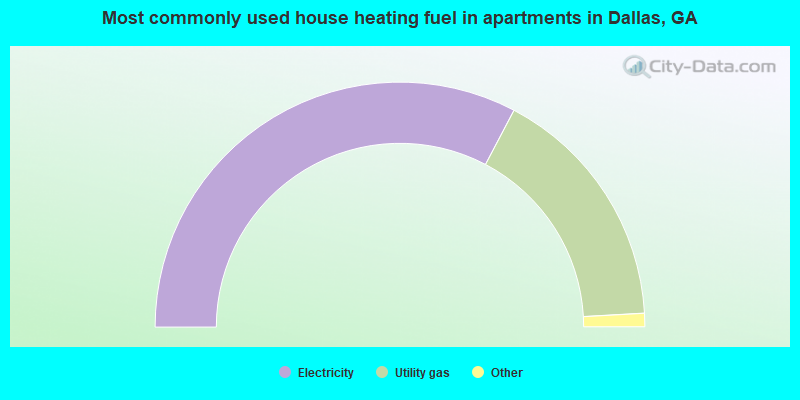
- 65.5%Electricity
- 32.8%Utility gas
- 1.2%No fuel used
- 0.5%Bottled, tank, or LP gas
Private vs. public school enrollment:
| Here: | 0.0% |
| Georgia: | 12.1% |
| Here: | 18.3% |
| Georgia: | 10.8% |
| Here: | 6.1% |
| Georgia: | 17.1% |


