Housing density: 469 houses/condos per square mile
Median price asked for vacant for-sale houses and condos in 2022 in this county: $275,451.
Median contract rent in 2022: $1,060 (lower quartile is $709, upper quartile is $1,434)
Median rent asked for vacant for-rent units in 2022: $1,031
Median gross rent in Cumberland, RI in 2022: $1,229
Housing units in Cumberland with a mortgage: 5,799 (461 second mortgage, 820 home equity loan, 10 both second mortgage and home equity loan) Houses without a mortgage: 2,396
In family households: 482,061 (90,167 male householders, 59,524 female householders)
98,652 spouses, 176,915 children (166,353 natural, 3,940 adopted, 6,622 stepchildren), 11,252 grandchildren, 7,716 brothers or sisters, 7,800 parents, foster children, 8,986 other relatives, 16,700 non-relatives
In nonfamily households: 116,821 (42,422 male householders (31,930 living alone)), 49,604 female householders (41,173 living alone)), 24,795 nonrelatives
In group quarters: 27,785 (9,688 institutionalized population)
87,776 married couples with children.
48,327 single-parent households (7,463 men, 40,864 women).
82.3% of residents of Cumberland speak English at home.
2.6% of residents speak Spanish at home (56% speak English very well, 19% speak English well, 17% speak English not well, 8% don't speak English at all).
13.8% of residents speak other Indo-European language at home (66% speak English very well, 20% speak English well, 11% speak English not well, 3% don't speak English at all).
1.1% of residents speak Asian or Pacific Island language at home (45% speak English very well, 43% speak English well, 7% speak English not well, 5% don't speak English at all).
0.2% of residents speak other language at home (80% speak English very well, 13% speak English well, 7% speak English not well).
Foreign born population: 4,029 (12.0%)
(77.7% of them are naturalized citizens)
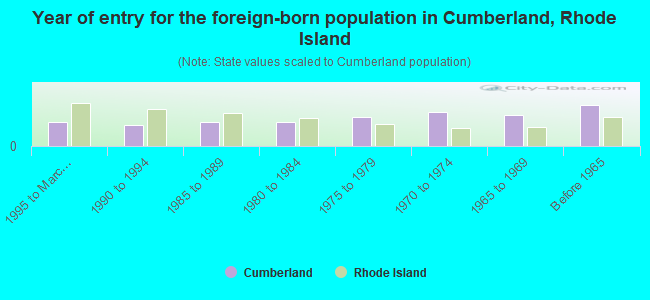
Year of entry for the foreign-born population in Cumberland, Rhode Island
3071995 to March 2000
2741990 to 1994
3141985 to 1989
3071980 to 1984
3721975 to 1979
4481970 to 1974
4091965 to 1969
533Before 1965
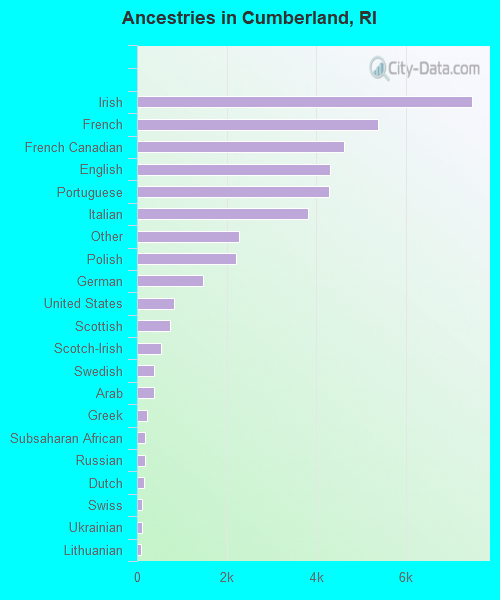
First ancestries reported:
Irish: 7,481 (18.7%)
French: 5,378 (13.5%)
French Canadian: 4,612 (11.5%)
English: 4,307 (10.8%)
Portuguese: 4,279 (10.7%)
Italian: 3,816 (9.5%)
Other: 2,278 (5.7%)
Polish: 2,215 (5.5%)
German: 1,464 (3.7%)
United States: 831 (2.1%)
Scottish: 739 (1.8%)
Scotch-Irish: 540 (1.4%)
Swedish: 375 (0.9%)
Arab: 374 (0.9%)
Greek: 227 (0.6%)
Subsaharan African: 184 (0.5%)
Russian: 181 (0.5%)
Dutch: 163 (0.4%)
Swiss: 119 (0.3%)
Ukrainian: 116 (0.3%)
Lithuanian: 89 (0.2%)
Norwegian: 52 (0.1%)
Slovak: 45 (0.1%)
Welsh: 38 (0.10%)
Danish: 29 (0.07%)
Hungarian: 24 (0.06%)
Czech: 23 (0.06%)
Most common places of birth for foreign-born residents (%):
Portugal
Cumberland:
47.7% (1,414)
Rhode Island:
17.6% (21,016)
Canada
Cumberland:
6.4% (189)
Rhode Island:
3.4% (4,015)
Colombia
Cumberland:
5.6% (165)
Rhode Island:
5.4% (6,496)
Guatemala
Cumberland:
4.3% (126)
Rhode Island:
7.6% (9,049)
China, excluding Hong Kong and Taiwan
Cumberland:
2.8% (84)
Rhode Island:
1.6% (1,954)
United Kingdom
Cumberland:
2.4% (70)
Rhode Island:
2.6% (3,120)
Poland
Cumberland:
2.3% (67)
Rhode Island:
1.2% (1,473)
Other Western Africa
Cumberland:
2.1% (62)
Rhode Island:
7.0% (8,389)
Philippines
Cumberland:
2.1% (61)
Rhode Island:
1.6% (1,936)
Laos
Cumberland:
2.0% (59)
Rhode Island:
2.2% (2,602)
Germany
Cumberland:
2.0% (59)
Rhode Island:
1.7% (1,982)
Dominican Republic
Cumberland:
1.7% (51)
Rhode Island:
13.7% (16,382)
Turkey
Cumberland:
1.5% (45)
Rhode Island:
0.4% (509)
Place of birth for U.S.-born residents:
This state: 21,811
Other state: 6,914
Northeast: 5,376
Midwest: 600
South: 655
West: 283
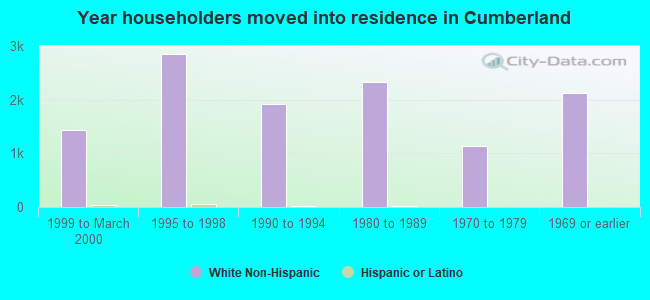
67% of Cumberland residents lived in the same house 5 years ago. Out of people who lived in different houses, 73% lived in this county. Out of people who lived in different counties, 18% lived in Rhode Island.
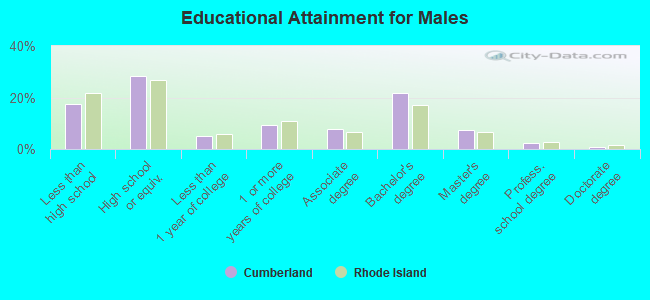
Education attainment for males 25 years and older:
No schooling: 131
Nursery to 4th grade: 153
5th and 6th grade: 140
7th and 8th grade: 296
9th grade: 288
10th grade: 260
11th grade: 236
12th grade, no diploma: 300
High school graduate (or equivalency): 2,939
Less than 1 year of college: 538
Some college more than 1 year, no degree: 955
Associate degree: 788
Bachelor's degree: 2,231
Master's degree: 746
Professional school degree: 231
Doctorate degree: 99
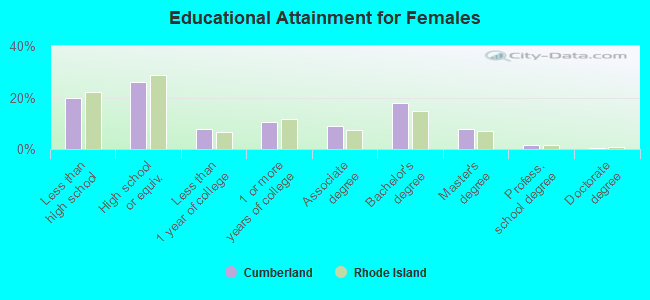
Education attainment for females 25 years and older:
No schooling: 150
Nursery to 4th grade: 140
5th and 6th grade: 143
7th and 8th grade: 578
9th grade: 411
10th grade: 433
11th grade: 220
12th grade, no diploma: 291
High school graduate (or equivalency): 3,120
Less than 1 year of college: 942
Some college more than 1 year, no degree: 1,269
Associate degree: 1,059
Bachelor's degree: 2,134
Master's degree: 944
Professional school degree: 167
Doctorate degree: 45
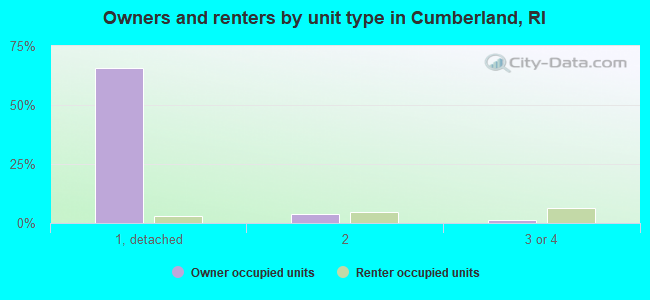
Housing units in structures:
One, detached: 8,543
One, attached: 471
Two: 1,083
3 or 4: 1,057
5 to 9: 353
10 to 19: 199
20 to 49: 86
50 or more: 727
Mobile homes: 53
Median worth of mobile homes: $237,665
Housing units lacking complete plumbing facilities: 0.4%
Housing units lacking complete kitchen facilities: 1.2%