Council Bluffs, IA (Iowa) Houses and Residents
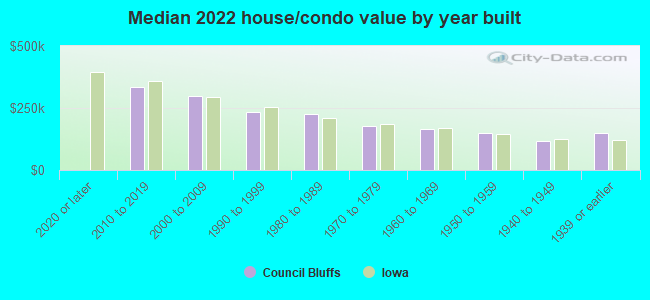
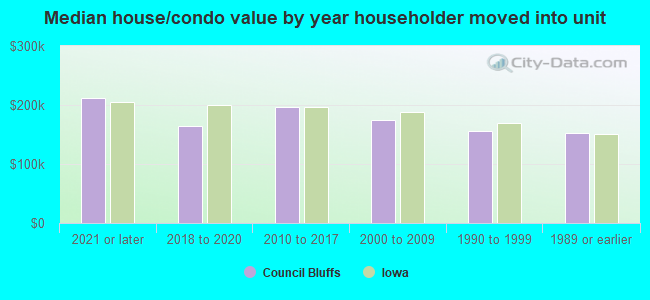
Estimated median house or condo value in 2022: $175,495 (it was $76,500 in 2000 )
Council Bluffs:
$175,495Iowa:
$194,600
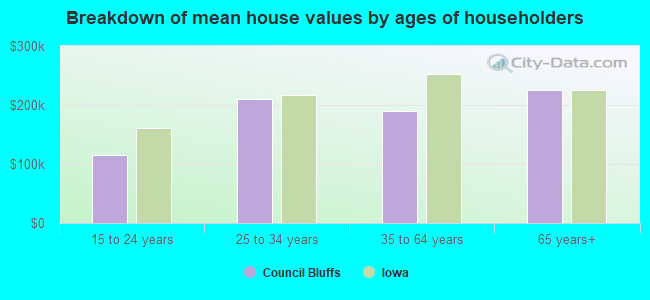
Lower value quartile - upper value quartile: $124,593 - $241,390Mean price in 2022: Detached houses: $202,232 Here:
$202,232State:
$245,224
Townhouses or other attached units: $229,439 Here:
$229,439State:
$238,767
In 2-unit structures: $100,693 Here:
$100,693State:
$243,070
In 3-to-4-unit structures: $263,627 Here:
$263,627State:
$162,139
In 5-or-more-unit structures: $198,683 Here:
$198,683State:
$190,519
Mobile homes: $34,758 Here:
$34,758State:
$51,271
Total population: 62,245 (Urban population: 57,699, Rural population: 550 (all nonfarm) )
Houses: 27,477 (25,609 occupied: 16,573 owner occupied, 9,570 renter occupied )
% of renters here:
37%State:
28%
Housing density: 735 houses/condos per square mile
Median price asked for vacant for-sale houses and condos in 2022: $140,202.
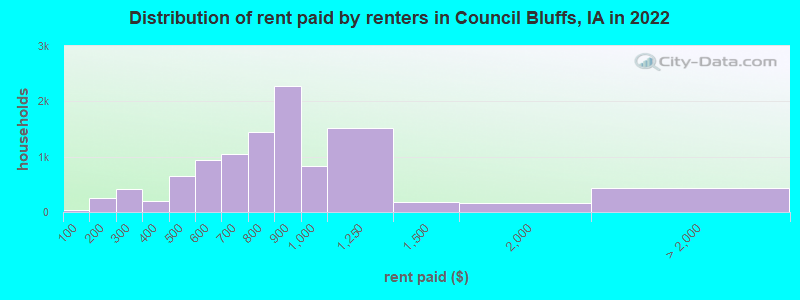
Median contract rent in 2022: $818 (lower quartile is $643, upper quartile is $943)
Median rent asked for vacant for-rent units in 2022: $802
Median gross rent in Council Bluffs, IA in 2022: $933
Housing units in Council Bluffs with a mortgage: 10,287 (572 second mortgage, 7 home equity loan, 378 both second mortgage and home equity loan )Houses without a mortgage: 565
Median household income for houses/condos with a mortgage: $99,208
Median household income for apartments without a mortgage: $53,625
Median monthly housing costs: $992
Data:
Median house or condo value ($)
Median house or condo value ($ change since 2000)
Median house or condo value ($) - White
Median house or condo value ($) - Black or African American
Median house or condo value ($) - Asian
Median house or condo value ($) - Hispanic or Latino
Median house or condo value ($) - American Indian and Alaska Native
Median house or condo value ($) - Multirace
Median house or condo value ($) - Other Race
Median price asked for mobile homes ($)
Household density (households per square mile)
Mean house or condo value by units in structure - 1, detached ($)
Mean house or condo value by units in structure - 1, attached ($)
Mean house or condo value by units in structure - 2 ($)
Mean house or condo value by units in structure by units in structure - 3 or 4 ($)
Mean house or condo value by units in structure - 5 or more ($)
Mean house or condo value by units in structure - Boat, RV, van, etc. ($)
Mean house or condo value by units in structure - Mobile home ($)
Median contract rent ($)
Median contract rent - Lower quartile ($)
Median contract rent - Upper quartile ($)
Median gross rent ($)
Urban houses (%)
Rural houses (%)
Houses occupied (%)
Houses occupied (% change since 2000)
Houses owner occupied (%)
Houses owner occupied (% change since 2000)
Houses renter occupied (%)
Houses renter occupied (% change since 2000)
Vacant housing units - For rent (%)
Vacant housing units - For rent (% change since 2000)
Vacant housing units - For sale only (%)
Vacant housing units - For sale only (% change since 2000)
Vacant housing units - Rented or sold, not occupied (%)
Vacant housing units - Rented or sold, not occupied (% change since 2000)
Vacant housing units - For seasonal, recreational, or occasional use (%)
Vacant housing units - For seasonal, recreational, or occasional use (% change since 2000)
Vacant housing units - For migrant workers (%)
Vacant housing units - For migrant workers (% change since 2000)
Vacant housing units - Other vacant (%)
Vacant housing units - Other vacant (% change since 2000)
Median monthly housing costs ($)
Median household income for houses/condos with a mortgage ($)
Median household income for houses/condos without a mortgage ($)
Median household income ($)
Median household income ($) - White
Median household income ($) - Black or African American
Median household income ($) - Asian
Median household income ($) - Hispanic or Latino
Median household income ($) - American Indian and Alaska Native
Median household income ($) - Multirace
Median household income ($) - Other Race
Mortgage status - with mortgage (%)
Mortgage status - with second mortgage (%)
Mortgage status - with home equity loan (%)
Mortgage status - with both second mortgage and home equity loan (%)
Mortgage status - without a mortgage (%)
Median year house/condo built
Median year apartment built
Household type by relationship - Male householder living alone (%)
Household type by relationship - Male householder not living alone (%)
Household type by relationship - Female householder living alone (%)
Household type by relationship - Female householder not living alone (%)
Household type by relationship - Opposite-Sex spouse (%)
Household type by relationship - Same-Sex spouse (%)
Household type by relationship - Opposite-Sex unmarried partner (%)
Household type by relationship - Same-Sex unmarried partner (%)
Household type by relationship - In group quarters (%)
Size of family households - 2-person household (%)
Size of family households - 3-person household (%)
Size of family households - 4-person household (%)
Size of family households - 5-person household (%)
Size of family households - 6-person household (%)
Size of family households - 7-or-more-person household (%)
Size of nonfamily households - 1-person household (%)
Size of nonfamily households - 2-person household (%)
Size of nonfamily households - 3-person household (%)
Size of nonfamily households - 4-person household (%)
Size of nonfamily households - 5-person household (%)
Size of nonfamily households - 6-person household (%)
Size of nonfamily households - 7-or-moreperson household (%)
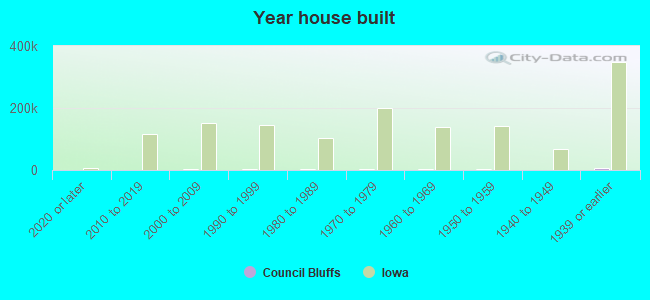
Year house built - Built 2010 or later (%)
Year house built - Built 2000 to 2009 (%)
Year house built - Built 1990 to 1999 (%)
Year house built - Built 1980 to 1989 (%)
Year house built - Built 1970 to 1979 (%)
Year house built - Built 1960 to 1969 (%)
Year house built - Built 1950 to 1959 (%)
Year house built - Built 1940 to 1949 (%)
Year house built - Built 1939 or earlier (%)
Median number of rooms in houses and condos
Median number of rooms in apartments
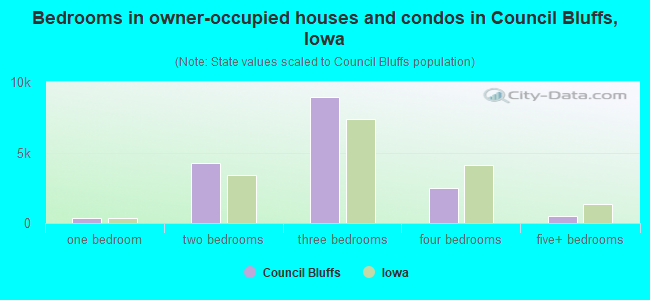
Median number of bedrooms in owner occupied houses
Mean number of bedrooms in owner occupied houses
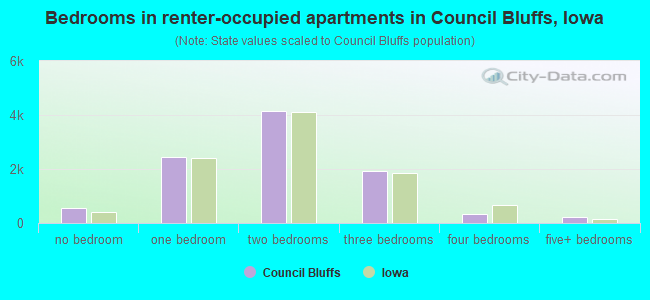
Median number of bedrooms in renter occupied houses
Mean number of bedrooms in renter occupied houses
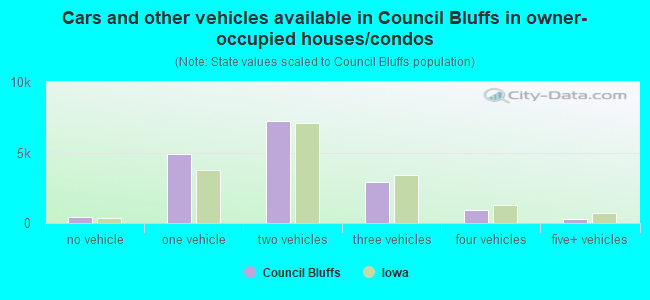
Median number of vehichles in owner occupied houses
Mean number of vehichles in owner occupied houses
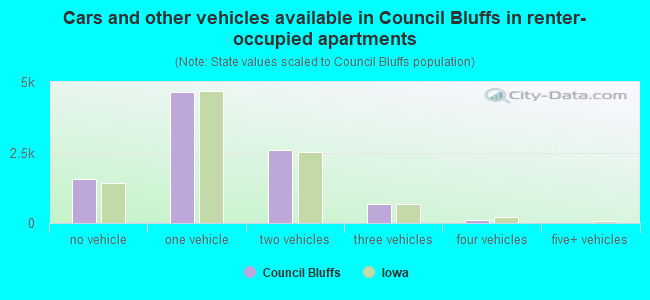
Median number of vehichles in renter occupied houses
Mean number of vehichles in renter occupied houses
Rooms in owner-occupied houses - 1 room (%)
Rooms in owner-occupied houses - 2 rooms (%)
Rooms in owner-occupied houses - 3 rooms (%)
Rooms in owner-occupied houses - 4 rooms (%)
Rooms in owner-occupied houses - 5 rooms (%)
Rooms in owner-occupied houses - 6 rooms (%)
Rooms in owner-occupied houses - 7 rooms (%)
Rooms in owner-occupied houses - 8 rooms (%)
Rooms in owner-occupied houses - 9+ rooms (%)
Rooms in renter-occupied houses - 1 room (%)
Rooms in renter-occupied houses - 2 rooms (%)
Rooms in renter-occupied houses - 3 rooms (%)
Rooms in renter-occupied houses - 4 rooms (%)
Rooms in renter-occupied houses - 5 rooms (%)
Rooms in renter-occupied houses - 6 rooms (%)
Rooms in renter-occupied houses - 7 rooms (%)
Rooms in renter-occupied houses - 8 rooms (%)
Rooms in renter-occupied houses - 9+ rooms (%)
Bedrooms in owner-occupied houses - no bedrooms (%)
Bedrooms in owner-occupied houses - 1 bedroom (%)
Bedrooms in owner-occupied houses - 2 bedrooms (%)
Bedrooms in owner-occupied houses - 3 bedrooms (%)
Bedrooms in owner-occupied houses - 4 bedrooms (%)
Bedrooms in owner-occupied houses - 5+ bedrooms (%)
Bedrooms in renter-occupied houses - no bedrooms (%)
Bedrooms in renter-occupied houses - 1 bedroom (%)
Bedrooms in renter-occupied houses - 2 bedrooms (%)
Bedrooms in renter-occupied houses - 3 bedrooms (%)
Bedrooms in renter-occupied houses - 4 bedrooms (%)
Bedrooms in renter-occupied houses - 5+ bedrooms (%)
Vehicles available in owner-occupied houses - no vehicle available (%)
Vehicles available in owner-occupied houses - 1 vehicle available(%)
Vehicles available in owner-occupied houses - 2 Vehicles available (%)
Vehicles available in owner-occupied houses - 3 Vehicles available (%)
Vehicles available in owner-occupied houses - 4 Vehicles available (%)
Vehicles available in owner-occupied houses - 5+ Vehicles available (%)
Vehicles available in renter-occupied houses - no vehicle available (%)
Vehicles available in renter-occupied houses - 1 vehicle available (%)
Vehicles available in renter-occupied houses - 2 Vehicles available (%)
Vehicles available in renter-occupied houses - 3 Vehicles available (%)
Vehicles available in renter-occupied houses - 4 Vehicles available (%)
Vehicles available in renter-occupied houses - 5+ Vehicles available (%)
Housing units in structures - 1, detached (%)
Housing units in structures - 1, attached (%)
Housing units in structures - 2 (%)
Housing units in structures - 3 or 4 (%)
Housing units in structures - 5 to 9 (%)
Housing units in structures - 10 to 19 (%)
Housing units in structures - 20 to 49 (%)
Housing units in structures - 50 or more (%)
Housing units in structures - Mobile home (%)
Housing units in structures - Boat, RV, van, etc. (%)
Housing units in structures - Owners - 1, detached (%)
Housing units in structures - Owners - 1, attached (%)
Housing units in structures - Owners - 2 (%)
Housing units in structures - Owners - 3 or 4 (%)
Housing units in structures - Owners - 5 to 9 (%)
Housing units in structures - Owners - 10 to 19 (%)
Housing units in structures - Owners - 20 to 49 (%)
Housing units in structures - Owners - 50 or more (%)
Housing units in structures - Owners - Mobile home (%)
Housing units in structures - Owners - Boat, RV, van, etc. (%)
Housing units in structures - Renters - 1, detached (%)
Housing units in structures - Renters - 1, attached (%)
Housing units in structures - Renters - 2 (%)
Housing units in structures - Renters - 3 or 4 (%)
Housing units in structures - Renters - 5 to 9 (%)
Housing units in structures - Renters - 10 to 19 (%)
Housing units in structures - Renters - 20 to 49 (%)
Housing units in structures - Renters - 50 or more (%)
Housing units in structures - Renters - Mobile home (%)
Housing units in structures - Renters - Boat, RV, van, etc. (%)
House/condo owner moved in on average (years ago)
Renter moved in on average (years ago)
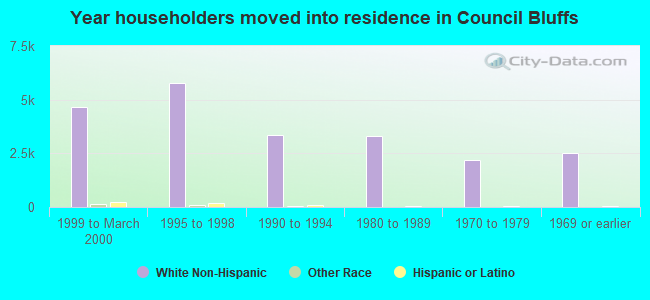
Year householder moved into unit - Moved in 1999 to March 2000 (%)
Year householder moved into unit - Moved in 1999 to March 2000 (%) - White
Year householder moved into unit - Moved in 1999 to March 2000 (%) - Black or African American
Year householder moved into unit - Moved in 1999 to March 2000 (%) - Asian
Year householder moved into unit - Moved in 1999 to March 2000 (%) - Hispanic or Latino
Year householder moved into unit - Moved in 1999 to March 2000 (%) - American Indian and Alaska Native
Year householder moved into unit - Moved in 1999 to March 2000 (%) - Multirace
Year householder moved into unit - Moved in 1999 to March 2000 (%) - Other Race
Year householder moved into unit - Moved in 1995 to 1998 (%)
Year householder moved into unit - Moved in 1995 to 1998 (%) - White
Year householder moved into unit - Moved in 1995 to 1998 (%) - Black or African American
Year householder moved into unit - Moved in 1995 to 1998 (%) - Asian
Year householder moved into unit - Moved in 1995 to 1998 (%) - Hispanic or Latino
Year householder moved into unit - Moved in 1995 to 1998 (%) - American Indian and Alaska Native
Year householder moved into unit - Moved in 1995 to 1998 (%) - Multirace
Year householder moved into unit - Moved in 1995 to 1998 (%) - Other Race
Year householder moved into unit - Moved in 1990 to 1994 (%)
Year householder moved into unit - Moved in 1990 to 1994 (%) - White
Year householder moved into unit - Moved in 1990 to 1994 (%) - Black or African American
Year householder moved into unit - Moved in 1990 to 1994 (%) - Asian
Year householder moved into unit - Moved in 1990 to 1994 (%) - Hispanic or Latino
Year householder moved into unit - Moved in 1990 to 1994 (%) - American Indian and Alaska Native
Year householder moved into unit - Moved in 1990 to 1994 (%) - Multirace
Year householder moved into unit - Moved in 1990 to 1994 (%) - Other Race
Year householder moved into unit - Moved in 1980 to 1989 (%)
Year householder moved into unit - Moved in 1980 to 1989 (%) - White
Year householder moved into unit - Moved in 1980 to 1989 (%) - Black or African American
Year householder moved into unit - Moved in 1980 to 1989 (%) - Asian
Year householder moved into unit - Moved in 1980 to 1989 (%) - Hispanic or Latino
Year householder moved into unit - Moved in 1980 to 1989 (%) - American Indian and Alaska Native
Year householder moved into unit - Moved in 1980 to 1989 (%) - Multirace
Year householder moved into unit - Moved in 1980 to 1989 (%) - Other Race
Year householder moved into unit - Moved in 1970 to 1979 (%)
Year householder moved into unit - Moved in 1970 to 1979 (%) - White
Year householder moved into unit - Moved in 1970 to 1979 (%) - Black or African American
Year householder moved into unit - Moved in 1970 to 1979 (%) - Asian
Year householder moved into unit - Moved in 1970 to 1979 (%) - Hispanic or Latino
Year householder moved into unit - Moved in 1970 to 1979 (%) - American Indian and Alaska Native
Year householder moved into unit - Moved in 1970 to 1979 (%) - Multirace
Year householder moved into unit - Moved in 1970 to 1979 (%) - Other Race
Year householder moved into unit - Moved in 1969 or earlier (%)
Year householder moved into unit - Moved in 1969 or earlier (%) - White
Year householder moved into unit - Moved in 1969 or earlier (%) - Black or African American
Year householder moved into unit - Moved in 1969 or earlier (%) - Asian
Year householder moved into unit - Moved in 1969 or earlier (%) - Hispanic or Latino
Year householder moved into unit - Moved in 1969 or earlier (%) - American Indian and Alaska Native
Year householder moved into unit - Moved in 1969 or earlier (%) - Multirace
Year householder moved into unit - Moved in 1969 or earlier (%) - Other Race
Housing units lacking complete plumbing facilities (%)
Housing units lacking complete kitchen facilities (%)
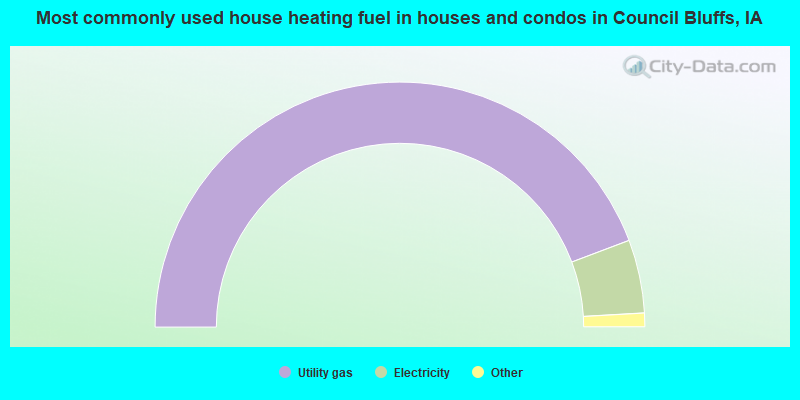
House heating fuel used in houses and condos - Utility gas (%)
House heating fuel used in houses and condos - Bottled, tank, or LP gas (%)
House heating fuel used in houses and condos - Electricity (%)
House heating fuel used in houses and condos - Fuel oil, kerosene, etc. (%)
House heating fuel used in houses and condos - Coal or coke (%)
House heating fuel used in houses and condos - Wood (%)
House heating fuel used in houses and condos - Solar energy (%)
House heating fuel used in houses and condos - Other fuel (%)
House heating fuel used in houses and condos - No fuel used (%)
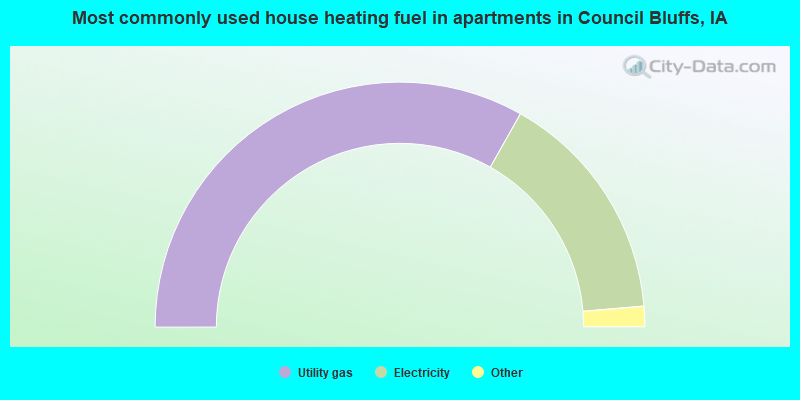
House heating fuel used in apartments - Utility gas (%)
House heating fuel used in apartments - Bottled, tank, or LP gas (%)
House heating fuel used in apartments - Electricity (%)
House heating fuel used in apartments - Fuel oil, kerosene, etc. (%)
House heating fuel used in apartments - Coal or coke (%)
House heating fuel used in apartments - Wood (%)
House heating fuel used in apartments - Solar energy (%)
House heating fuel used in apartments - Other fuel (%)
House heating fuel used in apartments - No fuel used (%)
Median year house/condo built: 1960Median year apartment built: 1971Household type by relationship:
Households: 62,422
Male householders: 11,587 (3,803 living alone ), Female householders: 13,790 (4,490 living alone )10,147 spouses (9,998 opposite-sex spouses ), 2,495 unmarried partners , (2,399 opposite-sex unmarried partners ), 17,009 children (15,967 natural , 497 adopted , 544 stepchildren ), 1,663 grandchildren , 457 brothers or sisters , 448 parents , 79 foster children , 736 other relatives , 2,044 non-relatives In group quarters: 1,962
Size of family households: 6,729 2-persons , 4,017 3-persons , 3,099 4-persons , 1,593 5-persons , 291 6-persons , 92 7-or-more-persons .
Size of nonfamily households: 7,719 1-person , 2,392 2-persons , 183 3-persons , 165 4-persons .
7,184 married couples with children. single-parent households (484 men , 3,899 women ).
92.0% of residents of Council Bluffs speak English at home. of residents speak Spanish at home (54% speak English very well , 24% speak English well , 14% speak English not well , 8% don't speak English at all ).of residents speak other Indo-European language at home (88% speak English very well , 12% speak English well ).of residents speak Asian or Pacific Island language at home (59% speak English very well , 17% speak English well , 25% speak English not well ).of residents speak other language at home (25% speak English very well , 59% speak English well , 15% speak English not well ).
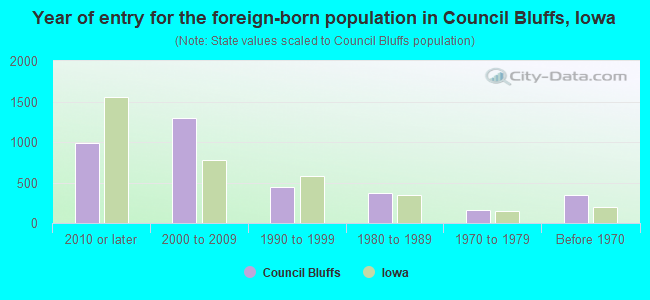
Foreign born population: 2,592 (4.2%)of them are naturalized citizens )
Median number of rooms in houses and condos:
Median number of rooms in apartments
Owner-occupied Renter-occupied
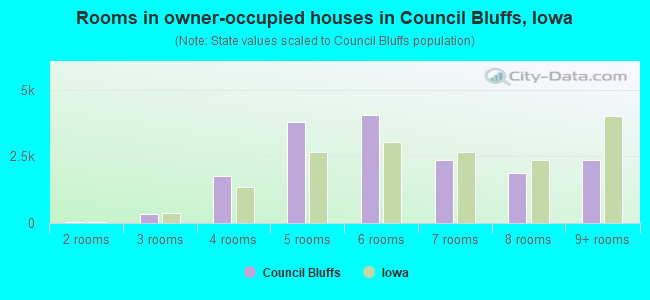
Rooms in owner-occupied houses in Council Bluffs, Iowa
6 1 room 23 2 rooms 323 3 rooms 1,759 4 rooms 3,807 5 rooms 4,059 6 rooms 2,352 7 rooms 1,884 8 rooms 2,361 9+ rooms
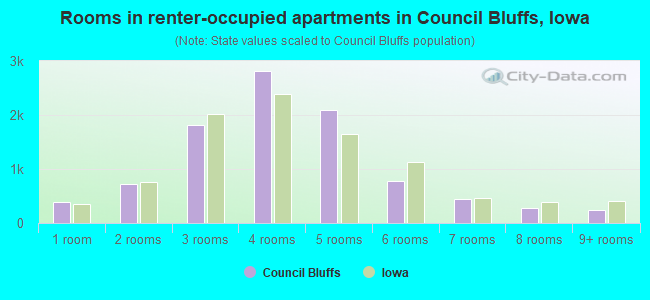
Rooms in renter-occupied apartments in Council Bluffs, Iowa
381 1 room 725 2 rooms 1,816 3 rooms 2,821 4 rooms 2,086 5 rooms 783 6 rooms 442 7 rooms 270 8 rooms 246 9+ rooms
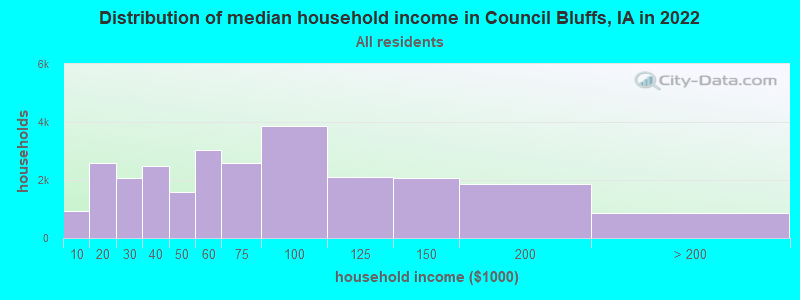
Council Bluffs, IA household income distribution 927 Less than $10,0002,602 $10,000 to $19,9992,062 $20,000 to $29,9992,485 $30,000 to $39,9991,578 $40,000 to $49,9993,023 $50,000 to $59,9992,594 $60,000 to $74,9993,853 $75,000 to $99,9992,103 $100,000 to $124,9992,083 $125,000 to $149,9991,861 $150,000 to $199,999868 $200,000 or more
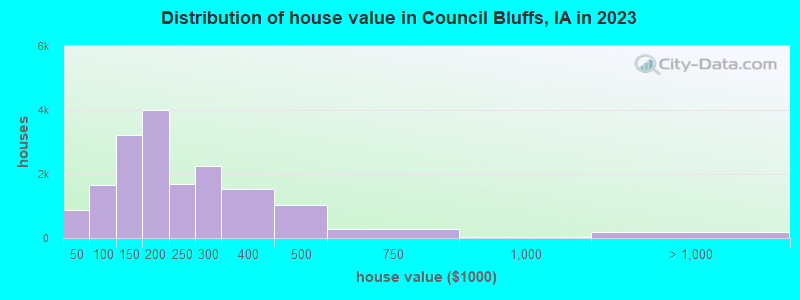
Home value of owner - occupied houses in 2022 in Council Bluffs, IA 164 Less than $10,000163 $10,000 to $14,999166 $15,000 to $19,999132 $20,000 to $24,999137 $25,000 to $29,999103 $30,000 to $34,99951 $35,000 to $39,999200 $40,000 to $49,999242 $50,000 to $59,999241 $60,000 to $69,999714 $70,000 to $79,999374 $80,000 to $89,999463 $90,000 to $99,9991,704 $100,000 to $124,9991,433 $125,000 to $149,9992,761 $150,000 to $174,9991,542 $175,000 to $199,9991,785 $200,000 to $249,9991,474 $250,000 to $299,9991,360 $300,000 to $399,999915 $400,000 to $499,99992 $500,000 to $749,99958 $750,000 to $999,9996 $1,000,000 to $1,499,99929 $2,000,000 or moreRent paid by renters in 2022 in Council Bluffs, IA 30 Less than $10024 $100 to $149220 $150 to $199139 $200 to $249269 $250 to $29996 $300 to $349101 $350 to $399552 $400 to $44991 $450 to $499486 $500 to $549457 $550 to $599484 $600 to $649563 $650 to $699684 $700 to $749755 $750 to $7992,286 $800 to $899838 $900 to $9991,526 $1,000 to $1,249171 $1,250 to $1,499162 $1,500 to $1,99948 $2,000 to $2,49912 $2,500 to $2,99987 $3,500 or more282 No cash rent
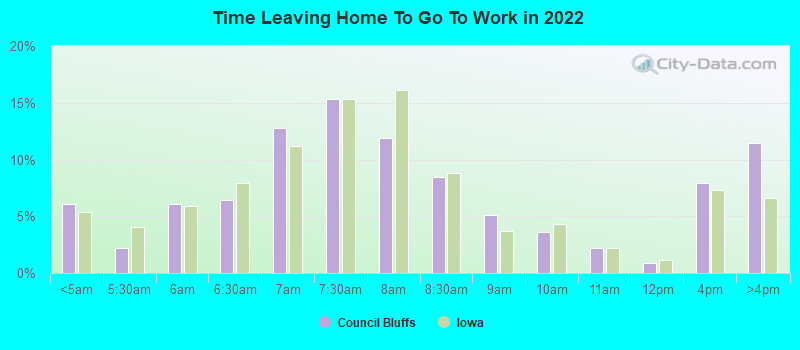
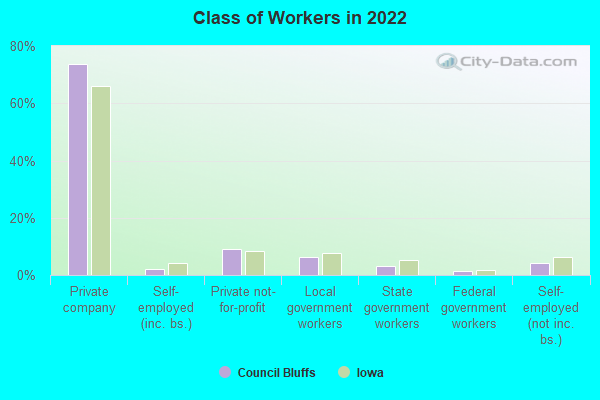
Percentage of workers working in this county: 60.2%Number of people working at home: 2,338 (7.6% of all workers )
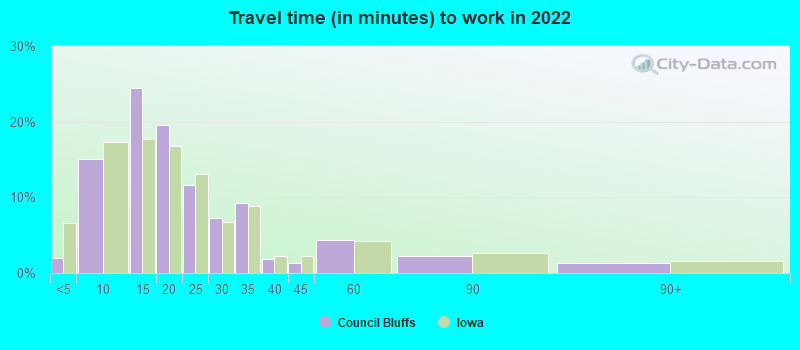
Travel time to work (commute)
Less than 5 minutes: 5345 to 9 minutes: 3,93710 to 14 minutes: 6,15215 to 19 minutes: 6,32120 to 24 minutes: 4,95125 to 29 minutes: 1,87830 to 34 minutes: 3,02935 to 39 minutes: 15240 to 44 minutes: 20545 to 59 minutes: 84660 to 89 minutes: 41790 or more minutes: 294
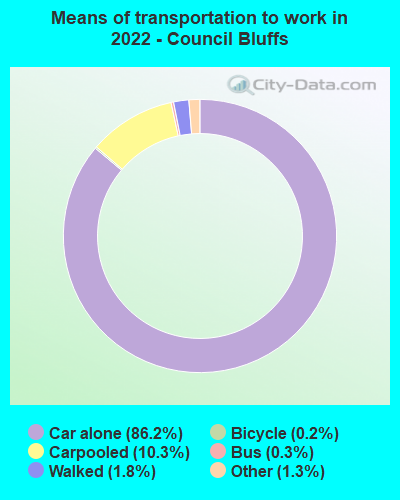
Means of transportation to work:
Drove a car alone: 23,343 (76.3%)Carpooled: 2,982 (9.7%)Bus : 49 (0.2%)Taxi: 489 (1.6%)Bicycle: 99 (0.3%)Walked: 748 (2.4%)Worked at home: 2,606 (8.5%)
Unemployment by race in 2022
Unemployment rate for White non-Hispanic residents 3.1% Males2.9% FemalesUnemployment rate for Black residents 4.3% Males6.1% FemalesUnemployment rate for Asian residents 5.7% MalesUnemployment rate for other race residents 4.0% Males1.4% FemalesUnemployment rate for two or more race residents 8.4% Males7.4% FemalesUnemployment rate for Hispanic or Latino residents 4.2% Males2.7% Females
Year of entry for the foreign-born population in Council Bluffs, Iowa
982 2010 or later 1,298 2000 to 2009 450 1990 to 1999 369 1980 to 1989 160 1970 to 1979 343 Before 1970
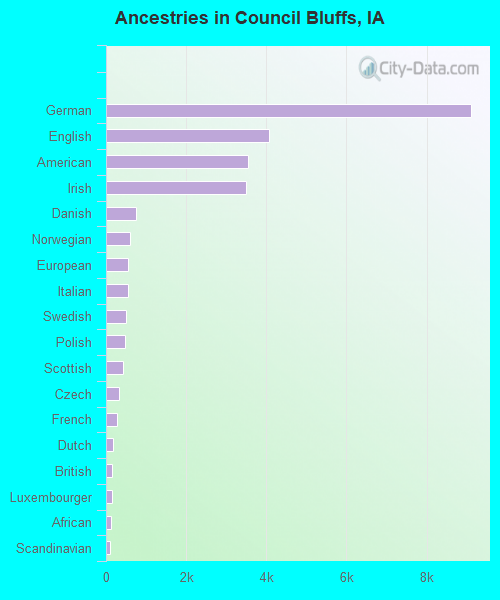
First ancestries reported:
German: 9,103 (27.5%)
English: 4,058 (12.3%)
American: 3,551 (10.7%)
Irish: 3,506 (10.6%)
Danish: 749 (2.3%)
Norwegian: 603 (1.8%)
European: 559 (1.7%)
Italian: 537 (1.6%)
Swedish: 488 (1.5%)
Polish: 486 (1.5%)
Scottish: 432 (1.3%)
Czech: 332 (1.0%)
French: 270 (0.8%)
Dutch: 181 (0.5%)
British: 155 (0.5%)
Luxembourger: 141 (0.4%)
African: 118 (0.4%)
Scandinavian: 88 (0.3%)
Icelander: 75 (0.2%)
Scotch-Irish: 54 (0.2%)
Croatian: 52 (0.2%)
Welsh: 46 (0.1%)
Greek: 44 (0.1%)
Hungarian: 37 (0.1%)
Ukrainian: 34 (0.1%)
Russian: 31 (0.09%)
Eastern European: 26 (0.08%)
Swiss: 16 (0.05%)
French Canadian: 15 (0.05%)
Sudanese: 15 (0.05%)
Portuguese: 13 (0.04%)
Romanian: 12 (0.04%)
Armenian: 11 (0.03%)
Iranian: 11 (0.03%)
Pennsylvania German: 11 (0.03%)
Estonian: 8 (0.02%)
Northern European: 7 (0.02%)
Moroccan: 6 (0.02%)
Serbian: 3 (0.01%)
Czechoslovakian: 2 (0.01%) Most common places of birth for foreign-born residents (%): Mexico Council Bluffs:
52.8% (1,683)Iowa:
23.3% (41,625)
China, excluding Hong Kong and Taiwan Council Bluffs:
6.6% (210)Iowa:
4.6% (8,194)
Other Eastern Africa Council Bluffs:
5.3% (170)Iowa:
1.4% (2,422)
Thailand Council Bluffs:
3.8% (122)Iowa:
2.0% (3,595)
Guatemala Council Bluffs:
3.5% (113)Iowa:
3.2% (5,672)
Philippines Council Bluffs:
3.1% (99)Iowa:
2.6% (4,675)
India Council Bluffs:
2.6% (83)Iowa:
6.2% (11,148)
Vietnam Council Bluffs:
2.5% (81)Iowa:
4.2% (7,428)
Cuba Council Bluffs:
2.1% (68)Iowa:
0.8% (1,342)
Honduras Council Bluffs:
1.9% (61)Iowa:
1.0% (1,803)
Korea Council Bluffs:
1.6% (50)Iowa:
2.9% (5,155)
Place of birth for U.S.-born residents:
This state: 32,682Other state: 26,234Northeast: 1,020Midwest: 19,972South: 2,389West: 2,877 86.6% of Council Bluffs residents lived in the same house 1 years ago.
Out of people who lived in different houses, 37.1% lived in this county.
Out of people who lived in different counties, 45.3% lived in Iowa.
Council Bluffs:
86.6%State average:
87.2%
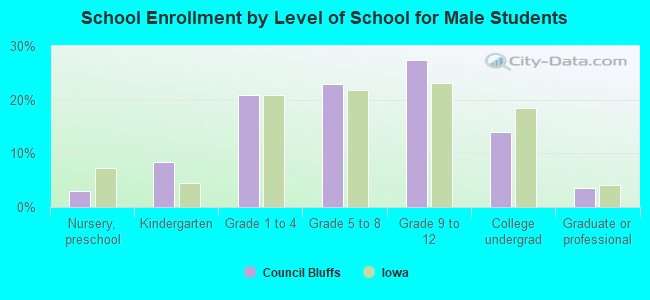
Education attainment for males 25 years and older:
No schooling: 434Nursery to 4th grade: 305th and 6th grade: 847th and 8th grade: 1529th grade: 18010th grade: 34811th grade: 94012th grade, no diploma: 996High school graduate (or equivalency): 7,154Less than 1 year of college: 1,991Some college more than 1 year, no degree: 2,572Associate degree: 1,954Bachelor's degree: 3,184Master's degree: 1,008Professional school degree: 329Doctorate degree: 217
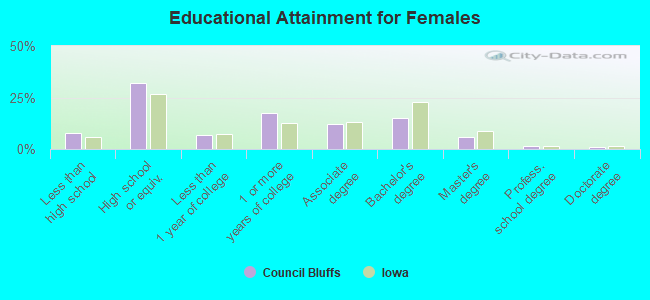
Education attainment for females 25 years and older:
No schooling: 255Nursery to 4th grade: 505th and 6th grade: 367th and 8th grade: 2939th grade: 13410th grade: 23311th grade: 50812th grade, no diploma: 170High school graduate (or equivalency): 6,967Less than 1 year of college: 1,459Some college more than 1 year, no degree: 3,786Associate degree: 2,632Bachelor's degree: 3,294Master's degree: 1,276Professional school degree: 360Doctorate degree: 160
Housing units in structures:
One, detached: 18,871One, attached: 645Two: 6953 or 4: 9395 to 9: 1,25710 to 19: 1,60020 to 49: 1,02850 or more: 1,112Mobile homes: 1,304Boats, RVs, vans, etc.: 22Median worth of mobile homes: $19,979
Housing units lacking complete plumbing facilities in 2022: 0.5%Housing units lacking complete kitchen facilities in 2022: 2.9%House/condo owner moved in on average 13 years ago
Renter moved in on average 2 years ago
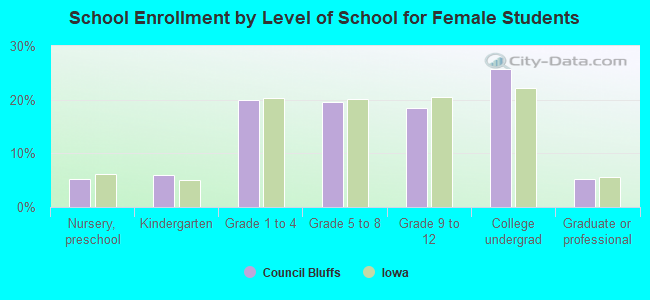
Private vs. public school enrollment:
Students in private schools in grades 1 to 8 (elementary and middle school): 246 Students in private schools in grades 9 to 12 (high school): 282 Students in private undergraduate colleges: 487