Cedar Park, TX (Texas) Houses and Residents
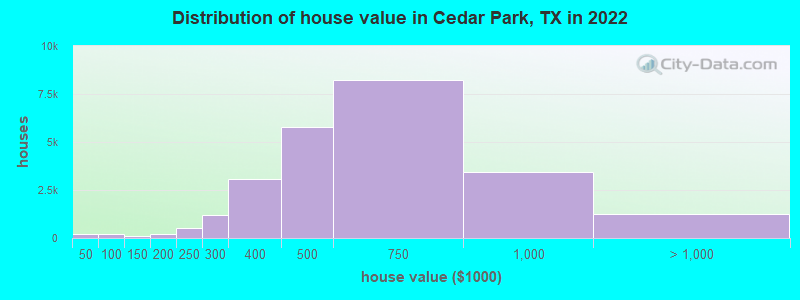
Estimated median house or condo value in 2022: $569,500 (it was $126,600 in 2000 )
Cedar Park:
$569,500Texas:
$275,400
Lower value quartile - upper value quartile: $420,700 - $761,800Mean price in 2022: Detached houses: $603,826 Here:
$603,826State:
$369,058
Townhouses or other attached units: $322,031 Here:
$322,031State:
$327,631
Mobile homes: $210,542 Here:
$210,542State:
$124,413
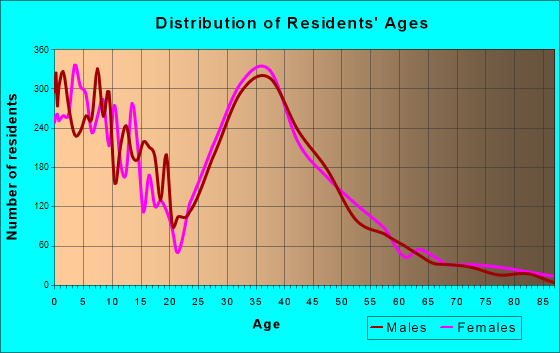
Total population: 63,574 (Urban population: 25,418, Rural population: 358 (all nonfarm) )
Houses: 30,809 (30,713 occupied: 19,654 owner occupied, 11,059 renter occupied )
% of renters here:
36%State:
38%
Housing density: 1,815 houses/condos per square mile
Median price asked for vacant for-sale houses and condos in 2022: $467,804.
Median contract rent in 2022: $1,661 (lower quartile is $1,242, upper quartile is $1,954)
Median rent asked for vacant for-rent units in 2022: $688
Median gross rent in Cedar Park, TX in 2022: $1,764
Housing units in Cedar Park with a mortgage: 14,571 (1,273 second mortgage, 0 home equity loan, 905 both second mortgage and home equity loan )Houses without a mortgage: 0
Median household income for houses/condos with a mortgage: $161,346
Median household income for apartments without a mortgage: $136,660
Median monthly housing costs: $1,984
Data:
Median house or condo value ($)
Median house or condo value ($ change since 2000)
Median house or condo value ($) - White
Median house or condo value ($) - Black or African American
Median house or condo value ($) - Asian
Median house or condo value ($) - Hispanic or Latino
Median house or condo value ($) - American Indian and Alaska Native
Median house or condo value ($) - Multirace
Median house or condo value ($) - Other Race
Median price asked for mobile homes ($)
Household density (households per square mile)
Mean house or condo value by units in structure - 1, detached ($)
Mean house or condo value by units in structure - 1, attached ($)
Mean house or condo value by units in structure - 2 ($)
Mean house or condo value by units in structure by units in structure - 3 or 4 ($)
Mean house or condo value by units in structure - 5 or more ($)
Mean house or condo value by units in structure - Boat, RV, van, etc. ($)
Mean house or condo value by units in structure - Mobile home ($)
Median contract rent ($)
Median contract rent - Lower quartile ($)
Median contract rent - Upper quartile ($)
Median gross rent ($)
Urban houses (%)
Rural houses (%)
Houses occupied (%)
Houses occupied (% change since 2000)
Houses owner occupied (%)
Houses owner occupied (% change since 2000)
Houses renter occupied (%)
Houses renter occupied (% change since 2000)
Vacant housing units - For rent (%)
Vacant housing units - For rent (% change since 2000)
Vacant housing units - For sale only (%)
Vacant housing units - For sale only (% change since 2000)
Vacant housing units - Rented or sold, not occupied (%)
Vacant housing units - Rented or sold, not occupied (% change since 2000)
Vacant housing units - For seasonal, recreational, or occasional use (%)
Vacant housing units - For seasonal, recreational, or occasional use (% change since 2000)
Vacant housing units - For migrant workers (%)
Vacant housing units - For migrant workers (% change since 2000)
Vacant housing units - Other vacant (%)
Vacant housing units - Other vacant (% change since 2000)
Median monthly housing costs ($)
Median household income for houses/condos with a mortgage ($)
Median household income for houses/condos without a mortgage ($)
Median household income ($)
Median household income ($) - White
Median household income ($) - Black or African American
Median household income ($) - Asian
Median household income ($) - Hispanic or Latino
Median household income ($) - American Indian and Alaska Native
Median household income ($) - Multirace
Median household income ($) - Other Race
Mortgage status - with mortgage (%)
Mortgage status - with second mortgage (%)
Mortgage status - with home equity loan (%)
Mortgage status - with both second mortgage and home equity loan (%)
Mortgage status - without a mortgage (%)
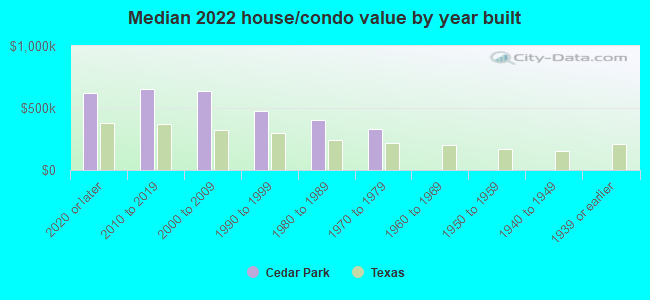
Median year house/condo built
Median year apartment built
Household type by relationship - Male householder living alone (%)
Household type by relationship - Male householder not living alone (%)
Household type by relationship - Female householder living alone (%)
Household type by relationship - Female householder not living alone (%)
Household type by relationship - Opposite-Sex spouse (%)
Household type by relationship - Same-Sex spouse (%)
Household type by relationship - Opposite-Sex unmarried partner (%)
Household type by relationship - Same-Sex unmarried partner (%)
Household type by relationship - In group quarters (%)
Size of family households - 2-person household (%)
Size of family households - 3-person household (%)
Size of family households - 4-person household (%)
Size of family households - 5-person household (%)
Size of family households - 6-person household (%)
Size of family households - 7-or-more-person household (%)
Size of nonfamily households - 1-person household (%)
Size of nonfamily households - 2-person household (%)
Size of nonfamily households - 3-person household (%)
Size of nonfamily households - 4-person household (%)
Size of nonfamily households - 5-person household (%)
Size of nonfamily households - 6-person household (%)
Size of nonfamily households - 7-or-moreperson household (%)
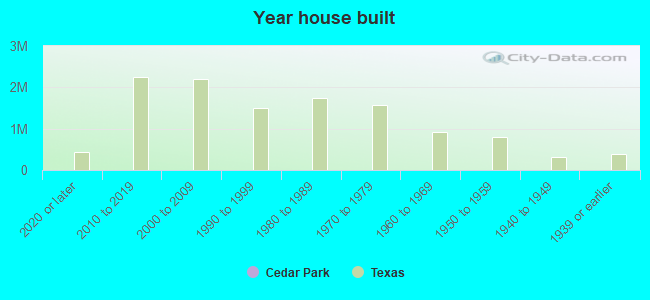
Year house built - Built 2010 or later (%)
Year house built - Built 2000 to 2009 (%)
Year house built - Built 1990 to 1999 (%)
Year house built - Built 1980 to 1989 (%)
Year house built - Built 1970 to 1979 (%)
Year house built - Built 1960 to 1969 (%)
Year house built - Built 1950 to 1959 (%)
Year house built - Built 1940 to 1949 (%)
Year house built - Built 1939 or earlier (%)
Median number of rooms in houses and condos
Median number of rooms in apartments
Median number of bedrooms in owner occupied houses
Mean number of bedrooms in owner occupied houses
Median number of bedrooms in renter occupied houses
Mean number of bedrooms in renter occupied houses
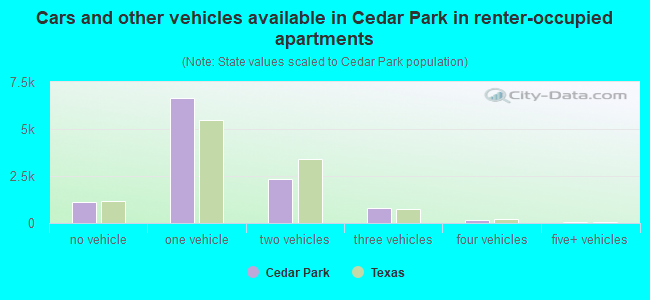
Median number of vehichles in owner occupied houses
Mean number of vehichles in owner occupied houses
Median number of vehichles in renter occupied houses
Mean number of vehichles in renter occupied houses
Rooms in owner-occupied houses - 1 room (%)
Rooms in owner-occupied houses - 2 rooms (%)
Rooms in owner-occupied houses - 3 rooms (%)
Rooms in owner-occupied houses - 4 rooms (%)
Rooms in owner-occupied houses - 5 rooms (%)
Rooms in owner-occupied houses - 6 rooms (%)
Rooms in owner-occupied houses - 7 rooms (%)
Rooms in owner-occupied houses - 8 rooms (%)
Rooms in owner-occupied houses - 9+ rooms (%)
Rooms in renter-occupied houses - 1 room (%)
Rooms in renter-occupied houses - 2 rooms (%)
Rooms in renter-occupied houses - 3 rooms (%)
Rooms in renter-occupied houses - 4 rooms (%)
Rooms in renter-occupied houses - 5 rooms (%)
Rooms in renter-occupied houses - 6 rooms (%)
Rooms in renter-occupied houses - 7 rooms (%)
Rooms in renter-occupied houses - 8 rooms (%)
Rooms in renter-occupied houses - 9+ rooms (%)
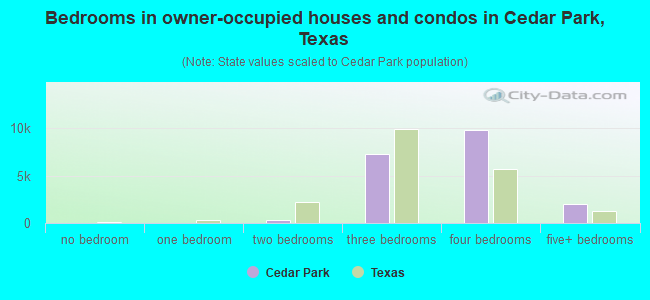
Bedrooms in owner-occupied houses - no bedrooms (%)
Bedrooms in owner-occupied houses - 1 bedroom (%)
Bedrooms in owner-occupied houses - 2 bedrooms (%)
Bedrooms in owner-occupied houses - 3 bedrooms (%)
Bedrooms in owner-occupied houses - 4 bedrooms (%)
Bedrooms in owner-occupied houses - 5+ bedrooms (%)
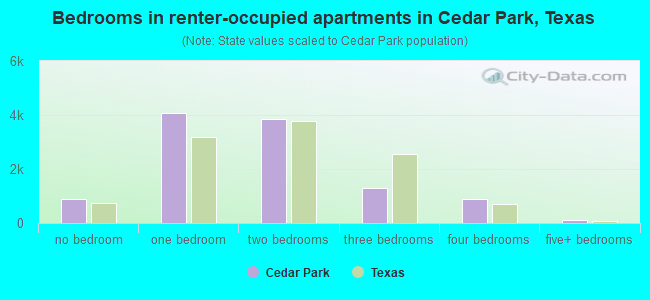
Bedrooms in renter-occupied houses - no bedrooms (%)
Bedrooms in renter-occupied houses - 1 bedroom (%)
Bedrooms in renter-occupied houses - 2 bedrooms (%)
Bedrooms in renter-occupied houses - 3 bedrooms (%)
Bedrooms in renter-occupied houses - 4 bedrooms (%)
Bedrooms in renter-occupied houses - 5+ bedrooms (%)
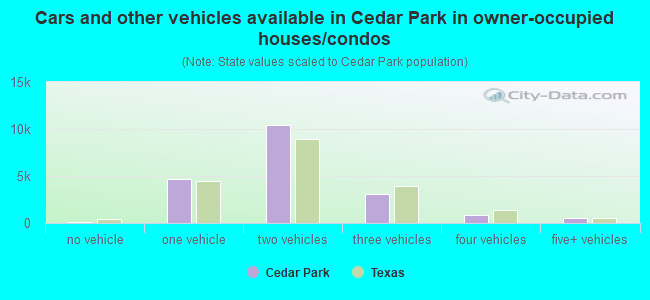
Vehicles available in owner-occupied houses - no vehicle available (%)
Vehicles available in owner-occupied houses - 1 vehicle available(%)
Vehicles available in owner-occupied houses - 2 Vehicles available (%)
Vehicles available in owner-occupied houses - 3 Vehicles available (%)
Vehicles available in owner-occupied houses - 4 Vehicles available (%)
Vehicles available in owner-occupied houses - 5+ Vehicles available (%)
Vehicles available in renter-occupied houses - no vehicle available (%)
Vehicles available in renter-occupied houses - 1 vehicle available (%)
Vehicles available in renter-occupied houses - 2 Vehicles available (%)
Vehicles available in renter-occupied houses - 3 Vehicles available (%)
Vehicles available in renter-occupied houses - 4 Vehicles available (%)
Vehicles available in renter-occupied houses - 5+ Vehicles available (%)
Housing units in structures - 1, detached (%)
Housing units in structures - 1, attached (%)
Housing units in structures - 2 (%)
Housing units in structures - 3 or 4 (%)
Housing units in structures - 5 to 9 (%)
Housing units in structures - 10 to 19 (%)
Housing units in structures - 20 to 49 (%)
Housing units in structures - 50 or more (%)
Housing units in structures - Mobile home (%)
Housing units in structures - Boat, RV, van, etc. (%)
Housing units in structures - Owners - 1, detached (%)
Housing units in structures - Owners - 1, attached (%)
Housing units in structures - Owners - 2 (%)
Housing units in structures - Owners - 3 or 4 (%)
Housing units in structures - Owners - 5 to 9 (%)
Housing units in structures - Owners - 10 to 19 (%)
Housing units in structures - Owners - 20 to 49 (%)
Housing units in structures - Owners - 50 or more (%)
Housing units in structures - Owners - Mobile home (%)
Housing units in structures - Owners - Boat, RV, van, etc. (%)
Housing units in structures - Renters - 1, detached (%)
Housing units in structures - Renters - 1, attached (%)
Housing units in structures - Renters - 2 (%)
Housing units in structures - Renters - 3 or 4 (%)
Housing units in structures - Renters - 5 to 9 (%)
Housing units in structures - Renters - 10 to 19 (%)
Housing units in structures - Renters - 20 to 49 (%)
Housing units in structures - Renters - 50 or more (%)
Housing units in structures - Renters - Mobile home (%)
Housing units in structures - Renters - Boat, RV, van, etc. (%)
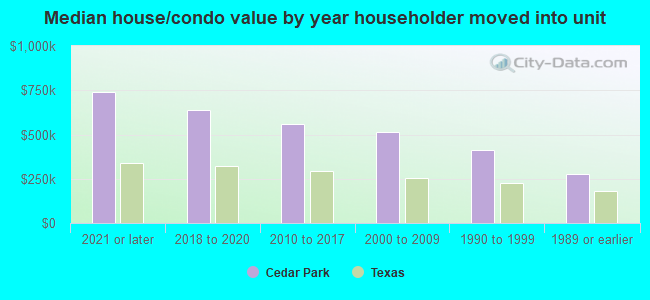
House/condo owner moved in on average (years ago)
Renter moved in on average (years ago)
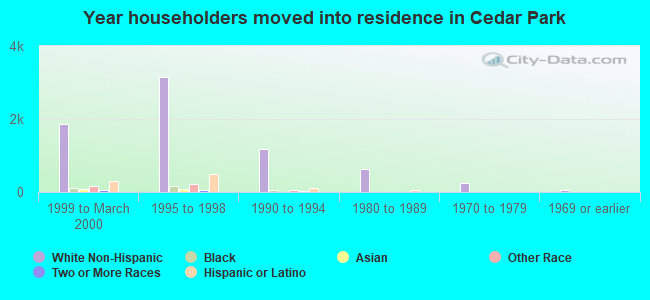
Year householder moved into unit - Moved in 1999 to March 2000 (%)
Year householder moved into unit - Moved in 1999 to March 2000 (%) - White
Year householder moved into unit - Moved in 1999 to March 2000 (%) - Black or African American
Year householder moved into unit - Moved in 1999 to March 2000 (%) - Asian
Year householder moved into unit - Moved in 1999 to March 2000 (%) - Hispanic or Latino
Year householder moved into unit - Moved in 1999 to March 2000 (%) - American Indian and Alaska Native
Year householder moved into unit - Moved in 1999 to March 2000 (%) - Multirace
Year householder moved into unit - Moved in 1999 to March 2000 (%) - Other Race
Year householder moved into unit - Moved in 1995 to 1998 (%)
Year householder moved into unit - Moved in 1995 to 1998 (%) - White
Year householder moved into unit - Moved in 1995 to 1998 (%) - Black or African American
Year householder moved into unit - Moved in 1995 to 1998 (%) - Asian
Year householder moved into unit - Moved in 1995 to 1998 (%) - Hispanic or Latino
Year householder moved into unit - Moved in 1995 to 1998 (%) - American Indian and Alaska Native
Year householder moved into unit - Moved in 1995 to 1998 (%) - Multirace
Year householder moved into unit - Moved in 1995 to 1998 (%) - Other Race
Year householder moved into unit - Moved in 1990 to 1994 (%)
Year householder moved into unit - Moved in 1990 to 1994 (%) - White
Year householder moved into unit - Moved in 1990 to 1994 (%) - Black or African American
Year householder moved into unit - Moved in 1990 to 1994 (%) - Asian
Year householder moved into unit - Moved in 1990 to 1994 (%) - Hispanic or Latino
Year householder moved into unit - Moved in 1990 to 1994 (%) - American Indian and Alaska Native
Year householder moved into unit - Moved in 1990 to 1994 (%) - Multirace
Year householder moved into unit - Moved in 1990 to 1994 (%) - Other Race
Year householder moved into unit - Moved in 1980 to 1989 (%)
Year householder moved into unit - Moved in 1980 to 1989 (%) - White
Year householder moved into unit - Moved in 1980 to 1989 (%) - Black or African American
Year householder moved into unit - Moved in 1980 to 1989 (%) - Asian
Year householder moved into unit - Moved in 1980 to 1989 (%) - Hispanic or Latino
Year householder moved into unit - Moved in 1980 to 1989 (%) - American Indian and Alaska Native
Year householder moved into unit - Moved in 1980 to 1989 (%) - Multirace
Year householder moved into unit - Moved in 1980 to 1989 (%) - Other Race
Year householder moved into unit - Moved in 1970 to 1979 (%)
Year householder moved into unit - Moved in 1970 to 1979 (%) - White
Year householder moved into unit - Moved in 1970 to 1979 (%) - Black or African American
Year householder moved into unit - Moved in 1970 to 1979 (%) - Asian
Year householder moved into unit - Moved in 1970 to 1979 (%) - Hispanic or Latino
Year householder moved into unit - Moved in 1970 to 1979 (%) - American Indian and Alaska Native
Year householder moved into unit - Moved in 1970 to 1979 (%) - Multirace
Year householder moved into unit - Moved in 1970 to 1979 (%) - Other Race
Year householder moved into unit - Moved in 1969 or earlier (%)
Year householder moved into unit - Moved in 1969 or earlier (%) - White
Year householder moved into unit - Moved in 1969 or earlier (%) - Black or African American
Year householder moved into unit - Moved in 1969 or earlier (%) - Asian
Year householder moved into unit - Moved in 1969 or earlier (%) - Hispanic or Latino
Year householder moved into unit - Moved in 1969 or earlier (%) - American Indian and Alaska Native
Year householder moved into unit - Moved in 1969 or earlier (%) - Multirace
Year householder moved into unit - Moved in 1969 or earlier (%) - Other Race
Housing units lacking complete plumbing facilities (%)
Housing units lacking complete kitchen facilities (%)
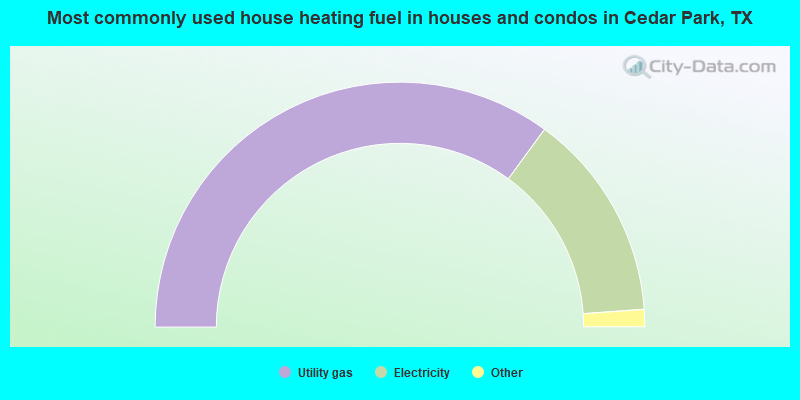
House heating fuel used in houses and condos - Utility gas (%)
House heating fuel used in houses and condos - Bottled, tank, or LP gas (%)
House heating fuel used in houses and condos - Electricity (%)
House heating fuel used in houses and condos - Fuel oil, kerosene, etc. (%)
House heating fuel used in houses and condos - Coal or coke (%)
House heating fuel used in houses and condos - Wood (%)
House heating fuel used in houses and condos - Solar energy (%)
House heating fuel used in houses and condos - Other fuel (%)
House heating fuel used in houses and condos - No fuel used (%)
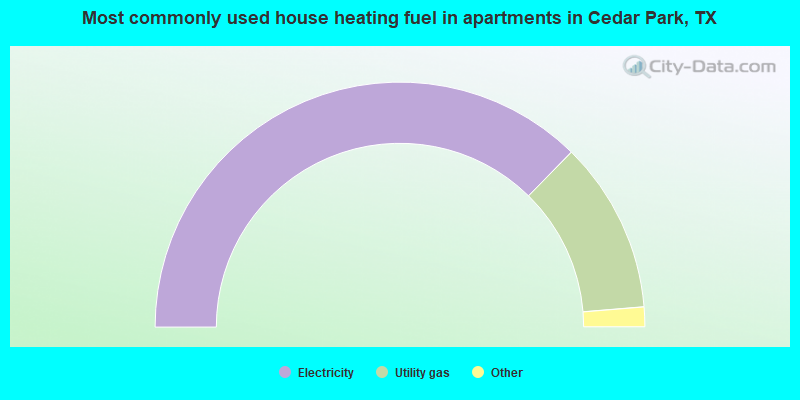
House heating fuel used in apartments - Utility gas (%)
House heating fuel used in apartments - Bottled, tank, or LP gas (%)
House heating fuel used in apartments - Electricity (%)
House heating fuel used in apartments - Fuel oil, kerosene, etc. (%)
House heating fuel used in apartments - Coal or coke (%)
House heating fuel used in apartments - Wood (%)
House heating fuel used in apartments - Solar energy (%)
House heating fuel used in apartments - Other fuel (%)
House heating fuel used in apartments - No fuel used (%)
Median year house/condo built: 2006Median year apartment built: 2006Household type by relationship:
Households: 80,212
Male householders: 19,282 (3,271 living alone ), Female householders: 11,431 (3,731 living alone )16,870 spouses (16,521 opposite-sex spouses ), 758 unmarried partners , (663 opposite-sex unmarried partners ), 26,467 children (25,248 natural , 873 adopted , 346 stepchildren ), 383 grandchildren , 692 brothers or sisters , 1,714 parents , 0 foster children , 323 other relatives , 1,540 non-relatives In group quarters: 752
Size of family households: 9,422 2-persons , 3,926 3-persons , 7,305 4-persons , 1,203 5-persons , 668 6-persons , 137 7-or-more-persons .
Size of nonfamily households: 7,002 1-person , 649 2-persons , 356 3-persons , 45 4-persons .
17,065 married couples with children. single-parent households (1,745 men , 2,315 women ).
73.0% of residents of Cedar Park speak English at home. of residents speak Spanish at home (71% speak English very well , 15% speak English well , 9% speak English not well , 4% don't speak English at all ).of residents speak other Indo-European language at home (83% speak English very well , 14% speak English well , 3% speak English not well ).of residents speak Asian or Pacific Island language at home (72% speak English very well , 18% speak English well , 10% speak English not well , 1% don't speak English at all ).of residents speak other language at home (92% speak English very well , 8% speak English well ).
Foreign born population: 18,497 (23.1%)of them are naturalized citizens )
Median number of rooms in houses and condos:
Median number of rooms in apartments
Owner-occupied Renter-occupied
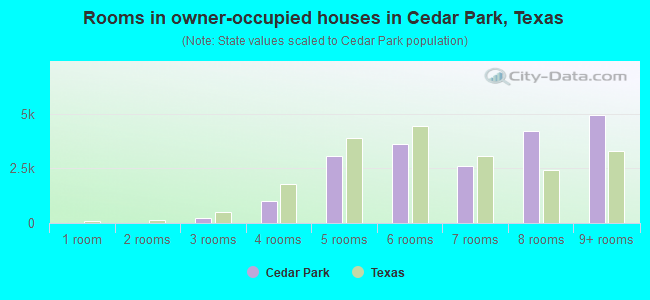
Rooms in owner-occupied houses in Cedar Park, Texas
0 1 room 0 2 rooms 211 3 rooms 1,010 4 rooms 3,056 5 rooms 3,605 6 rooms 2,609 7 rooms 4,226 8 rooms 4,937 9+ rooms
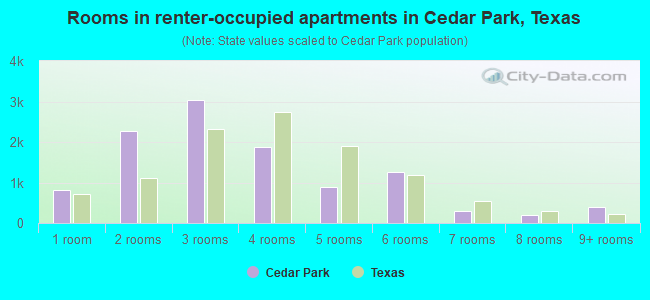
Rooms in renter-occupied apartments in Cedar Park, Texas
808 1 room 2,269 2 rooms 3,042 3 rooms 1,885 4 rooms 884 5 rooms 1,271 6 rooms 303 7 rooms 207 8 rooms 390 9+ rooms
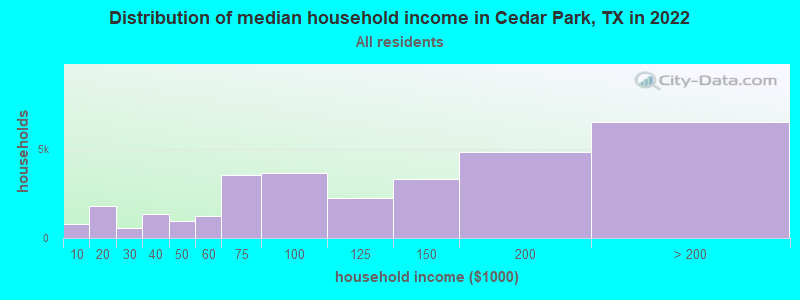
Cedar Park, TX household income distribution 792 Less than $10,0001,773 $10,000 to $19,999562 $20,000 to $29,9991,371 $30,000 to $39,999930 $40,000 to $49,9991,218 $50,000 to $59,9993,529 $60,000 to $74,9993,644 $75,000 to $99,9992,249 $100,000 to $124,9993,331 $125,000 to $149,9994,811 $150,000 to $199,9996,503 $200,000 or more
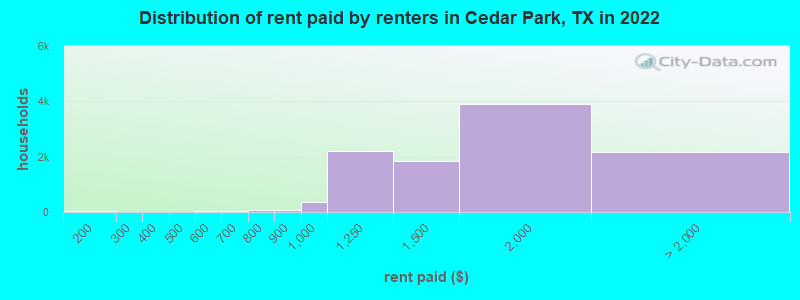
Home value of owner - occupied houses in 2022 in Cedar Park, TX 117 Less than $10,00017 $15,000 to $19,99948 $20,000 to $24,99920 $30,000 to $34,99939 $50,000 to $59,99922 $60,000 to $69,9991 $80,000 to $89,999125 $90,000 to $99,99949 $100,000 to $124,99940 $125,000 to $149,999111 $150,000 to $174,99979 $175,000 to $199,999537 $200,000 to $249,9991,218 $250,000 to $299,9993,094 $300,000 to $399,9995,772 $400,000 to $499,9998,219 $500,000 to $749,9993,443 $750,000 to $999,9991,020 $1,000,000 to $1,499,999144 $1,500,000 to $1,999,999102 $2,000,000 or moreRent paid by renters in 2022 in Cedar Park, TX 41 $150 to $1997 $350 to $39910 $450 to $49928 $500 to $54931 $600 to $64912 $650 to $69923 $700 to $74955 $750 to $79963 $800 to $899356 $900 to $9992,199 $1,000 to $1,2491,850 $1,250 to $1,4993,897 $1,500 to $1,9991,572 $2,000 to $2,499260 $2,500 to $2,999133 $3,000 to $3,499184 No cash rent
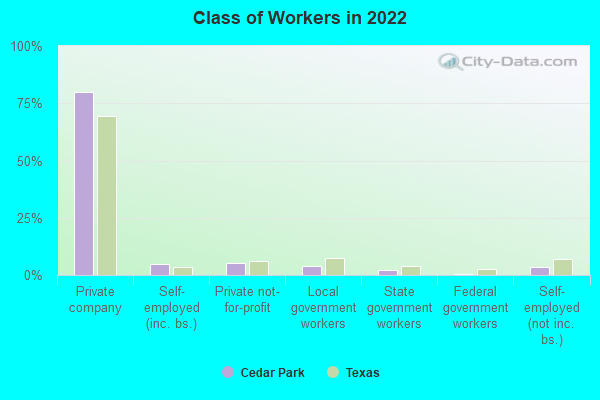
Percentage of workers working in this county: 70.8%Number of people working at home: 15,717 (34.5% of all workers )
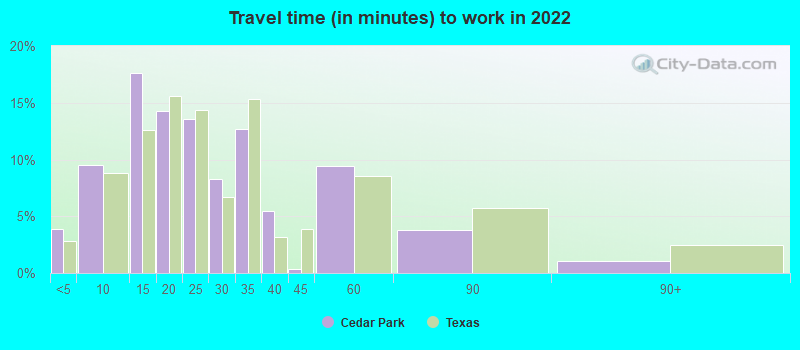
Travel time to work (commute)
Less than 5 minutes: 7575 to 9 minutes: 1,41110 to 14 minutes: 5,00815 to 19 minutes: 4,92820 to 24 minutes: 4,13125 to 29 minutes: 2,52830 to 34 minutes: 2,91135 to 39 minutes: 2,16940 to 44 minutes: 1,57845 to 59 minutes: 2,16360 to 89 minutes: 87190 or more minutes: 441
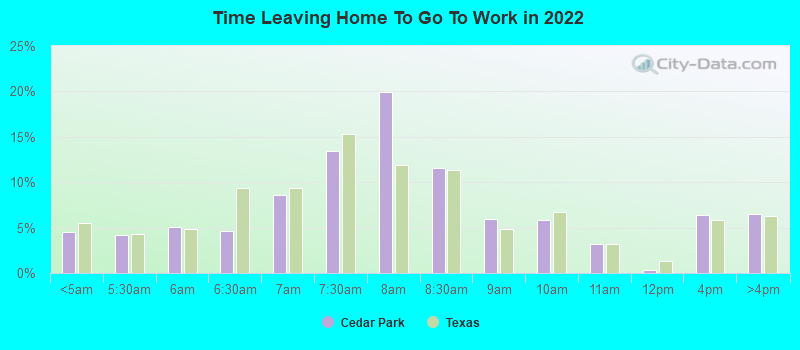
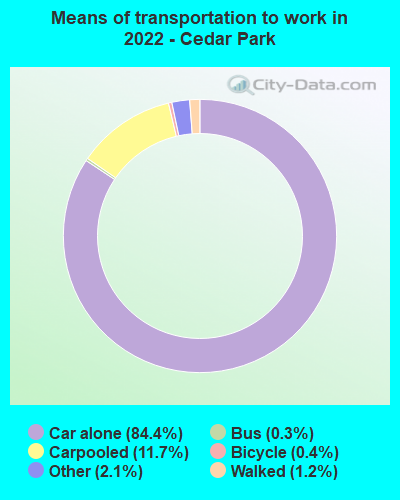
Means of transportation to work:
Drove a car alone: 25,294 (56.3%)Carpooled: 2,851 (6.3%)Bus : 59 (0.1%)Taxi: 854 (1.9%)Bicycle: 91 (0.2%)Walked: 449 (1.0%)Worked at home: 15,717 (35.0%)
Unemployment by race in 2022
Unemployment rate for White non-Hispanic residents 1.9% Males3.2% FemalesUnemployment rate for Black residents 11.5% FemalesUnemployment rate for Asian residents 1.1% Males4.9% FemalesUnemployment rate for other race residents 8.0% Males5.1% FemalesUnemployment rate for two or more race residents 2.9% Males0.3% FemalesUnemployment rate for Hispanic or Latino residents 1.9% Males1.3% Females
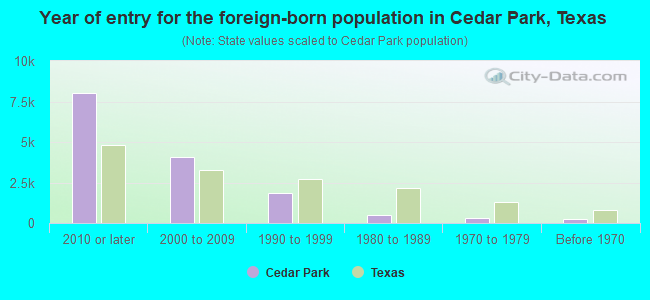
Year of entry for the foreign-born population in Cedar Park, Texas
8,026 2010 or later 4,101 2000 to 2009 1,880 1990 to 1999 490 1980 to 1989 281 1970 to 1979 264 Before 1970
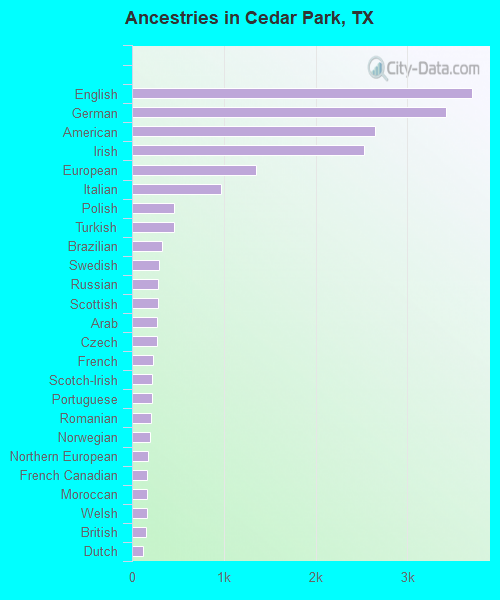
First ancestries reported:
English: 3,705 (9.4%)
German: 3,420 (8.7%)
American: 2,653 (6.7%)
Irish: 2,532 (6.4%)
European: 1,355 (3.4%)
Italian: 966 (2.5%)
Polish: 459 (1.2%)
Turkish: 456 (1.2%)
Brazilian: 324 (0.8%)
Swedish: 291 (0.7%)
Russian: 284 (0.7%)
Scottish: 280 (0.7%)
Arab: 270 (0.7%)
Czech: 269 (0.7%)
French: 226 (0.6%)
Scotch-Irish: 217 (0.6%)
Portuguese: 214 (0.5%)
Romanian: 204 (0.5%)
Norwegian: 201 (0.5%)
Northern European: 176 (0.4%)
French Canadian: 167 (0.4%)
Moroccan: 161 (0.4%)
Welsh: 160 (0.4%)
British: 153 (0.4%)
Dutch: 124 (0.3%)
Ukrainian: 117 (0.3%)
Greek: 102 (0.3%)
Canadian: 86 (0.2%)
Czechoslovakian: 62 (0.2%)
Scandinavian: 52 (0.1%)
Austrian: 49 (0.1%)
Eastern European: 45 (0.1%)
Australian: 44 (0.1%)
Lebanese: 38 (0.10%)
Albanian: 37 (0.09%)
Senegalese: 36 (0.09%)
Nigerian: 34 (0.09%)
Iranian: 33 (0.08%)
Danish: 32 (0.08%)
Slovene: 32 (0.08%)
Pennsylvania German: 32 (0.08%)
Estonian: 19 (0.05%)
Egyptian: 19 (0.05%)
Slovak: 19 (0.05%)
Hungarian: 13 (0.03%)
British West Indian: 12 (0.03%)
Slavic: 11 (0.03%)
Swiss: 11 (0.03%)
Israeli: 9 (0.02%)
Icelander: 9 (0.02%)
Ethiopian: 8 (0.02%)
Trinidadian and Tobagonian: 8 (0.02%)
Lithuanian: 7 (0.02%)
Most common places of birth for foreign-born residents (%): India Cedar Park:
28.2% (3,763)Texas:
6.1% (306,347)
Mexico Cedar Park:
15.5% (2,075)Texas:
48.4% (2,411,723)
China, excluding Hong Kong and Taiwan Cedar Park:
6.2% (833)Texas:
2.3% (115,558)
Korea Cedar Park:
4.8% (646)Texas:
1.2% (60,172)
Vietnam Cedar Park:
3.8% (505)Texas:
3.7% (184,770)
Turkey Cedar Park:
3.6% (479)Texas:
0.3% (13,298)
Canada Cedar Park:
2.8% (373)Texas:
1.1% (55,371)
Cuba Cedar Park:
2.5% (340)Texas:
1.3% (62,978)
Pakistan Cedar Park:
2.3% (304)Texas:
1.2% (62,159)
Brazil Cedar Park:
2.1% (280)Texas:
0.5% (24,723)
Nepal Cedar Park:
2.1% (276)Texas:
0.6% (27,480)
Peru Cedar Park:
1.9% (257)Texas:
0.4% (21,746)
Venezuela Cedar Park:
1.7% (230)Texas:
1.5% (72,413)
Moldova Cedar Park:
1.5% (204)Texas:
0.0% (996)
Place of birth for U.S.-born residents:
This state: 33,206Other state: 26,645Northeast: 3,295Midwest: 8,025South: 5,123West: 10,202 86.7% of Cedar Park residents lived in the same house 1 years ago.
Out of people who lived in different houses, 27.2% lived in this county.
Out of people who lived in different counties, 50.3% lived in Texas.
Cedar Park:
86.7%State average:
85.7%
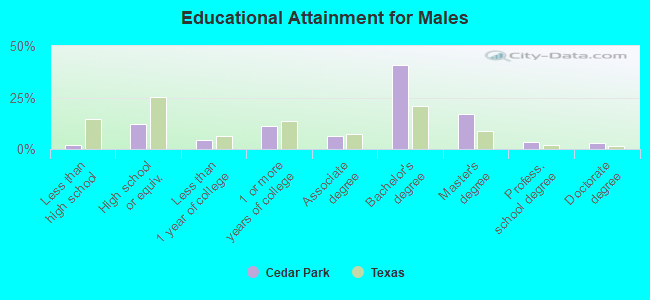
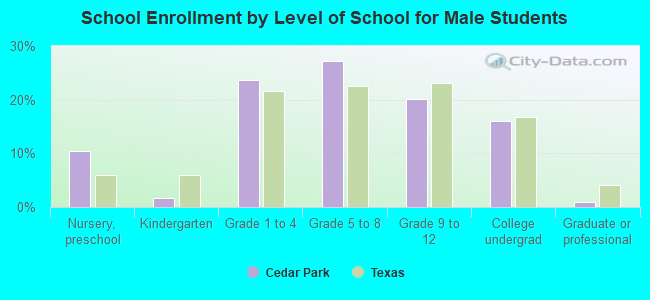
Education attainment for males 25 years and older:
No schooling: 269Nursery to 4th grade: 05th and 6th grade: 107th and 8th grade: 09th grade: 010th grade: 011th grade: 11912th grade, no diploma: 85High school graduate (or equivalency): 3,157Less than 1 year of college: 1,087Some college more than 1 year, no degree: 2,908Associate degree: 1,640Bachelor's degree: 10,583Master's degree: 4,427Professional school degree: 935Doctorate degree: 738
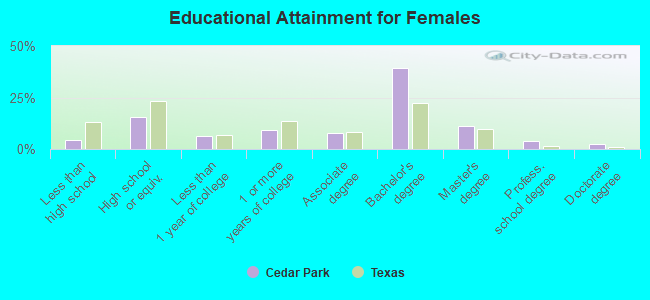
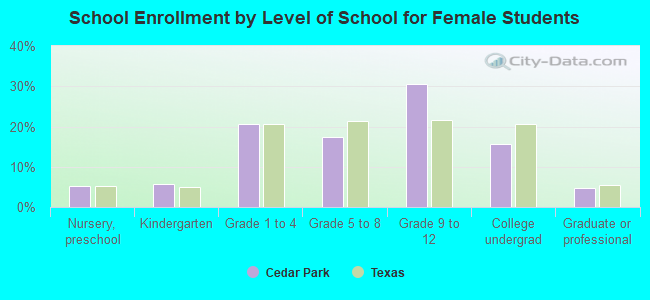
Education attainment for females 25 years and older:
No schooling: 358Nursery to 4th grade: 455th and 6th grade: 467th and 8th grade: 09th grade: 4610th grade: 2011th grade: 24012th grade, no diploma: 440High school graduate (or equivalency): 4,236Less than 1 year of college: 1,701Some college more than 1 year, no degree: 2,545Associate degree: 2,191Bachelor's degree: 10,834Master's degree: 3,102Professional school degree: 1,118Doctorate degree: 644
Housing units in structures:
One, detached: 20,756One, attached: 1,053Two: 3143 or 4: 2455 to 9: 89610 to 19: 1,85220 to 49: 79650 or more: 4,468Mobile homes: 429Median worth of mobile homes: $196,297
Housing units lacking complete kitchen facilities in 2022: 1.4%House/condo owner moved in on average 8 years ago
Renter moved in on average 1 years ago
Private vs. public school enrollment:
Students in private schools in grades 1 to 8 (elementary and middle school): 649 Students in private schools in grades 9 to 12 (high school): 154 Students in private undergraduate colleges: 288